Aerospace Automated Drilling and Fastening Technology Product Selection Framework
by
Zachary David Talus
B.S.E. Mechanical Engineering, University of Michigan, 2012
Submitted to the MIT Sloan School of Management and the Department of Aeronautics and Astronautics Engineering in Partial Fulfillment of the Requirements for the Degrees of
Master of Business Administration and
Master of Science in Aeronautics and Astronautics Engineering In conjunction with the Leaders for Global Operations Program at the
Massachusetts Institute of Technology June 2019
2019 Zachary David Talus. All rights reserved.
The author hereby grants to MIT permission to reproduce and to distribute publicly copies of this thesis document in whole or in part in any medium now known or hereafter.
Signature of Author
Signature redacted
MIT Sloan School of Management, MIT Department of Ae nautics and Astronautics
Signature redacted
May 10, 2019Certified by
Julie Shah, Thesis Supervisor kssociate Professor of Aeronautics and Astronautics
Certified by
Signature redacted___
(/
Michael Cusumano, Thesis SupervisorSloan Management Review Distingh ed ProfessTprf Management
Signature redacted_
Sertac Karai-an, Chair, Graduate Program Committee Associate Professor of Aeronautics and Astronautics
Signature redacted
Accepted by
Accepted by
1Maura I-erson,
Assistant
Dean, MBA Program MIT Sloan School of ManagementJON
I
4v
Aerospace Automated Drilling and Fastening Technology Product Selection Framework
by
Zachary David Talus
Submitted to the MIT Sloan School of Management and the MIT Department of Aeronautics and Astronautics Engineering on May 10, 2019 in Partial Fulfillment of the Requirements for the
Degrees of Master of Business Administration and Master of Science in Aeronautics and Astronautics Engineering
Abstract
Ascent Aerospace is a global tooling and factory automation supplier for the Aerospace industry. Ascent's customers are typically introducing automation for the first time, or have already introduced automation to their production systems and are wary of its challenges. Choosing the appropriate technology is essential in ensuring successful implementation for both Ascent's customers and Ascent itself.
Ascent has two different business units that produce equipment to automate the drilling and fastening of aerospace structures. These two units each come with vast product portfolios, and distinct approaches to address customer needs. This thesis focuses on an efficient method of evaluating how Ascent's current products align with customer's requirements, as well as identifying any technology gaps needing further exploration. This thesis argues that Ascent's multiple business units are not currently equipped to advise their customers on investing in the appropriate technology for their production systems.
To investigate such a vast solution space, a framework developed by the Systems Engineering Advancement Research Initiative (SEARI) at the Massachusetts Institute of Technology (MIT) is utilized called Multi-Attribute Tradespace Exploration (MATE). Using this framework, a
software package called the Product Selection Tool, was developed to analyze how Ascent's product portfolio satisfies the customer's requirements for specific applications.
The Product Selection Tool visualizes Ascent's 71 different product offerings on a single graph of utility versus cost per fastener. The interface that displays the graph is dynamic, allowing Ascent's customers to adjust their requirements and preferences in real time, and visualize the sensitivity, or risk, of the recommended solution based on their specific requirements. This new approach allows Ascent to closely work with their customer in selecting a solution, identify areas of concern early on in the product selection process, and introduce cost-effective technology. This model can be applied to a variety of applications that have a vast solution space, reducing the complexity of understanding and communicating one's product line and/or capabilities. Thesis Supervisor: Julie Shah
Title: Associate Professor of Aeronautics and Astronautics Thesis Supervisor: Michael Cusumano
Acknowledgments
I would first like to acknowledge my MIT academic advisors, Michael Cusumano and
Julie Shah, for their guidance and support in shaping the direction of this project. I would also like to thank both the AIP and Ascent teams, who worked with me to navigate the numerous stakeholders involved in this research.
I would especially like to thank my supervisors, Marek Kos and Karl Bumgarner, who
provided so much of their time to help me understand the products we analyzed, further refine my research topic, and dive into the extremely technical elements of the analysis.
Additionally, I would like to acknowledge the Leaders for Global Operations (LGO) program staff and my fellow LGO classmates for their guidance in making the internship and thesis writing process progress go so smoothly.
I would also like to thank my parents for their support and for encouraging me to always
challenge myself.
Finally, I would like to thank my fiance, Amy Henson, for embarking on this two-year
LGO journey with me and, most importantly, spending countless hours helping me edit this
Table of Contents
A bstract ... 3
A cknow ledgm ents ... 5
T able of Contents ... 7
List of Figures ... 10
List of Tables... 11
1 Introduction ... 12
1.1 Ascent Aerospace ... 13
1.2 Problem Statem ent... 14
1.3 Project Goals ... 16
1.4 Thesis Overview ... 16
2 Drilling and Fastening Technology Overview ... 18
2.1 Traditional M anual Fastening ... 18
2.2 One-Up Assem bly ... 19
2.3 Automated Fastening Equipment Sub-Systems... 20
2.3.1 Process Head ... 20
2.3.2 M otion Platform s...21
2.3.3 Positioning System ... 22
2.4 Potential Applications and their Challenges ... 24
2.4.1 Large-Scale Applications ... 24
2.4.2 Sm all-Scale Applications ... 27
3 Multi-Attribute Tradespace Exploration ... 29 3.1 Decision m akers ... 29 3.2 Attribute Definition... 31 3.2.1 Custom er Attributes...31 3.2.2 User Attributes ... 32 3.2.3 Firm Attributes...33
3.3 Utility Assessm ent... 34
3.3.1 Interview Process... ... 35
3.3.2 M ulti-Attribute Utility...37
3.4 Design Variables... 38
3.4.1 Design Variable Inputs ... 38
3.4.2 Design Variable Outputs ... 40
3.5 Production System Requirem ents ... 41
3.6 Total Cost... 44
3.7 Sim ulation and User Interface... 45
3.8 Results... 46
3.9 Sum m ary ... 47
4 Technology Provisioning ... 48
4.1 Current Ascent Aerospace Technology ... 48
4.1.1 M onum ent Autom ation Solutions ... 48
4.1.2 Flexible Autom ation Solutions... 52
4.2 Gaps in Product Tradespace and Future Product Improvements... 54
4.3 Appetite for Unproven Technology ... 57
4.3.1 Historical Unproven Automation Technology Introduction ... 57
4.4 Sum m ary ... 59
5 Applying the Product Selection Tool...60
5.1 Sales Team A doption ... 60
5.1.1 Differentiation Am ong Com petitors ... 60
5.2 Proposal Team A doption ... 61
5.2.1 Sensitivity Analysis...61
6 Conclu sion and Future W ork ... 63
6.1 O ne Year Plan ... 63
6.2 Five Year Plan ... 64
6.3 Sum m ary ... 64
List of Figures
Figure 1: "Arc Frame" drilling and fastening for fuselage skin to frame join ... 15
Figure 2: Manual overhead riveting[4]... 18
Figure 3: Kuka AGV based motion platform [8]... 23
Figure 4: Optimistic approach ignores risks of introducing automation[9]... 25
Figure 5: Boeing 777 FAUB automation[11]... 26
Figure 6: Mechanic removing Clecos from an F-35[14]... 27
Figure 7: Decision maker's roles and levels[15]... 30
Figure 8: Single attribute utility curve definition [16] ... 34
F igu re 9 : P roject o p tio n s ... 35
Figure 10: Utility assessment of accuracy post vision sync ... 37
Figure 11: Product Selection Tool Output and User Interface ... 46
Figure 12: Gemcor G12 Motion Platform... 49
Figure 13: Gemcor G86 Motion Platform... 50
Figure 14: Gemcor G2000 Motion Platform ... 51
Figure 15: Brown Single Sided Motion Platform ... 52
Figure 16: Brown robotic motion platform ... 53
Figure 17: Exechon Parallel Kinematic Motion Platform[17]... 54
Figure 18: Tradeoff between potential product solutions... 54
Figure 19: Speed improvements to solution 41... 56
List of Tables
T ab le 1 : C u stom er attrib utes... 3 2
T ab le 2 : U ser attrib u tes ... 3 3
T ab le 3 : F irm attrib u tes... 3 3
Table 4: Accuracy post vision sync utility questions... 36
Table 5: Attribute weighting factors... 38
Table 6: Design Variable Inputs -Motion Platform Options ... 39
Table 7: Design Variable Inputs -Process Head Options ... 39
Table 8: Design Variable Inputs -Positioning System Options... 39
Table 9: Design Variable Outputs ... 41
1
Introduction
Aerospace automated drilling and fastening technology has been around since World War
II. However, with pricing pressure in the global economy, as well as rapidly increasing
technological advancements, today's Original Equipment Manufacturers (OEMs) have increased the adoption of automating the joining of aerospace structures. OEMs' demand for fast, reliable,
flexible solutions has led several automation suppliers to over promise and under deliver[I]. Now, OEMs are looking at their own product portfolios and questioning whether they align with
their customers' needs and will meet the manufacturing requirements of the future.
The drastically different products in the aerospace industry, from small helicopters and engine nacelles, to twin aisle airplanes and large rockets, demand a wide range of drilling and fastening solutions. Accuracy might be critical to one OEM, where reliability and speed might be critical to another. Today, the OEMs assume the responsibility of defining and communicating requirements, expecting suppliers to select the solution that meets their needs.
To investigate such a vast solution space, a framework developed by the Systems Engineering Advancement Research Initiative (SEARI) at the Massachusetts Institute of Technology (MIT) was utilized called Multi-Attribute Tradespace Exploration (MATE)[ 1]. Using this framework, a software tool was developed to analyze how Ascent's product portfolio satisfies customers' requirements for a specific application. This project analyzes the current drilling and fastening landscape to assess if Ascent's product portfolio needs rationalizing, as well as identify any technology gaps that require further exploration.
1.1 Ascent Aerospace
Ascent Aerospace (Ascent), a portfolio company of American Industrial Partners (AIP), is a vertically-integrated tooling, factory automation, and assembly line integration supplier.
With approximately 1,100 employees located across California, Washington, Michigan, New York, and Toulouse, France, Ascent currently supports almost every major aerospace
program[2]. Ascent is comprised of five legacy companies: Coast Composites, Odyssey Industries, Global Tooling Systems, Gemcor, and Brown Aerospace. These companies were brought together for their complementary sets of expertise.
Ascent acquired both Gemcor and Brown to address the demand for increased automation in aerospace manufacturing-specifically automated drilling and fastening technology. Brown focuses on one-off, robotic based, flexible solutions. Each one of their products is
custom-designed specifically around the customer's application. Gemcor has been in business since 1937 and focuses on large-scale platforms[3]. Gemcor is known in the industry for its extremely fast and reliable equipment. These two acquisitions each came to Ascent with their own vast product portfolios and distinct approaches to addressing customer needs.
1.2 Problem Statement
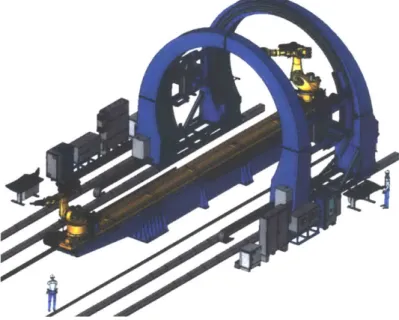
Several of Ascent's customers have struggled with introducing factory automation over the past several years. Choosing the appropriate technology is essential for ensuring successful implementation for both Ascent's customers and Ascent itself. An example of these complex pieces of equipment can be seen in Figure 1 below.
Figure 1: "Arc Frame" drilling and fastening for fuselage skin to frame join
Selecting the appropriate fastening technology system can be complicated by the vast number of product offerings and configurations; the complexity of the systems; the unique preferences of the customer; and the specific requirements of each application. The multitude of variables in the equipment selection process, however, is overshadowed by the standardized Request for Quote (RFQ) process used by Ascent and their customers. Although a solution might satisfy the requirements of a customer, it may not be the value maximizing solution.
Ascent needs an efficient method of evaluating how their current products align with customer requirements, as well as key data-driven initiatives to ensure they remain the
technology leaders of the aerospace tooling and equipment industry. The hypothesis of this thesis is that Ascent's multiple business units are not currently equipped to advise their customers on investing in the appropriate technology for their production systems.
1.3
Project Goals
The goal of this project is to assess Ascent's varied product portfolio. This project will distill Ascent's product offerings into a tool that will facilitate efficient communication between employees of Ascent, as well as between Ascent and their customers. This will enable Ascent to recommend personalized technical solutions for customer applications, understand what
technology gaps exist in their product offerings, and recognize what the future of the industry might require.
1.4 Thesis Overview
Below is a high-level overview of what content to expect in building the case for adopting the Product Selection Tool.
Chapter 2 explores current aerospace automated drilling and fastening technology, and
the manual processes that such automation technology is replacing. This chapter breaks down automation equipment into its major components and discusses the potential applications for these products.
Chapter 3 walks through the Product Selection Tool. This tool is used to analyze
Ascent's product portfolio and assess how the portfolio satisfies customer requirements. The process begins with determining the decision makers and what attributes they value. Next, the design variables that characterize each of Ascent's products are documented and mapped to the attributes. Finally, a utility score and total cost is calculated for each product, based on the specific application.
Chapter 4 looks at Ascent's current aerospace drilling and fastening technology. This
chapter discusses gaps found in Ascent's product portfolio using the Product Selection Tool, and recommends potential products to incorporate for a more complete offering. Chapter 4 also
reviews the potential value of unproven technology in the Aerospace industry, exploring the benefits and risks of taking on research and development for new technology without a contract from a customer.
Chapter 5 provides a strategy for incorporating the Product Selection Tool into the daily operation of the Sales and Proposal teams at Ascent. This chapter will also review future
improvements that can be made to the Product Selection Tool that will bolster its effectiveness.
Chapter 6 reviews recommendations for the near and long-term steps Ascent can take to
bolster their product offering and maintain their status as a leader in the industry. Additionally, this chapter includes a summary of the overall findings and potential research for furthering this project.
4
2 Drilling and Fastening Technology Overview
Aluminum and composite aerospace structures are traditionally assembled through the joining of overlapping layers. Hundreds of thousands of fasteners are installed in these joints for
a single airplane. As aerospace companies continue to introduce automation into their production systems, they require increasingly complex systems to replace the labor-intensive operation of drilling and fastening parts together.
2.1 Traditional Manual Fastening
The manual task of drilling and installing fasteners is repetitive and puts immense stress on mechanics' joints. In other words, the positioning required for mechanics to perform this task is not ergonomic.
Figure 2: Manual overhead riveting[41
Due to the physically challenging nature of this work, numerous quality defects slow down the overall process. The manual drilling and fastening process can be broken down into the following steps:
1. Back drill through pre-drilled holes (pilot holes), found on the innermost layer of the
2. Install temporary fasteners in the pilot holes to bring the layers together and secure them in place.
3. Lay drill templates on the outside of the structure that index to the temporary
fasteners.
4. Using the drill templates, drill all holes in the structure. 5. Remove the temporary fasteners.
6. Separate the layers of structure, clean the interface between the layers, and deburr all
holes.
7. Install permanent fasteners in all holes.
The installation of permanent fasteners requires a bolt with a nut threaded on the end or a rivet. A rivet is installed by a mechanic who hammers the fastener from one side, while a second mechanic bucks the fastener from the opposite side. This process is not only time consuming, but also puts an incredible amount of force on the mechanics' bodies, often leading to cumulative trauma disorders (CTDs) [5].
2.2
One-Up Assembly
Fully automating the drilling and fastening of aerospace structures requires a process called one-up assembly. The one-up assembly process eliminates the need to separate and deburr the drilled layers of material prior to installing fasteners. The elimination of these
time-consuming steps is accomplished by sufficiently clamping the layers of material together during the drilling process, in order to prevent chips or burrs from accumulating between the layers.
There are three methods in which clamp-up between layers is achieved. The first method of clamp-up uses tooling to provide rigid backing pressure to the external, automated equipment.
The tooling is installed on the interior of the structure manually, and must be removed once the automated drilling and fastening process is complete. The second method of clamp-up uses automated equipment on the interior of the structure to provide an opposing force to the external equipment. This internal equipment is typically used when the bucking of rivets, threading of collars, or swaging of collars is automated. The third method, called adjacent-hole clamp-up, utilizes fasteners adjacent to the hole being drilled to provide clamp-up[6]. Selecting the
appropriate clamp-up method depends on the material being drilled, the stiffness of the structure, and the fastener that is being installed.
2.3 Automated Fastening Equipment Sub-Systems
The equipment used in automated drilling and one-up assembly is extremely complicated and has many layers of sub-systems. To simplify the analysis and maintain a limited number of product configurations, the following three key sub-systems will be explored: the process head, the motion platform, and the positioning system. These three sub-systems cover the primary variants that make up the overall equipment.
2.3.1 Process Head
The process head, or end effector, is the automated system that performs all of the value added work. These extremely complex systems are comprised of multiple modules that each perform a different function. Below are some of the modules that are included in a multi-function process head:
1. A vision system, typically camera based, that enables accurate positioning of the
2. A drill module, which consists of a drill bit and, depending on the complexity of the operation, a tool changer to swap out drill bits for different size holes.
3. A deburr module, to remove burrs from the backside of the drilled hole.
4. A hole probe, which inspects the quality of the drilled hole.
5. An insertion module, which securely holds and inserts a fastener into a drilled hole.
6. A squeeze or hammer module, which forms the fastener, in the case of rivets.
7. A sealant module, which applies sealant to the hole or fastener being installed. 8. A pressure and normalization foot, which controls the amount of force being applied
to the part and the normality of the process head to the part.
9. A fastener flushness module, which checks the protrusion of the fastener from the
part surface, thereby checking the countersink depth of the drilled hole.
10. A fastener verification module, which ensures the fastener does not fall out of the
hole when the pressure foot is removed.
Process heads can be simple, including only a vision and drill module, or complex, including a majority of the modules listed above. The advantage of including multiple modules in a single process head is that doing so minimizes the non-value added work, such as set-up time, and can potentially reduce the number of motion platforms.
2.3.2 Motion Platforms
The motion platform system enables large movements of the process head. Typical aerospace applications may require drilling operations that span from one foot all the way to 100 feet. Transporting the process head to cover such a large area requires different combinations of components, depending on the application. These motion platform systems include components
such as robotic arms, space to hold a multitude of sub-systems (such as fastener feed systems and air compressors), and any control systems associated with moving these components.
Motion platforms are considered monuments if they are not easily moved around a factory[7]. These monument motion platforms require foundations installed in the factory floor, consisting of six to ten feet deep concrete slabs reinforced with rebar. The foundations support the motion platform's weight and allow the system to meet the customer's accuracy
requirements.
Flexible motion platforms move around the factory on wheels or linear rails. These rails are simply bolted to the factory floor, and do not require the installation of any additional factory floor foundation. Flexible systems provide the added benefit of allowing factory reconfiguration, or even the ability to move an operation to a completely different factory, without significantly disrupting production.
2.3.3 Positioning System
The complexity of the positioning system is dictated by the accuracy of the requirements from the customer. Additionally, increasing the system's accuracy may come at the cost of increased cycle time. Automated drilling and fastening equipment is outfitted with two different positioning systems: a global positioning system and a local positioning system. The global positioning system is responsible for aligning the motion platform to the correct position alongside the part, whereas the local positioning system is responsible for aligning the process head to the next drill location.
There are two major variations of the global positioning system: an Automated Guided Vehicle (AGV) and linear rails. An AGV typically moves on wheels and positions itself using
cameras, magnets, or lasers. These systems are typically accurate to within only a quarter of an inch, but are extremely flexible, as they require little to no infrastructure in the factory.
Figure 3: Kuka AGV based motion platform[8]
Linear rails are much more accurate; rather than rely on cameras, magnets, or lasers, they are programmed to drive to a predetermined location. Utilizing linear rails drastically reduces the motion platform positioning process.
If the risk of colliding with a part structure is high, laser trackers can supplement the
motion platform system to further increase the accuracy of the global positioning system. Laser trackers measure both the part and the motion platform, providing real positional data instead of nominal positional data. However, the addition of laser trackers significantly increases the time to position the motion platform.
Once the motion platform is positioned, the local positioning system takes over. This system typically consists of lasers and cameras on the process head. These measurement devices locate key features on the part and provide instructions to the process head regarding how far it must travel to the desired location. These systems are capable of positioning a process head to within several thousandths of an inch.
2.4 Potential Applications and their Challenges
Replacing the labor-intensive drilling and fastening of aerospace structures is not appropriate for every situation. The three main driving factors that lead to automating this operation are to create a safer workplace, to increase productivity, or to increase quality. However, without conservatively analyzing the equipment being installed, customers tend to overestimate the benefit of automation.
2.4.1 Large-Scale Applications
Large-scale applications often provide the most opportunity for savings in cost, time, and safety. These applications tend to have tens of thousands of fasteners that can be automated, enabling a customer to make a much stronger business case versus applications with only a couple hundred fasteners. A previous Leaders for Global Operations (LGO) thesis by Sean Caetano explores the business case for introducing automated drilling and fastening equipment into a large scale application[9]. Specifically, Caetano's thesis focuses on the Embraer E2 program. When considering the time it takes to complete an automated task, Caetano argues that customers should factor in the easy learning curve required. Such an aggressive learning curve turns the business case for implementing automated drilling and fastening equipment positive.
In the Embraer E2 case study, the customer assumed a Net Present Value (NPV) of
$16M, with an investment of only $12M. The chart below shows the customer in the study has a
Assembly hours - Full Program 14000 12000 10000 0 8000 6000 2000 0 0 20 40 60 80 100 120 140 160 1I 200 220 Shipsets
-- W Automation Ascent Prdictin io-l- anual -- -W Aluronati'n (ion N Iii .i:
Figure 4: Optimistic approach ignores risks of introducing automation[9]
Ascent must work with the customer to show the risks that certain automation equipment can pose to their production systems. Overly optimistic business cases can lead a customer to select a much too aggressive piece of equipment.
Another example of a large-scale automation project that has struggled with adopting automation is Boeing's Fuselage Automated Upright Build (FAUB) [10]. FAUB automates approximately 60,000 fasteners on the forward and aft fuselage of the Boeing 777 and 777X[ 11]. This program has found difficulties with maintaining production schedules and the necessary quality level since automation was introduced in 2016.
Figure 5: Boeing 777 FAUB automation[11]
According to FAUB, a major cause of the challenge stems from the quality of the parts they receive from their suppliers[ 10]. The slower-than-anticipated introduction has also impacted
Boeing's downstream operations; in late 2017, several Boeing employees said the 777 production line is approximately 12,000 tasks behind schedule[ 12].
Automating such a large product requires the coordination of many systems, which naturally increases the number of automated interfaces and opportunities for failures. Additionally, the impact of a minor increase in cycle time is amplified by the number of fasteners. For example, if the customer does not believe they will need a quality inspection module when purchasing the equipment, that time to probe the hole will not be incorporated into the business case. However, if certain quality issues appear, or if they elect to reduce the amount of manual inspection[ 13], they will need to incorporate additional inspection steps.
Another scenario that could increase the cycle time of an operation is if the part, or equipment, is not sufficiently stable and requires a longer settling time. If the process requires FAUB's drilling operation to pause for even one second (to allow for a quality inspection or for the equipment to settle), it will add 60,000 seconds, or two shifts, to the overall manufacturing process.
2.4.2 Small-Scale Applications
Cycle time increases are less impactful on small-scale applications. However, automating engine nacelles, or fighter jet wings, poses other challenges. Typically, small-scale applications have smaller restrictions on physical access and require tighter tolerances. A common oversight is that 3D models, provided by customers, do not contain all of the tooling, equipment, and materials that lay on the factory floor and obstruct the path of the automation equipment. Also, brackets and Clecos are not normally shown in models when a proposal is put together[14]. All of these barriers increase the number of fasteners that the automation cannot access and therefore need to be manually installed.
16.
Figure 6: Mechanic removing Clecos from an F-35[14]
Also, meeting tight tolerances in a lab environment is much easier than maintaining such tight tolerances in a factory environment. Obtaining real production data, to prove the equipment capability, is difficult due to the sensitivity of the products being manufactured. Maintaining
tight tolerances in a production environment requires higher equipment maintenance standards and training than typically applied by the customers.
2.5
Summary
Replacing the manually intensive drilling and fastening process with automation may provide significant safety, quality, and productivity benefits to a production system. Though, to realize any benefits, the customer and supplier must be thoughtful when selecting equipment. The complexity of the equipment, and the environment it is introduced into, each pose a risk to the part being automated-and all downstream operations. Automation should be a highly
favorable option, due to the serious safety hazards of the manual process, yet customers and their suppliers can learn from previous automation introduction programs and the fallout from an overly optimistic approach.
3 Multi-Attribute Tradespace Exploration
To reduce the complexity of using a vast set of requirements and potential solutions, the framework developed by the Systems Engineering Advancement Research Initiative (SEARI) at the Massachusetts Institute of Technology (MIT) was adopted called Multi-Attribute Tradespace Exploration (MATE)[15]. Using this framework, a software called the Product Selection Tool was designed to analyze how Ascent's product portfolio satisfies requirements for a specific
application. This Chapter walks through the process of developing the Product Selection Tool.
3.1 Decision makers
Understanding the key stakeholders and decision makers is the first step in capturing the appropriate attributes, or characteristics, of the product. A stakeholder is someone who will benefit from, or be hurt by, the system in any stage of its lifecycle. The decision makers are a subset of stakeholders, notable for their ability to influence the allocation of resources[15].
The diagram below walks through the various decision makers of the automated drilling and fastening equipment, and their relationship to the product:
External Stakeholders (AIP, FAA) Firm (Ascent) Organizational Goals Designer (Ascent Engineers) 6 Contracts Level 0 Level 1 Level 2
Figure 7: Decision maker's roles and levels[ 15]
Both Level 0 decision makers, AIP and the Federal Aviation Administration, have the broadest perspective on the product. They influence policy, which the other decision makers must observe, however, their influence over the actual design and selection of the product is minimal.
There are two categories of Level 1 decision makers identified: the firm who produces the product, Ascent, and the customers who use the products. The customer controls the money associated with the project and issues a contract to the firm. The customer also dictates
requirements to the designers.
Level 2 stakeholders are the designers and users of the product. They have the greatest influence over the product portfolio and productivity of the product.
-I
Customer
(Boeing, ULA, SpaceX)
Operational Strategy
User
3.2 Attribute Definition
The complete set of attributes is used to assess the value of a particular product and should be complete, operational, decomposable, non-redundant, minimal, and perceived
independent[ 16]. Each attribute is valued according to how well the product meets the intended goal of the decision maker. The value of a product is subjective and presumed to be correlated with the satisfaction, or utility, a decision maker gets out of the product.
3.2.1 Customer Attributes
Customer attributes are quantifiable measures that assess how well the system meets the customer's objective. Customers are the management team who will be purchasing equipment.
Attribute Unit Description
Cost $ The cost refers to the cost incurred by the customer. See
Section 3.6 for details.
Allows for Yes or The solution does not allow for continuous flow if the part needs to be craned from its holding fixture into the
continuous flow No automated drilling and fastening product.
The technology readiness level (TRL) of the solution. A
TRL of 9 indicates that the system has been proven in a
production environment; 8 indicates that the system has
Simple TRL 6-9 been proven in a lab environment; 7 indicates that the
subsystems have been proven in a production
environment; 6 indicates the subsystems have been proven in a lab environment.
The percentage of the available time that the equipment is
capable of running.
The total number of fasteners per system divided by the total possible number of fasteners per system in the
available time. Assumes a factor for downtime is taken out of available hours. Assumes the motion platform performs a global positon move every time it re-indexes.
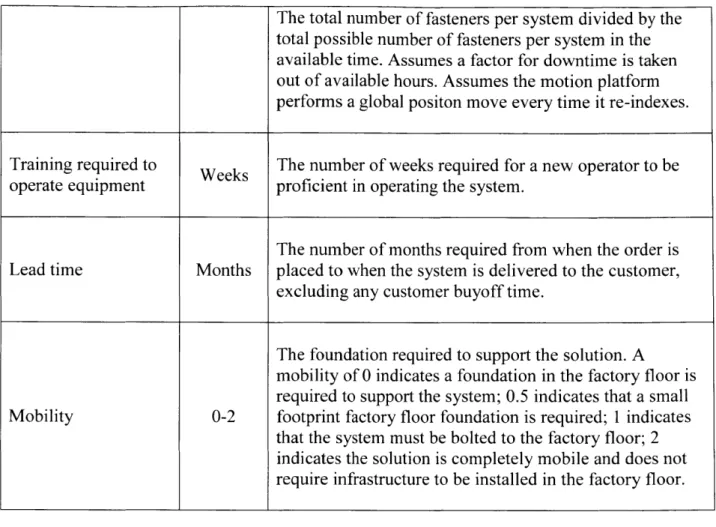
Training required to Weeks The number of weeks required for a new operator to be
operate equipment proficient in operating the system.
The number of months required from when the order is
Lead time Months placed to when the system is delivered to the customer,
excluding any customer buyoff time.
The foundation required to support the solution. A
mobility of 0 indicates a foundation in the factory floor is required to support the system; 0.5 indicates that a small
Mobility 0-2 footprint factory floor foundation is required; 1 indicates
that the system must be bolted to the factory floor; 2 indicates the solution is completely mobile and does not require infrastructure to be installed in the factory floor.
Table 1: Customer attributes
3.2.2 User Attributes
User attributes are quantifiable measures that assess how well the system meets the user's objective. Users are the engineers and the maintenance teams that operate the equipment.
Attribute Unit Description
Accuracy post vision Inches The positional accuracy of a hole, drilled with the
sync automated equipment, relative to the indexing features.
Accuracy prior to Inches The positional accuracy of the vision system to the
Stayouts % The percentage of holes intended to be automated that are outside the reach of the process head.
The relative safety of the automation solution, compared
Design for safety 0-5 to the other possible solutions. A score of 0 implies a safer
solution versus a score of 5.
Modules 1-8 The number of modules required to be held on a process
head.
Table 2: User attributes
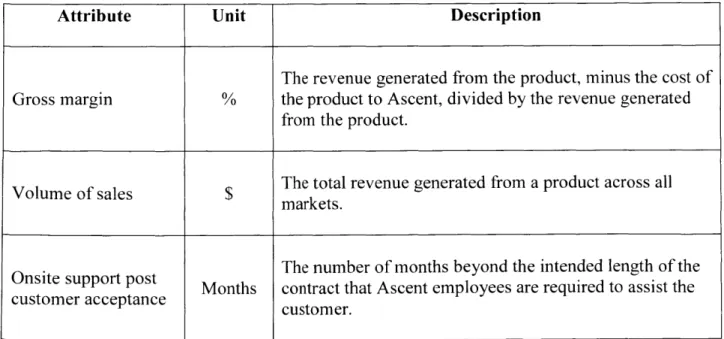
3.2.3 Firm Attributes
The firm attributes are quantifiable measures that assess how well the system meets the firm's objective. The firm is the Ascent management team.
Attribute Unit Description
The revenue generated from the product, minus the cost of
Gross margin % the product to Ascent, divided by the revenue generated
from the product.
Volume of sales $ The total revenue generated from a product across all
markets.
The number of months beyond the intended length of the
Onsite sUcpOrt post Months contract that Ascent employees are required to assist the
customer acceptance customer.
The firm attributes are excluded from the model developed for Ascent, due to Ascent's desire to tailor this tool toward the needs of the customer, as well as to obscure any sensitive data regarding the profitability of the product. When evaluating the total utility of products to Ascent and their customers, such as evaluating which products should be eliminated from Ascent's product catalog, the firm attributes should be reintroduced.
3.3 Utility Assessment
A single attribute utility curve is used to derive the value each decision maker receives
from a given attribute. The dimensionless function, U, for each attribute, X, is defined as:
Ui = U(Xi)
Where Ui = 0 is the least desirable, but acceptable value of X, and U= I is the most
(1)
desirable value of X [16].
0
Excluded Attribute Values
__________________________________________________________________________________________________ I
Excess Attribute Values Assigned Utility = 1
Attribute Value
Figure 8: Single attribute utility curve definition [16]
The utility derived from each attribute's value was found using a two-step process. First,
an oral interview of the decision maker was used to establish a baseline curve. Second, the results were reviewed with the interviewee, and refinements were made if necessary.
3.3.1 Interview Process
This section reviews the interview process for the customer attribute of accuracy post
vision sync. The first question of the interview establishes the level of accuracy that is
completely unacceptable to the customer. For this attribute, the result was X, = 0.022". The second question establishes the level of accuracy beyond which the customer received no additional satisfaction. For this attribute, the result was X* = 0.005".
Next, the interviewee was asked a series of questions, adjusting the variables according to
Table 4 below, to assess which of the two hypothetical projects was preferred, Project A or
Project B. Project A has a 50% chance of having an accuracy of Xi, and a 50% chance of having
an accuracy of X,. Project B has a Pj chance of having an accuracy of X*and a 1 - Pj chance of
having an accuracy of X,.
If the interviewee selected Project B, then P decreased and the question was asked again. If the interviewee selected Project A, then P increased and the question was asked again. If the
interviewee was indifferent between the two projects, the variable P was stored and the next X
was incorporated into the question.
Project A
Project B
50 JP (0.005")
50% 1
-P-(0.022") (0.022")
Question X Pj A B Indifferent 1 0.020 45 x 2 0.020 5 x 3 0.020 2 x 4 0.020 2.5 x 5 0.018 45 x 6 0.018 3 x 7 0.018 10 x 8 0.018 4 x 9 0.018 5 x 10 0.016 45 x 11 0.016 8 x 12 0.016 10 x 13 0.014 45 x 14 0.014 15 x 15 0.012 45 x 16 0.012 20 x 17 0.012 30 x 18 0.010 45 x 19 0.008 49 x 20 0.008 46 x 21 0.008 47.5 x
Table 4: Accuracy post vision sync utility questions
At the point of indifference (Xi), the utility of the interviewee was calculated using the following equation:
U(Xj) = 2 x P (2)
Below is the utility graph for accuracy post vision sync. An accuracy below 0.005" is considered to have a utility of one, and an accuracy greater than 0.022" is considered to have a utility of zero.
0.8 0.6 S0. 4 0.2 0 0.000 0.005 0.010 0.015 0.020 0.025
Accuracy post vision sync (inches)
Figure 10: Utility assessment of accuracy post vision sync
3.3.2 Multi-Attribute Utility
To combine all single attribute utility scores into a single utility score, a weighting factor,
K, where 0 K < 1, is required for each attribute. These weighting factors are determined by
subjectively ranking the relative importance of each attribute relative to the other attributes. Below is a table of K values established through interviews with a customer of Ascent.
Attribute Weighting Factor
Design for safety 1.00
Capacity utilized 0.90 Uptime 0.90 Stayouts 0.80 Simple 0.80 Mobility 0.75 Onsite support 0.55 Continuous flow 0.50
Accuracy post vision sync 0.40
Modules 0.40
Accuracy prior to vision sync 0.30
Training required 0.30
Table 5: Attribute weighting factors
The weighting factors identified above are specific to a single customer and a single application, and should be reviewed each time the model is run. Although only one customer was used to develop the values above, Ascent should also take an average of the weighting factors across multiple customers if broader product portfolio decisions are to be made.
The combined utility score, U, for a single product is calculated using the equation below, where, Xi is the value of the attribute for the specific product.
N
U = (Kj * Uj (Xi) + 1) (3)
j=1
To calculate Xj, the design variables and their values for each product need to be established.
3.4 Design Variables
The design variables are the distinguishing features that characterize the product and quantify its performance. The design variables are broken down into two different categories: Design Variable Inputs and Design Variable Outputs.
3.4.1 Design Variable Inputs
The Design Variable Inputs are qualitative and breakdown the drilling and fastening product into its subsystems. There are four Design Variable Inputs: the motion platform, the process head, the positioning system, and the need for an opposing robot. Below is the list of options for each design variable input.
Motion Platforms
Gemcor G12 Gemcor G86 Gemcor G2000
Fanuc M900 on AGV
Fanuc M900 with 7-axis (STA)
Fanuc M900 on AGV with 7-axis (WL) Fanuc M900 with 8-axis (STA and WL) Fanuc M900 on AGV with secondary encoders
Fanuc M900 with 7-axis (STA) with secondary encoders
Fanuc M900 on AGV with 7-axis (WL) with secondary encoders Fanuc M900 with 8-axis (STA and WL) with secondary encoders Exechon parallel kinematic robot with 8-axis (STA and WL) Arc frame
Single sided frame Mini flex track
Table 6: Design Variable Inputs -Motion Platform Options
Process Heads
High speed linear electric Small MFEE (4 Modules) Large MFEE (6 Modules) C-Frame MFEE (4 Modules)
Table 7: Design Variable Inputs -Process Head Options
Positioning Systems
CNC rails with single control systems CNC rails with dual control systems CNC rails with metrology
AGV positioning
Metrology
Table 8: Design Variable Inputs - Positioning System Options
Opposing robots are required in any scenario where a simultaneous task must be carried out on the opposite side of the part from which the process head is operating. This thesis does not
include options on the various opposing robots; instead, it simplifies the options to include an opposing robot or not to include an opposing robot.
Changing any one of these design variables constitutes a brand new product. Based on the possible configurations of the Design Variable Inputs, there are 71 different product
variations that the combined Ascent divisions of Gemcor and Brown can offer their customers.
3.4.2 Design Variable Outputs
The Design Variable Outputs are quantitative measures of the products output, such as speed, volume, and force. Ultimately, these measures aid in the valuation of the products. The Design Variable Outputs consist of the following:
Design Variable Unit Description
Output
Time it takes to drill a hole (possibly insert a fastener) and Fasteners move to the next hole location. This assumes there is no
In-line speed nute movement of the entire motion platform during this time.
This also does not include any indexing of the process head to indexing features.
Time it takes to reposition the motion platform and index
Time to reposition Minutes the process head to indexing features. This assumes that
motion platform every time the motion platform makes a move, the process
head is re-indexed.
Process head reach in Feet The reach of the motion platform and process head
length parallel to the base of the motion platform.
Process head reach in Feet The reach of the motion platform and process head
unit width perpendicular to the base of the motion platform.
Process head reach in Feet
The reach of the motion platform and process head in the direction normal to the factory floor.
Motion platform The maximum force that can be applied by the system to
Mation pform Pounds either the fastener or the structure, without quality
concerns such as skidding or deflection.
The maximum number of modules that can fit within the
Number of modules 0-10 process head. This includes optional modules as well as
standard modules.
Table 9: Design Variable Outputs
The Design Variable Outputs reveal the capability of the system, however, production system requirements are required to determine how well the system integrates into the customer's production system.
3.5
Production System Requirements
The production system requirements help transform the model's output into the perspective of the individual customer. Although customers typically provide hundreds of requirements when requesting a quote for piece of equipment this complex, this model
intentionally limits the set of requirements to the 16 that are most influential. The 16
requirements below have been selected for their broad applicability across almost all aerospace production environments.
Production System Unit Description
Requirements
Select 1 of 5 options Drill and fasten
Clamp-up of parts is achieved through a fastener that was previously installed, and manually collared, in one or more adjacent holes. No opposing process head is required.
Drill and Fill (No Collars)
The process head drills a hole and inserts a fastener into the hole. The process does not require a collar be installed on the fastener.
Automated Swaged Collars
The process head drills a hole and inserts a fastener into the hole. The process requires a collar is swaged on the tail of the fastener. This process requires either an opposing robot, or a C-Frame process head.
Automated Threaded Collars
The process head drills a hole and inserts a fastener into the hole. The process requires a collar is threaded onto the tail of the fastener. This process requires either an
opposing robot, or a C-Frame process head.
Drill Only
The process head drills a hole, however, it is not responsible for inserting a fastener into the hole.
The number of additional modules required by the customer. Optional modules include the hole probe
Optional modules 0 - 5 module, the flushness module, the onboard tool swap
module, the fastener verification module, and the backside deburr module.
This requirement eliminates any product configuration Accuracy post vision Inches that is not capable of achieving an accuracy less than the
sync value listed after the vision system has synced on the
target.
tourInchesoThis requirement eliminates any product configuration
Accuracy priorInches that is not capable of achieving an accuracy less than the
vision sync value listed prior to vision sync.
Width Feet The width of the part to be drilled and fastened.
Height Feet The height of the part to be drilled and fastened.
Quantity
The number of fastener locations that the customerNumber of fasteners Qintends to automate.
Available time Hours The amount of time allocated in the production system to
complete the automation statement of work.
Duration of use Years Number of years the equipment is expected to be utilized.
Labor reallocation 0 Percentage of time labor is reallocated to different work
while the equipment is not running.
Labor rate $/hour The fully burdened labor rate of an equipment operator.
Number of operators Quantity The number of operators expected to run the equipment.
The number of fasteners expected to automate before the
Re-position motion motion platform needs to move to another location. This
platform is typically driven by accuracy requirements and should
be a rough approximation.
Clamping / upset The amount of force required to squeeze multiple layers
force Pounds of material together for one-up assembly, or the amount of
force required to upset a rivet.
Discount rate 0/o The discount rate used by the customer to discount their
future cash flows.
3.6 Total Cost
The vertical axis of the product tradespace compares products based on total utility, while the horizontal axis compares products based on cost. Leveraging the techniques developed in Sean Caetano's LGO thesis [9], this project approximates the cost of implementing automated drilling and fastening systems into a customer's production environment. The total cost of the product is broken down into total fixed costs and total variable costs. To protect Ascent's proprietary data, no numbers will be provided in this section.
The fixed costs are broken down into the list price for the equipment and the additional development cost needed to ensure the equipment is production ready. To calculate the list price for the entire system, a list price is computed for every Design Variable Input found in
Table 6, Table 7, and
Table 8. Any additional development costs were a function of the TRL of that product. For example, a product with a TRL of 7 required a higher development cost than a product with a TRL of 8.
Total variable costs are comprised of three types of labor required to operate the
equipment: equipment operators, manual fastener mechanics, and equipment maintenance. The model assumes that all labor is completed at the same fully burdened hourly rate. The model requires a minimum of one equipment operator to oversee the process, however, the customer can include more operators if they prefer.
The labor hours for the equipment operator are based on the number of hours that product will take to complete the desired number of fasteners. The labor hours for the manual fastener mechanic are a function of the number of stayout fasteners and the speed at which the mechanic
can fasten manually. Finally, the labor hours for equipment maintenance are a function of the reliability of the equipment. All variable costs are discounted over the number of years the equipment is expected to operate.
3.7 Simulation and User Interface
The Design Variable Outputs and Production System Requirements are all mapped to the applicable attributes, resulting in a total utility score, U. Similarly, the Design Variable Inputs, Design Variable Outputs, and Production System Requirements are mapped to the fixed and variable costs, resulting in a total cost. The total cost is divided by the number of fasteners, in order to visualize the results in the unit cost per fastener, a metric typically used and easily understood by customers.
The outputs from this simulation are graphically displayed on the user interface, seen in Figure 11 below. The visualization includes all of the customer requirements and a summary of the top four product recommendations. Also, the chart contains a line representing the cost of not
Editable Cells Requirements
Adjacent Hole Clamp Up = 0
Drill and Fill (No Collars) = 1
Automated Swaged Collars = 2 1
Automated Threaded Collars = 3
Drill Only = 4
Positional Accuracy Pre Sync 0.300
Positional Accuracy Post Sync 0.150
Length 36 Width 14 Height 7 Total fasteners 4000 Available hours 20 Part up to X degrees 200 Produce parts for X years 10
Labor is wasted X of the time the 0.5
equipment is not running
Fully burdened labor rate ($/hr) 100 # of pperators 2
Re-position every X fasteners 48
Clamping / Upset force 300
Manual fasteners installed per min 1
Availability 0.9 Discount rate 0.1 Modules Spindle d Insertion 1 Sealant 1 Optional Modules Hole Probe 0 lushness 0
Onboard Tool Swap 1
Fastener verification 0
Backside Debar 0
Total # of Modules 4
Ascent Aeropsace Production Selection Tool
121 101 81 61 41 21 ^ 65 * 4148 0 42 6 72%47 S41936 018 *43 0 %;0 Q35 0 01 10 31 869 *61 6 413 59 60 0 67 C 64 2 54 * 21 - 53 70 66 $0.50 $1.00 $1.50 $2.00 $2.50 $3 no
Cost per fastener
Top Accuracypot Uptime Stts Sfty Continuous Mblty TRL Training Lead Capacity Vision Sync flow Level required Time Utilized Solutions (Inches) (N) (N) (0-5) (0-1) (0-2) (0-9) (Weeks) (Months) (%)
65
3
41 42
Motion Platform End Effector
65 41 42 * Robot " Exechon " Arc Frarne
" Single Sided Fram 56 5 5 0 -le, Trac Mmr), Data concealed to protect intellectual property Opposing Robot
Figure 11: Product Selection Tool Output and User Interface
The interface displaying the graph is dynamic, allowing the customer to adjust their requirements and preferences in real time, run the simulation, and visualize the sensitivity or risk of the recommended solution based on their specific requirements.
3.8 Results
For the application depicted in the simulation results above, Figure 11, solutions 65, 3, 41
and 42 are considered to be the preferred options. They provide the highest utility to the customer at the lowest cost. However, it is important to note that the model does not conclude that any one solution is the favorite; instead, it provides the entire tradespace of possible solutions.
According to the model, Solution 41, a Fanuc robot on an AGV, has the highest utility, however solution 65, an Arc Frame motion platform, has the lowest cost. The tool provides a
starting point from which Ascent can work with their customer to determine which attributes are most important and which are worth sacrificing. This product selection framework is in complete contrast with the current method in which Ascent recommends products to their customers. Rather than an individual seller writing a detailed proposal with a single product option, Ascent can instead have a data-driven conversation with their customers to review multiple solutions and discover which is most applicable for their business.
3.9 Summary
The Product Selection Tool utilizes 29 application-specific variables and 24 product-specific variables to generate the tradespace. This solution space plots Ascent's 71 different product offerings onto a single graph of customer utility versus cost per fastener. This new approach empowers the people at Ascent to work closely with their customers to generate a data-driven solution, identify areas of concern early on in the product selection process, and introduce cost effective technology that provides an increased benefit to the customer. Ascent should eventually reduce the number of variables used in this model. Eliminating variables that have little effect on the model will simplify the amount of data Ascent needs from their customers.
4 Technology Provisioning
The product selection tool enables Ascent to explore gaps in the product tradespace of utility versus cost and explore possible technology improvement to fill these gaps. However, there is significant risk in recommending a product to a customer that is not tested in a production environment, or developing a product that was not directly requested by the customer.
4.1 Current Ascent Aerospace Technology
A typical lens used to view the different drilling and fastening products is based on
whether they are considered a monument or a flexible system. Monuments are thought of as reliable, fast, and immovable platforms, whereas flexible systems are associated with robotics and autonomous vehicles.
4.1.1 Monument Automation Solutions
Gemcor has three primary drilling and fastening systems, the G12, G86, and G2000, which are all considered monument-based platforms. The G 12 is smallest of the three
configurations and is designed for components such as engine nacelles and small fuselage panels. The platform has rails bolted to the floor that a C-Frame traverses on, and CNC positioners to adjust the orientation of the part. For some applications of the G12, a robot is used to hold the part instead of the CNC positioners.
C-Frame: OML MFEE mounted on top and IML End Effector mounted on
bottom
Linear rails to move C-Frame
CNC positioners to move part
Figure 12: Gemcor G12 Motion Platform
The outer mold line (OML) process head is mounted on the top half of the C-Frame, and the inner mold line (IML) opposing process head is mounted to the bottom half of the C-Frame. The C-Frame configuration maintains alignment between the OML and IML end effectors, and provides a rigid structure to react the force of compressing large rivets. The linear rails and CNC positioners enable accurate alignment of the process head to the part and allow the equipment to have a large coverage area. This ultimately reduces the number of stayout fasteners due to the equipment configuration.
The G12 motion platform, shown in Figure 12 above, is small enough that-in most cases-it does not require a foundation to be installed in the factory floor. A typical foundation requires a concrete footprint six to ten feet deep, reinforced with rebar. A foundation is
expensive to install and locks the equipment into a specific location and orientation in the factory.
The Gemcor G86 motion platform, shown in Figure 13 below, requires a foundation be installed under the linear rails and CNC positioners. The G86 motion platform is significantly larger than the G 12, and therefore can accommodate larger aerospace structures.
Figure 13: Gemcor G86 Motion Platform
The third and final motion platform variant offered by Gemcor is the G2000, shown in Figure 14 below. This motion platform has two Frames, one within the other. The inner C-Frame can rotate 1800, allows the motion platform to reach the far side of large fuselage panels, such as those found on the Boeing 747 and 777 airplanes.
Figure 14: Gemcor G2000 Motion Platform
These three Gemcor configurations enable the equipment to maintain high levels of accuracy, precision, and speed, over large distances.
The Brown business unit has a different approach to motion platforms. They take a series of off-the-shelf components and assemble them based on the requirements of the customer. This provides the Brown team with a much larger solution set to choose from. The lack of
standardization, however, has led to each solution being implemented only a few times, so lessons learned are not transferred to the newer generations as seamlessly as they are at Gemcor.
The motion platforms offered by the Brown division that most closely overlaps with the Gemcor series are the Arc Frame, shown in Figure 1 above, and the Single Sided Frame, shown in Figure 15 below. The primary difference for these platforms is that they do not have a C-Frame to enable access to the inner mold line (IML) of the part. Instead, a separate motion platform is required to access the IML. This additional motion platform is necessary if internal clamp-up pressure, a rivet bucking bar, or fastener collaring are required.
Figure 15: Brown Single Sided Motion Platform
4.1.2 Flexible Automation Solutions
For applications where more flexibility is required, the Brown unit offers a robotic arm as
the motion platform. The robotic arm holds the process head and can simply be bolted to the floor for small scale applications, or mounted to a series of linear rails to provide greater reach. Optional secondary encoders can be installed on the robotic joints to increase the robot's accuracy.
![Figure 3: Kuka AGV based motion platform[8]](https://thumb-eu.123doks.com/thumbv2/123doknet/13896185.447808/23.917.179.729.188.467/figure-kuka-agv-based-motion-platform.webp)
![Figure 4: Optimistic approach ignores risks of introducing automation[9]](https://thumb-eu.123doks.com/thumbv2/123doknet/13896185.447808/25.917.230.712.116.448/figure-optimistic-approach-ignores-risks-introducing-automation.webp)
![Figure 5: Boeing 777 FAUB automation[11]](https://thumb-eu.123doks.com/thumbv2/123doknet/13896185.447808/26.917.255.699.105.357/figure-boeing-faub-automation.webp)
![Figure 6: Mechanic removing Clecos from an F-35[14]](https://thumb-eu.123doks.com/thumbv2/123doknet/13896185.447808/27.917.319.628.483.828/figure-mechanic-removing-clecos-f.webp)
![Figure 7: Decision maker's roles and levels[ 15]](https://thumb-eu.123doks.com/thumbv2/123doknet/13896185.447808/30.917.224.691.116.498/figure-decision-maker-s-roles-levels.webp)
![Figure 8: Single attribute utility curve definition [16]](https://thumb-eu.123doks.com/thumbv2/123doknet/13896185.447808/34.917.251.670.584.781/figure-single-attribute-utility-curve-definition.webp)
