The Air Pollution Implications of the Residential Sector: Case Study of the Mexico City Metropolitan Area
by Kellyn E. Roth B.S. Civil Engineering
Virginia Tech, 1997
Submitted to the Engineering Systems Division and the Department of Urban Studies and Planning in Partial Fulfillment of the Requirements for the Degrees of
Master of Science in Technology and Policy and
Master of Science in Urban Studies and Planning at the
Massachusetts Institute of Technology February 2003
l bne 20330
© 2003 Massachusetts Institute of Technology All rights reserved.
MASSACHUSE S INSTITUTe OF,TECHNOLOGY
JUL BRARIES1 2003 LIBRARIES
Signature of Author
I
r - - %-Technology and Policy Program, Engineering Systems Division Department of Urban Studies and Planning January 17, 2003 Certified by Mario J. Molina Institute Professor Thesis Supervisor Certified by. Diane E. Davis Associate Professor Of Sociology Thesis Supervisor Certified by
Certified by Stephen R. Connors Director, Analysis Group for Regional Electricity Alternatives Thesis Supervisor Accepted bV
J -- -
--Danil E. Hastings Director, Technology and Policy Program Chairman, Committee for Graduate Students Accepted by
Dennis M. Frenchman Professor of the Practice of Urban Design Chair, MCP Program
The Air Pollution Implications of the Residential Sector: Case Study of the Mexico City Metropolitan Area
by
Kellyn E. Roth
Submitted to the Engineering Systems Division and the Department of Urban Studies and Planning
on January 17, 2003 in Partial Fulfillment of the Requirements for the
Degrees of Master of Science in Technology and Policy and
Master of Science in Urban Studies and Planning
ABSTRACT
The residential sector has been a long-acknowledged, but seldom-addressed, source of air pollution in the Mexico City Metropolitan Area (MCMA). The combination of high emission levels and large numbers of people directly exposed means that the indoor environment is a unique situation. If current trends of demographic growth, urbanization and increased appliance saturation continue, the urgency to address residential sector emissions will increase considerably. Additionally, households have wide-reaching impacts on many sectors including industry through the demand for appliances, power
generation and fuel suppliers through the demand for energy, services through the demand for infrastructure, and many more.
Through recent efforts, researchers at MIT and in Mexico have attempted to understand
and represent the residential sector, to identify and mitigate emissions release and
exposure, most of which is energy-related. To reduce energy consumption, and thus emissions, in the home several strategies have been considered: reduced and improved use of fuel; increased energy efficiency; fuel leakage prevention and improved practices;
improved building efficiency; and improved fuel transmission and delivery. Another issue of concern in this sector is the use of toxic solvents.
Household air pollution reduction strategy outcomes are difficult to predict because of the diversity of households (e.g., size, income, location) within the residential sector. Determination of the factors that affect energy consumption and household behavior would be very useful to decision makers as they develop more targeted policies for the provision of energy services and reduction of household-generated emissions.
Thesis Supervisor: Mario J. Molina Title: Institute Professor
Thesis Supervisor: Diane E. Davis Title: Associate Professor Of Sociology Thesis Supervisor: Stephen R. Connors
ACKNOWLEDGEMENTS
I would like to express my appreciation to several individuals and groups for assistance and support during my graduate studies and research and preparation of this thesis.
First, I would like to thank those professors and faculty members who provided encouragement and inspiration. Drs. Mario Molina and Luisa Molina deserve thanks for their hard work developing and coordinating the Mexico City Program, across national boarders, through government organizations and academic lines, while their research staff is in constant flux. Thanks also go to Stephen Connors and Joseph Sussman, for rallying
the scenario team and keeping us organized enough to produce high quality and timely results. I also appreciate Diane Davis, for taking me on as an advisee at the last minute
and providing guidance and support.
I would also like to thank the many members of the Mexican community-program
members-government officials and others-who developed this research program and enabled so many MIT students to be involved in such an interesting and applicable endeavor. The list is long, but I'd specifically like to mention Sergio Sanchez, Laura Chapa, Maria Ibarraran, Oscar Vasquez, Rodrigo Favela and Jose Luis Lezama for arranging interviews, answering my many inquiries and providing invaluable data,
expertise and translation for my research and model. I wish everyone involved with this
program continued success and luck in their efforts toward improving the air quality of
Mexico City.
I would like to acknowledge financial support from the Integrated Program on Urban, Regional and Global Air Pollution with funds provided by the Fideicomiso Ambiental del Valle de Mexico, the MIT Alliance for Global Sustainability and the U.S. National
Science Foundation.
Finally, I am grateful to my family and friends for their support and encouragement during my time at MIT. I particularly need to mention Chris Guyton, who was there for me every step of the way.
TABLE OF CONTENTS
Chapter 1. Introduction ... 9
MEX ICO CITY AIR POLLUTION ... 9
T MEXICO CITY PROGRAM ... 10
THE RESIDENTIAL SECTOR ... 11
Chapter 2. Research DESCRIPTION ... 13
RESEARCH OBJECTIVES ... . ... ... 13
METHODOLOGY ... 14
The Mexico City Program ... 14
Integrated Scenario Assessment ... 15
Residential Sector Focus . ... ... 16
JUSTIFICATION ... 17
Chapter 3. M exico City Profile ... 20
MEXICO AND MEXICO CITY CHARACTERISTICS ... 20
AIR POLLUTION... ... 23
Emissions and Sources ... ... 23
Monitoring... 26
Distribution ... 28
Health Effects ... 29
Chapter 4. Residential Sector Profile ... 31
RESIDENTIAL PROJECT SCOPE ... ... 31
Mexico City Residential Data Sources ... 32
RESIDENTIAL SECTOR PROFILE AND TRENDS ... 33
Socioeconomic... 33
Housing Stock ... 37
LEGISLATION, REGULATION AND POLICIES ... ... 39
History... 39
Stakeholders ... ... . ... 40
Air Quality Programs ... 43
Other Programs and Policies ... 44
Chapter 5. Residential Emission Sources ... 48
EMISSIONS INVENTORY ... ... ... 48
Indoor Air Pollution ... 5...0...50
RESIDENTIAL ENERGY USE ... 54
Residential Energy Studies ... 54
M exico City Household Energy Use ... 55
NON-COMBUSTION RESIDENTIAL EMISSION SOURCES ... 64
Fugitive emissions... 64
Chapter 6. Residential Survey ... 65
RESIDENTIAL SECTOR SURVEY OBJECTIVES ... 65
SURVEY METHODOLOGY ... 66
Sample Selection ... 67
Question Formulation and Organization ... ... 68
Pretesting and Review ... 69
QUESTIONNAIRE DESCRIPTION ... ... 71
PRELIMINARY SURVEY DATA ANALYSIS ... 72
SURVEY FUTURE STEPS ... 73
Chapter 7. Residential Model ... 74
INTEGRATED SCENARIO ANALYSIS ... 74
RESIDENTIAL SECTOR MODEL OVERVIEW ... 74
Modeling Equations ... 75
Data Sources ... 76
Model Inputs. ...76
Reference Cases ... 84
Additional Emission Reduction Options ... 85
Future Stories . ... 90
Scenario Construction ... 93
C osts... 93
Model Output ... 94
Chapter 8. Model Findings . ... 96
BASE CASE MODEL RESULTS ... ... 969... Base Case Projections ... 96
ADDITIONAL OPTION MODEL RESULTS ... 101
Option Projections ... 101
Reference Case and Option Tradeoffs ... ... 111
Chapter 9. Recommendations and Conclusions ... . 116
POLICY RECOMMENDATIONS ... 116
BARRIERS/ISSUES TO ACTION ... 117
LIMITATIONS TO RESEARCH FINDINGS ... 118
FINAL THOUGHTS ... 119
Works Cited ... 121
Appendix ... 121
HOUSEHOLD SURVEY ... ... ... 12132
HOUSEHOLD PRACTICES TO DECREASE ENERGY CONSUMPTION AND POLLUTANT EXPOSuRE ... . 12165
LIST OF TABLES
Table 1. Comparison of IMECA and U.S. EPA Ambient Air Quality Standards ... 27
Table 2. Comparison of Mexican and U.S. Health-based Ambient Air Quality Standards
...
...
.. ... ...
... ...
2..
28
Table 3. Common MCMA Air Pollutant Health Effects and Sources ... 29
Table 4. MCMA Housing Conditions ... 38
Table 5. Residential NMHC Emissions from LPG Leakage, 2000 As Modeled ... 64
Table 6. Survey Distribution of Municipalities and Delegations ... 68
Table 7. Survey Distribution of Age and Income level ... 68
Table 8. 1996 Major Appliance Energy Intensities ... 78
Table 9. Major Appliance Turnover Rates ... 80... 80
Table 10. Residential Model Fuel Combustion Emission Factors, tonne/PJ ... 82
Table 11. Residential Model LPG Distribution and Storage Leakage-Related Annual Emission Factors ... 82
Table 12. Residential Model LPG Domestic Leakage-Related Annual Emission Factors ... 8 3 Table 13. Residential Solvent Annual Emission Factors ... 83
Table 14. Residential Model Option Sets ... 86
Table 15. Residential LPG Leakage Reduction Options, As Modeled ... 89
Table 16. Primary Future Story Residential Drivers ... 92
Table 17. Primary Residential Sector Modeled Attributes ... 95
Table 18. Residential Fuel Switching Option Performance (Total NOx Emissions) Under 3 Future Stories, As Modeled ... 105
Table 19. Residential Efficiency Option Performance (Total Electricity Consumption) Under 3 Future Stories, As Modeled ... 109
Table 20. Residential LPG Reduction Option Performance (Total NMHC Emissions) Under 3 Future Stories, As Modeled ... 111
Table 21. NPV Residential Costs for Reference and 4 Additional Options ... 112
LIST OF FIGURES Figure 1. Mexico City Program Integrated Assessment Diagram ... 15
Figure 2. MCMA Urban Expansion 1900-1990 (Lemus, 1998) ... 21
Figure 3. Map of Mexico Megalopolis: Mexico City and Nearby Metropolitan Areas... 22
Figure 4. 1998 MCMA Emission Inventory (CAM, 2002) . ... 23
Figure 5. 1998 MCMA Non-electric Fuel Consumption, by Fuel (Bazan, 2000) ... 25
Figure 6. 1998 MCMA Non-electric Fuel Consumption, by Sector (Bazan, 2000) ... 26
Figure 7. MCMA Socioeconomic Stratification Proposed by AMAI ... 32
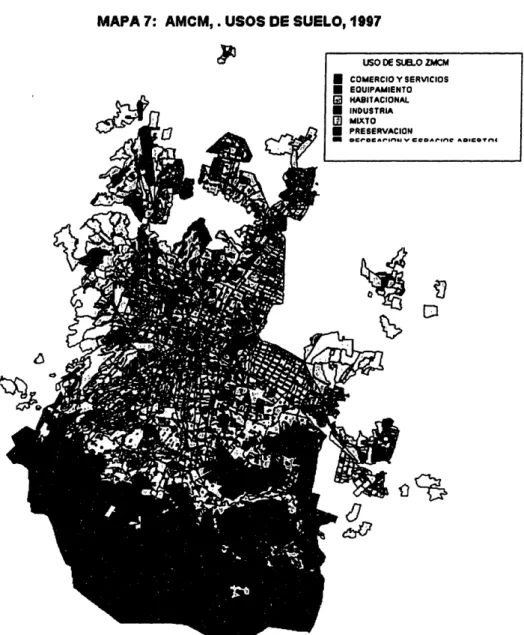
Figure 8. MCMA Land Use Patterns, 1997 (Garza, 2000; Gilat, 2002) ... 35
Figure 9. 1998 MCMA Emission Inventory (CAM, 2002) . ... 48
Figure 10. 1998 MCMA Non-Transportation Emission Sources (CAM, 2002) ... 49
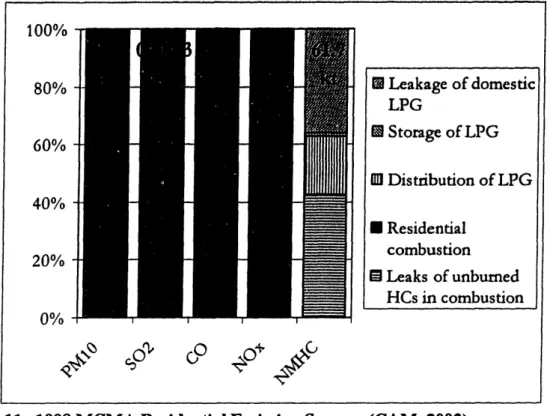
Figure 11. 1998 MCMA Residential Emission Sources (CAM, 2002) ... 50
Figure 12. 1996 MCMA Household Saturation of Major Fuel Combustion Sources by End Use (INEGI, 1998) ... 56
Figure 14. 1998 Residential Fuel Consumption, by end use, As Modeled ... 61 Figure 15. 1996 MCMA Residential Electric Appliance Saturation (INEGI, 1998) ... 63
Figure 16. MCMA Residential Appliance Saturation (INEGI ENIGH data for
1984-1996) ... ... 63
Figure 17. Household Penetration under LPG Leakage Reduction Options ... 89 Figure 18. Future Story Effect on Speed of Household Fuel Switching ... 93
Figure 19. Total Base Case MCMA Residential Fuel Combustion by 3 Future Stories, As
M odeled 2000-2025 ... 97 Figure 20. Base Case MCMA Residential Fuel Combustion - Changing Climate Future
Story, 2000-2025 As Modeled ... 98 Figure 21. Base Case Residential Fuel Saturation Trends by 3 Future Stories, As
M odeled, 2000-2025 ... ... ... ... 98
Figure 22. Total MCMA Base Case PM10 Emissions by 3 Future Stories, As Modeled,
2000-2025 ... 99
Figure 23. Total MCMA Base Case NOx Emissions by 3 Future Stories, As Modeled, 2000-2025 ... 100
Figure 24. Total MCMA Base Case NMHC Emissions by 3 Future Stories, As Modeled, 2000-2025 ... 100 Figure 25. MCMA Residential Cooking Fuel Saturation under Fuel-switch Option Set, As Modeled 2000 & 2025, Changing Climate ... 102
Figure 26. MCMA Residential Fuel Consumption under Fuel-switch Option Set, As
Modeled 2000-2025, Changing Climate ... ... 102 Figure 27. MCMA Residential NOx Emissions for Fuel Switch to NG, As Modeled, 2000-2025, Changing Climate ... 103
Figure 28. MCMA Residential NOx Emissions for Fuel Switch to Electricity, As Modeled, 2000-2025, Changing Climate ... 104
Figure 29. MCMA Residential Total Electricity Consumption under Lighting Efficiency Option Set, As Modeled, 2000-2025, Changing Climate ... 106 Figure 30. MCMA Residential Total Lighting Electricity Consumption under Lighting Efficiency Option Set, As Modeled, 2000-2025, Changing Climate ... 106 Figure 31. MCMA Residential Total Electricity Consumption under Appliance Efficiency Option Set, As Modeled, 2000-2025, Changing Climate ... 107 Figure 32. MCMA Residential Appliance Electricity Consumption under Appliance Efficiency Option Set, As Modeled, 2000-2025, Changing Climate ... 108 Figure 33. MCMA Residential NMHC Emissions under Fugitive Emissions Option Set, As Modeled, 2000-2025, Changing Climate ... 110 Cost Percent Change (from Base Case) ... 112 Figure 34. Cumulative Residential NOx Emissions and Total NPV Residential Sector Costs for Fuel Switching Options, As Modeled ... 113 Figure 35. Cumulative Residential Electricity Consumption and Total NPV Residential
Sector Costs for Efficiency Options, As Modeled ... 114
Figure 36. Cumulative Residential NMHC Emissions and Total NPV Residential Sector Costs for LPG Leakage Reduction Options, As Modeled ... 114
CHAPTER 1. INTRODUCTION
The Mexico City Metropolitan Area (here after referred to as MCMA, Mexico City or
Metropolitan Area) is the second largest metropolitan area in the world with over 18
million inhabitants (the largest is Tokyo, Japan with 26 million people), roughly one-fifth of Mexico's entire population. The MCMA produces more than a third of the national GDP and generates, in the process, five million tonnes of atmospheric pollutants and four
million tonnes of waste per year. Growth in the MCMA has led to an increase in regional
air pollution and concern about the implications for human health. This first chapter will further introduce the problem of air pollution in the MCMA, describe a program at the Massachusetts Institute of Technology (MIT) initiated to assist the local government in
dealing with this problem, and explain how the residential sector of the MCMA contributes to this problem.
Mexico City Air Pollution
Currently, Mexico City is the second most polluted city in the world in terms of air
pollution (World Bank, 2001), a drop from the number one position it held about a
decade ago, and the UN has indicated that the air pollution in Mexico City is one of the
worst among all megacities (UNEP/WHO, 1993). Virtually all air pollutants - traditional
air pollutants as well as toxic and carcinogenic chemicals - can be found in the city's air,
affecting the health, visibility and environment of its residents. The air pollution problem could not be denied after reports of bird and plant death and high human mortality during
the eighties.
The Metropolitan Area's topography and geography is conducive to developing and
maintaining local air pollution. The areas high elevation results in less efficient fuel
combustion and higher pollutant emissions. The air pollution situation is further
exacerbated because the entire area is surrounded by various mountain ranges that function as a natural barrier, trapping gases and particulate matter. Winds rarely blow with enough force to clear the city's air from the valley.
In the beginning of the 1990's, air quality standards regarding all criteria pollutants were exceeded almost every day. After two decades of effort by local and federal
governments, improvements in air quality have occurred but have failed to significantly
decrease the overall level of all criteria air pollutants. Ozone values still violate air
quality standards eighty-five percent of the days. Maximum peaks of particulate matter
(PM) now reach 1.5 times the standard and violations occur on about 30 percent of days of the year (Molina, 2000).
However, the rate of increase of air pollution has been reduced from its previous state. A strong management focus has been taken since 1990, with leadership by the Federal
District Government (DDF), integrating national government institutions, the State of
Mexico Government, as well as the state-owned oil industry and numerous private actors.
Citizens have also been motivated by government programs to improve their environment
Improvements have been achieved in some of the most critical parameters for air quality.
Examples include dramatic reductions in lead concentration and in emissions of carbon monoxide (CO). Sulfur dioxide (SO2) pollution has also been reduced in sufficient amounts to reduce, or eliminate, unhealthy levels in the MCMA. Current ozone and
particulate matter (PM10) concentration peaks are at levels less than half of those
registered during 1991 (Molina, 2000). High levels do, however, still occur; on
September 18, 2002 the MCMA experienced its first air pollution contingency in three
years, due to high ozone levels.
Continued population and industrial growth and limited enforcement of existing environmental protection regulations have contributed to the mixed success of
governmental policies for pollution mitigation. With an increase in national GDP, and
the country shift towards "modem consumerism," people are moving further away from the city center and towards required personalized transport and increased vehicle and household fuel consumption.
These trends, and many others highlighted below, contribute to severe effects, both financial and health related. A recent study by the World Resources Institute suggests "The [air] pollution in Mexico City is among the world's worst for young children" (WRI, 2002). While infant mortality in Mexico was at an average of 35.5 infant dealths per 1,000 live births in 1999, infant mortality in the MCMA was estimated at 46.6 in the same year. According to the World Health Organization, the average level of particulate matter in the city exceeds international standards by a factor of two. In 1999, ozone
levels exceeded international standards for 212 days during the year. Air pollution-induced mortality was estimated to be 4,520 people annually in 1999. Thousands of Mexico City residents, especially children suffer from migraine, asthma and other respiratory problems (WHO, 1999). According to the World Bank, air pollution in
Mexico City has reduced the national GDP by nearly six percent (WB, 1997).
The Mexico City Program
The most recent air pollution mitigation effort, the Program to Improve Air Quality in the
Valley of Mexico 1995-2000 (PROAIRE), has recently come to an end. Members of the Metropolitan Environmental Commission (CAM) have developed a new air quality
program, PROAIRE 2002-2010, for the MCMA to be implemented in the upcoming years. The plan has short-, medium-, and long-term goals for air quality in the region.
CAM and other Mexican government organizations have requested assistance from a research program at Massachusetts Institute of Technology (MIT) - the Alliance for
Global Sustainability (AGS) - to help develop this program and decision-making tools to implement these goals.
The magnitude and complexity of the atmospheric pollution, and resulting health
problems in the MCMA, requires a multidisciplinary approach with solid scientific and technical foundation and an integrated strategy for decision-making. CAM, in collaboration with the MIT team, prepared a proposal entitled "Program for the Design of
an Integrated Strategy for Air Quality Management in the Mexico City Valley
2001-2010," which was submitted to the Valley of Mexico Environmental Trust-fund and
approved. The resulting Integrated Program on Urban, Regional and Global Air Pollution: Mexico City Case Study (Mexico City Program) at MIT is analyzing inter-sectoral strategies for the reduction and management of air pollution in the MCMA. The Program seeks to build the capacity of Mexico City and other developing nation
megacities to address such problems by considering the effects of pollution on human health, the economy, ecosystems as well as international problems such as global
warming. The approach will inform the Federal District, State of Mexico, National Government and other interested parties and stakeholders about which emissions to target first and what policy options may be the most effective for reducing those emissions at a reasonable cost.
The Residential Sector
The main focus of this thesis is air pollution from one sector analyzed within this
Program - the residential sector. I focus on technological, demographic, economic and
environmental influences to emissions from this sector, which contributes the air pollution problems described above. I believe that my approach, and the Integrated Scenario Tradeoff Analysis, expands the knowledge base of residential urbanization
processes and can be used as a foundation for comparative studies and decision-making
and policy development in other megacities, especially in Latin America.
The residential sector, as defined by this Program, includes all households within the
MCMA. To understand the intricacies of this sector a profile including existing
technology and energy options, penetration of appliance types, turnover rates and
socioeconomic factors such as urbanization, household size, income distribution and housing tenure (degree of home ownership) must be identified. There are approximately
4.5 million households in the MCMA and this number is increasing. In 1996, the residential sector of the MCMA consumed approximately one-fourth of the total energy in the MCMA. Residential fuel consumption, along with the storage, transportation and distribution of these fuels as well as solvent use, comprises the most significant source of
indoor air pollution and exposure. As current trends continue, these patterns must be addressed.
The residential sector provides the opportunity to evaluate the implications of household
energy and resource consumption and other decisions that affect their indoor environment and personal exposure, as well as metropolitan, regional and global air quality. The importance of the MCMA in Mexico's urban population makes this study an important
tool for developing policies to promote informed energy consumption decisions and
energy efficiency in residential households as well as for energy sector planning.
The following Chapter of this document outlines the primary research objectives and
methodology used for the Program and evaluation of the residential sector. It also provides justification for the Program and intended application of results.
Next, a more detailed description of Mexico City, as it relates to air pollution, is provided in Chapter 3. Physical characteristics are described as well as pollution sources, trends and effects.
Chapter 4 then provides more detail on Mexico City's residential sector. This section
examines current conditions and spatial and temporal trends of household characteristics such as population, living conditions, household income and welfare and building structures. The key policies and regulations that effect residential air pollution, either by influencing household choices and behavior or by directly encouraging household
pollution generation reduction, are also described
Based on this information about Mexico City's residential sector, Chapter 5 describes its pollution sources and historical trends and preferences relating to this air pollution.
The next section, Chapter 6, describes a residential survey performed to gather
information on household behavior and expected responses to pollution reduction
policies.
Chapter 7 contains information on the analytical analysis behind this research Program. It describes the model used to estimate future trends of residential air pollution generation, under various control strategies and mitigation efforts.
Based on this qualitative and quantitative analysis, Chapters 8 and 9 summarize the findings of this research. Observations based on the model are provided as well as
expected implications of policies. Additionally, this section suggests some of the barriers
and key issues that will have to be overcome and/or considered before moving forward with residential sector air pollution reduction efforts.
CHAPTER 2. RESEARCH DESCRIPTION Research Obiectives
Air pollution produced by the MCMA residential sector will undeniably continue to
increase and worsen unless action is taken. The population is expected to continue to grow; even if each person consumes far less than per capita consumption today, more
total fuel combustion will occur. Urban sprawl is expected to continue, stretching the fuel delivery infrastructure and limiting consumers' fuel choice and availability. Income disparities can remain consistent or change dramatically, perhaps leading to an increase in overall income or a larger disparity between the wealthy and the low-income informal settlements. No matter what the future entails, it is important for decision makers to
understand the residential sector and how it contributes to and interacts with air pollution
drivers.
To justify this research, we must first ask, "How important is the residential sector?" Its
emissions importance is relatively small in terms of the Emissions Inventory developed by CAM, which has been the basis of most Mexico City air quality management programs so far. However, once exposure assessments can accurately weigh indoor versus outdoor exposure, it may receive more attention. Also, when evaluating only the
Emission Inventory and program costs, the residential sector may not present, at first glance, the most cost-effective strategies for the MCMA. Mexico City, relatively new in implementing pollution mitigation efforts, still has several "low hanging fruit." There are still so many large sources of emissions that can be dramatically reduced at relatively small costs. But, as exposure assessments are used, this effectiveness may shift benefits to indoor and direct exposure sources.
There are two types of air pollution exposure: ambient exposure from outdoor sources (e.g., power plants, automobiles and industrial emissions) and exposures from indoor sources (e.g., tobacco smoke, cooking, and use of household products). For many pollutants, such as benzene and particles, indoor sources may make more substantial contributions to personal exposure than outdoor sources (Molina, 2000)1. Additionally, because people spend much of their time indoors and because many pollutants can readily enter the indoor environment, much of the exposure from outdoor sources may actually occur indoors. Therefore, great improvements in public health are possible through programs and policies designed to encourage development of improved and less polluting household products, increase the energy efficiency of household appliances,
switch to less polluting fuels and increase residential awareness of the issues.
The primary source of air pollution in the MCMA and from the residential sector is energy consumption. The Mexico City Program will try to determine what level of emissions reductions are desired and required in the Mexico City Valley, what changes in
energy consumption and related practices will result in those reduction, and what policies
will results in those changes. Evaluation at the residential/household level requires a
large degree of specificity; households are very heterogeneous in terms of income, size, occupation, and other characteristics. This research will attempt to identify energy consumption factors - household characteristics that correlate to energy consumption behaviors and responses to external policies and influences. For example, given a ten percent increase in liquid petroleum gas (LPG) price, will households chose to switch to a different, less polluting fuel (ex - natural gas)? If so, which households? This analysis
will lead to suggestions for policies and practices that promote and effect the desired
changes in energy consumption and air pollution emissions.
Evaluating the costs of these emission reduction options will then enable the researcher, policy makers and other stakeholders to determine if there are benefits to addressing and
attempting to reduce emissions. We can ask, since the contribution to the MCMA
emission inventory is low, would it be more beneficial to reduce exposure and other health problems or reduce emissions levels? For example, "Would more lives be saved by providing running water to the about ten percent of households in the peripheral areas without it?" (Pick and Butler, 1997) These questions, beyond air pollution, are outside the scope of this thesis, but should be kept in mind when thinking about putting programs into practice.
Analyzing the residential sector also presents us with many other research questions that are beyond the scope of this thesis but for completeness, must be presented and considered. Based on Mexico City fuel and appliance emission factors, one of the largest residential sector emissions reductions seem to be possible through switching to less polluting fuels such as natural gas and electricity. However, switching to natural gas decreases some emissions but increases the risk of explosions, especially in an earthquake susceptible location such as Mexico City. The likely health risk of air
pollution must be weighed against the less likely health risk of an explosion. There has
not been much switching to electricity for major appliances such as cook stoves and water heaters because other fuels have historically and consistently been less expensive. Switching to electricity does not decrease overall pollution but moves it out of the valley,
making it an attractive local option. If the research Program moves from a local pollution
reduction goal to a regional one, this may no longer be desirable.
The remainder of this chapter describes the methodology used for the Mexico City Program, the Integrated Scenario Analysis of this Program and, specifically, the residential sector component. Justification is then provided for this Program and the residential sector focus.
Methodologv
The Mexico City Program
The Mexico City Program (MCP) was initiated at MIT and involves the participation of an interdisciplinary group of researchers from Mexican academia, government and other institutions, as well as consultants from MIT and Harvard of the United States. The overall goal of the Mexico City Program is to improve the understanding of complex and important environmental problems, contributing to the improvement of the approach and
methodologies used by developing nations, initially focusing on the Mexico City Metropolitan Area. The Program seeks to build the capacity of these nations to address such problems, by providing objective and balanced assessments of the causes and possible solutions to local, regional and global atmospheric pollution problems that are
useful to decision makers. One of the primary challenges in the development of a
coordinated, robust and cost-effective air quality management plan is to be able to address all of the relevant scientific, technical, political, economic and administrative aspects of the problem.
Integrated Scenario Assessment
The Mexico City Program has chosen to employ an integrated assessment (IA) approach
to develop recommendations that facilitate the interaction between areas such as health,
atmospheric science, economics, technology and policy. It considers effects of pollution
on human health, the economy, ecosystems, as well as international problems such as global warming. The components of the IA are shown in Figure 1.
Figure 1. Mexico City Program Integrated Assessment Diagram. Image designed and provided by Stephen Connors.
The MIT team is tasked with developing an Integrated Scenario Analysis for Mexico City, one that would Program air emissions, concentrations and resulting health impacts
and monetary expenditures under various alternative conditions and policies. As in most developing countries, there is a limited supply of information; participants must also analyze associated uncertainties.
For each sector (transportation, industrial, commercial, residential, etc.), researchers will
produce emissions and costs trajectories for the MCMA under various future scenarios and emissions control options. These costs and emissions can then be compared across all sectors and stakeholder impacts to identify optimal strategies for the government to
implement.
The scenario analysis methodology has been institutionalized by Royal Dutch/Shell as a way to confront complex issues and future uncertainties. Scenarios, as defined by Shell,
are coherent, credible stories about alternative futures and they help to create multiple perspectives to explore problems and possible development, options and actions. Shell
has been using scenarios for the last thirty years to guide difficult decision-making.
Residential Sector Focus
As one student team member, I evaluated the residential sector - its sources of pollutant emissions, viable emissions reduction strategies, and feasibility of reduction alternatives
and coordination of these alternatives with other sector approaches. This evaluation was
accomplished by collecting information through a literature review, interviews and collaboration with Mexican policy makers and stakeholders, a household survey, and the
development of a bottom-up model.
Literature Review
The first step was to perform a broad literature search and review. A comprehensive literature review was undertaken to find information on four broad topics: (1) the residential sector and its contribution to local, regional and global air pollution; (2)
patterns of household energy use (especially in developing countries), recent research on
energy behavior (by households) and energy consumption; (3) the effect of household energy consumption on indoor air pollution and occupant health; and (4) relevant national and local environmental policies. The literature search was performed using several social science, energy, urban planning and environmental databases and included contributed reports and articles from Program participants and collaborators.
Interviews/collaboration with government
Researchers on this Program are fortunate because of the direct collaboratlin and assistance available from Mexican government officials and employees. These collaborators provided much of the data and information used in this Prognram. Sources of data included government census and surveys, fuel information from Pcnmcx aInd other fuel distributors, and research data from Mexican universities and governmcnial
institutions. Additional intuition was supplied and developed through conlinued cotnlil
and conversations with these individuals and other Mexico City residents intrnduced to us.
Survey
Several domestic residential energy surveys have been pcrformed in other urban developing areas, but none in Mexico City and few in Mexico. By assessing lhe relevant literature, the methodology of prior surveys and the goals of the Mexico City Program, it was decided that a survey should be performed in the MCMA to determine curerntl
household conditions such as fuel and appliances choices and expenditures and household energy consumption indicators such as occupant characteristics, attitudes and actions, and other characteristics. In addition to this information, the survey was used to identify key drivers in energy consumption and other household decisions and educate household members on their implications. This information is essential before making household energy policy (Sheinbaum, Martinez & Rodriguez, 1996; Barnes & Floor,
1996) and was not available from other sources.
Identification of these drivers provides decision makers with improved information upon
which to prioritize and implement effective air pollution reduction programs. It may also
identify tensions between stakeholder goals (e.g., increased economic development through higher household incomes is likely to lead to more consumption and pollution). Through MIT and Mexican cooperation, emissions reduction option implementation and the outreach portion of the survey, the air pollution produced in the residential sector could be reduced, providing an example for other areas.
Model
The information gathered through the literature review and data collection and enhanced
by the survey has been used to model the residential sector individually and as part of the
Program's Integrated Scenario Analysis to estimate future household behavior, including energy consumption and resulting air emission and cost impacts under several policy options and predictions of future economies, growth patterns and political structures. Other Program team members then converted this emissions information into atmospheric pollutant concentrations and health effects.
A bottom-up approach was used to model the residential sector: sources of pollutant emissions; viable emissions reduction strategies; technological, economic, and political feasibility of reduction alternatives; and coordination of these alternatives with other sector approaches. Options being considered include switching to alternative fuels, improving appliance efficiency and fuel leakage reduction. Air pollution reduction strategies must be robust across varied future possibilities characterized by local, regional
and global factors.
Justification
One of the major problems the Mexico City government has experienced when designing
environmental regulation has been a lack of historical information. The Mexico City Program team will collect, consolidate and evaluate many sources of information into one
coherent source.
Many of the data sources used during development of the residential model did not provide consistent and long-term historical data. Additionally, data was often incomplete and excluded irregular housing settlements or defined the MCMA in a way different from
As mentioned earlier, energy surveys performed in other areas were consulted for information relevant for Mexico City. Few of these energy surveys, however, have been
in urban areas in developing regions. One study in Mexico (Masera & Navia, 1996) surveyed households in rural villages to examine fuel wood use and fuel switching
patterns. While the relationship between household characteristics and energy consumption behavior may have been researched in other settings, MCMA
decision-makers need to understand the situation in Mexico City. The situation there is unique in
terms of income distribution, population growth, energy pricing policies and supply and other factors.
The majority of the household energy surveys were designed to measure household energy consumption response to external information and not to gauge current practices and potential responses to various future situations. Many of the households surveyed over extended periods of time volunteered for the program, creating self-selection bias. Additionally, most identified household characteristics did not indicate occupant attitudes
and how these households would respond to government policies.
There exists an opportunity to narrow the literature gaps and contribute to the body of
knowledge on household energy consumption. It is important to understand what influences households to make their fuel choice and consumption decisions. Perhaps socioeconomic household characteristics are appropriate indicators of energy consumption behavior, but these indicators may change or shift over time. Additionally, we can try to determine what types of policies will be most effective in the MCMA in improving residential air quality. The survey portion of this research will attempt to measure household characteristics and occupant behavior that influence energy
consumption, and will then predict how this knowledge can be used to reduce energy
consumption. Like the referenced surveys, precise quantification is difficult because the
number of households, or energy consumers, is so large. This survey will serve as a
small-scale test of the questionnaire's usefulness.
I hypothesize that household income, housing tenure (level of ownership) and availability
of services are the dominant MCMA characteristics that affect ability and desire to make
energy consumption changes. Consumers, particularly those in Mexico City where fuel and appliance choices and disposable income are limited, have a general lack of knowledge about the fundamental differences between and impacts of their energy choices-delivery methods, advantages and disadvantages and methods for better energy consumption management.
For the residential sector specifically, much of the information gathered through this
survey will be different than what is already collected by the government, including
energy expenditures, appliance turnover and household environmental awareness. The
Program team and the Mexican government can use the survey instrument to gather
periodic information on energy consumption in order to verify modeling and policy assumptions and to determine long-term trends. Quantitative household data could also
be gathered to determine annual, monthly and seasonal variation2. Planning departments
of housing agencies, fuel suppliers, appliance manufacturers and other parties could then
use the data to better assess the market and anticipate and provide household needs. The Integrated Scenario Analysis can be used as a tool for decision-makers to develop
policies that can promote reduced air emissions and overall sustainability in the MCMA
through efficient policies. Because this information has been specifically requested by our Mexican government partners to be used for future policy development, it is important to provide information specific to the MCMA and not extrapolate or estimate based on prior, far-removed surveys and research.
CHAPTER 3. MEXICO CITY PROFILE
The purpose of this chapter is to introduce the Mexico City Metropolitan Area (MCMA). First, the physical attributes are described including presentation of recent trends in population, size and importance to surrounding areas and Mexico. Then, more information is provided on the current environmental conditions, more specifically air pollution, of the area. Sources of air pollution, type of pollutants, and efforts to monitor and regulate this growing problem are outlined.
Mexico and Mexico City Characteristics
The MCMA is one of the largest urban areas in the world. The United Nations defines a
megacity as an urban population that was over 8 million in 2000; the World Bank increases this threshold to 10 million inhabitants. The MCMA meets either definition. The combination of high population density, poverty, and limited resources in the MCMA and other megacities intensifies conditions of disease, infrastructure deficits, environmental problems, external economic dependence and capital scarcity (Bugliarello,
1999).
The MCMA is situated in the Mexican Basin in central Mexico at a mean altitude of 2,400 meters. The surrounding mountains have an elevation of over 5,000 meters. Two
valley channels, located in the north-east and north-west, funnel the air to the center and
the south-west portions of the city, but the mountains generally prevent wind circulation
and pollution transport away from the central MCMA. Additionally, fuel burns less
completely at high altitude, and frequent thermal inversions and high pressure systems mean that the surrounding mountains trap a layer of cold air above the city, preventing
the dispersal of fumes.
The MCMA is composed of 16 delegations of the Federal District (DF), 40 municipalities of the State of Mexico (EM) and one municipality of Hidalgo, Tizayuca. Together, these regions have a surface area of 5,300 square kilometers (km2), of which about 1,500 km2 (-30 percent) is urban (Molina, 2002).
During the twentieth century, the area has changed dramatically. The population grew
rapidly, continually occupying land further away from the historic center (Molina, 2000;
Sheinbaum, Martinez & Rodriguez, 1996). In 2000, the population of the MCMA was over 18 million - over four million households (INEGI, 2000). Although the population growth rate is expected to decrease from the current 1.6 percent to about one percent per
year in 2010, the population will continue to grow, passing 20 million inhabitants by 2010 and 22 million by the year 2020. The age distribution has also changed during this century; an increase in the elderly population, which doubled since 1995 (INEGI, 2000), indicates a growth in the group of the population sensitive to air pollution.
While approximately nine million people live in each the DF and the EM, the MCMA growth rate is not homogeneous - areas outside of the city center in the DF have a faster population growth (see Figure 2). A significant fraction of this expansion has occurred in
markets, they frequently settle illegally in vulnerable ecological zones, with low densities and infrequent service availability (Molina, 2000). It has been estimated that irregular settlements provide homes for sixty-two percent of the MCMA population and occupy almost fifty percent of the MCMA area (Molina, 2000). The total MCMA has a population density of about 3,000 persons per km2, but the urban area population density
ranges from greater than 18,000 persons per km2in portions of the city center to less than 1,000 persons per km2 in outer, less populated zones (Gilat, 2002). The MCMA
population density has decreased slightly over the years - the population is increasing at a slightly slower rate than the urban area. The MCMA is 98 percent urban by population, but only 32 percent urban by area (INEGI, 1995). In other words, almost the entire population of the MCMA is living in heavily populated areas. Figure 2 below shows the trend of increasing MCMA urban area.
Figure 2. MCMA Urban Expansion 1900-1990 (Lemus, 1998)
Growth and land use patterns such as this are not unique in the region or the world. Neighboring metropolitan areas (Puebla, Tlaxcaia, Pachuca, Toluca and Cuernavaca) are also extending their territories, as have other megacities (e.g., New York, Tokyo and Bombay) around the world. Within Mexico, the multiple expansion of these metropolitan areas forms a unique urban area that has been designated a megalopolis, as shown in
Figure 3. MCMA in 1950 4 * . , MCMA in 1990 MCMA in 1970 I - - - - _
MCMA in 1900 MCMA in 1940 MCMAin i960
__V , I. -. -;. MCMA in 1980 I· I I: ·
EL ESQUEMA DE PLANEACION URBANO-REGIONAL DEL AREA DE ESTUDIO CONSI DE RA ESTA DENTRO DE LA MEGAL6POLI S.
(
La megal6polis comprende
asi:
en total 189 municipios que se distribuyen
Distrito Federal 16
F tln Ho~ MAg~ir co Q1
Estado de Puebla 29 /
Estado de Morelos 16 /
Estado de Tlaxcala 37
Figure 3. Map of Mexico Megalopolis: Mexico City and Nearby Metropolitan Areas Note: ZMCM = MCMA
Temperatures in the MCMA remain relatively constant throughout the year, with a monthly mean of 15 degrees Celsius (12°C in January and 17° C in May) (UNEP/WHO, 1993). Precipitation occurs primarily during the summer and totals about 725 millimeters per year. This precipitation pattern affects the concentration of pollutants such as suspended particulate matter by removing particles and soluble gases from the air. The
__
f-f I-4c
I -- -. . I(T\~V-Cgeographic characteristics described above in conjunction with relatively light winds
result in poor ventilation through the valley.
The MCMA contributes about one-third of the national Gross Domestic Product (GDP).
There are more than 30,000 industries and over 12,000 service facilities in the MCMA
(UNEP/WHO, 1993). All sectors of the MCMA consumed approximately 512 petajoules
(PJ) of energy in 1986, and 570 PJ in 1998 (Bazan, 2000). These facts highlight the
importance of the MCMA; its sustainability will undeniably affect the future of Mexico. Air Pollution
The MCMA has a serious air pollution problem that has increased with the growth of the
city size, population, industry and vehicular traffic. This section will present the primary sources of those pollutants, the monitoring and regulatory system established, ambient pollutant concentrations in the MCMA, distribution of pollutants and the key health
effects of each.
Emissions and Sources
With the population growth and urban sprawl, the needs for fuel, housing, transportation, industrial production, services and natural resources grew, as did the generation of
atmospheric pollutants. In combination with over 3.5 million vehicles and around 35,000 industries and commercial services, MCMA activities consume more than 44 million liters of fuel per day, producing thousands of tonnes of pollutant emissions. Many of
these primary pollutants can react in the atmosphere to generate other, sometimes more dangerous, secondary pollutants. Figure 4 shows the recent 1998 Emissions Inventory prepared by CAM. The bars on the left show the total quantity of emissions and the bars to the right show the percentage contribution of each sector. Carbon Monoxide (CO) is only shown in the inset because its emissions are a relatively much greater magnitude.
HC NO HC I S02 7 I i
0
0--
00
00---0 X00 1000 1500 S02 PM10 I i 9* Power
0
S.v"&, .. UfLHndk I--- ' --- .-- 'Large & Medium Indutrry Biogenic (including Fire
B Commencil Solvets a Pive thichkies
[ CommrciC Other l Road-Based PubkcTranp
*§ Non-Vehde Road-Based N4onOw al Fnsght
* Rederial(Direct) * OnlFmlght * Ful Dtinbton 8 Strage a Chr Traspoutroo.
50 100 150 200 250 300 350 4WU 45u 0 2U 40 0U 80 1U
Annual Emissions (kilotonnes) Percent
Figure 4. 1998 MCMA Emission Inventory (CAM, 2002)
Image designed and provided by Stephen Connors.
Mo r _ _ _ ! i __ _ _ i II i ' 1 In .... :.... i...- ... r... r . .... - _ _ _ _ - - - _ _
-The scenario analysis methodology selected by the Mexico City Program will analyze
emission sources on a sectoral basis. As shown, transportation sources dominate nitrogen
oxides (NOx) and carbon monoxide (CO) emissions, but industry and other fuel combustions sources contribute. Industry and power plants are two of the primary sources of sulfur oxides (SOx). Particulate matter (PM) emissions results from fuel
combustion as well as environmental degradation such as forest fires. Non-methane
hydrocarbon (NMHC) emissions result from leakage of unburned fuel and use of solvents, as well as fuel combustion. Although not the primary emitter of any pollutant,
residential sources do play a role in emissions of each.
CAM's estimation demonstrates the high levels of pollution in the MCMA and calls for
concern and action to be taken. However, the situation may be even worse than is presented, for several emissions sources seem to have been excluded from the inventory including fuel wood consumption, informal commercial and residential activity, off-road
vehicle use, and others.
Ozone, a product of volatile organic compounds (VOCs), including NMHCs, and NOx, is not included in this inventory because it is not a direct emission. Greenhouse gases, a global concern, are also excluded in this particular inventory, but one is available for the DF from another organization 3 .
A main source of MCMA air pollution is energy consumption (UNEP/WHO, 1993). Figure 5 below shows 1998 non-electric energy consumption in the MCMA by fuel type.
The consumption shown does not include final electricity consumption, but does include non-electric fuels consumed during the generation of electricity. Although some
industries and residential and commercial structures have been switching from liquid petroleum gas (LPG) to natural gas since 1998, the percentages shown are still
reasonable.
3This inventory could not be used for comparison with CAM's Inventory because different source and geographic categories are used.
Figure 5. 1998 MCMA Non-electric Fuel Consumption, by Fuel (Bazan, 2000)
This figure illustrates the role of each sector for different fuels. The residential sector is
the major consumer of LPG and solid fuels - primarily wood.
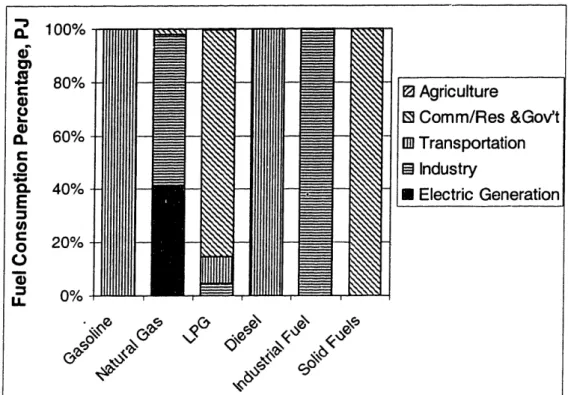
Figure 6 presents fuel consumption from the same year in a different format, to highlight the relative energy demand by sector. This figure can be used to determine quantities (PJ) of each fuel used.
a 100% .. 0) S 80% C 0 0 an 60% C § . 40% E () 0% Il 0%
[
Agriculture
[ Comm/Res &Gov't I TransportationI Industry
E Electric Generation * C) k9 CFigure 6. 1998 MCMA Non-electric Fuel Consumption, by Sector (Bazan, 2000) The data shown in this figure does not include fuel consumed for agricultural purposes.
Within Bazan's category of the commercial, residential and public sectors, the fuel most
commonly used is LPG. And as we saw from Figure 6 above, most of this LPG is
consumed in residential households. Electricity and wood consumption are also shown to
be significant.
Monitoring
The Mexican government and citizens recognized air pollution as a problem and began monitoring pollutant concentrations in the 1950s. Initially, 14 monitoring stations were installed to monitor smoke, suspended particulate matter (SPM) and sulfur dioxide (SO2).
In the early 1970s, through support by the United Nations Environment Programme (UNEP), Mexican authorities developed a program to improve environmental quality in several cities. As part of this program, a manual network for SO2 and SPM were
installed and completed in 1976. In 1985, an automatic routine monitoring network was
added through technical assistance by the U.S. Environmental Protection Agency (US EPA). The new network, titled Red Automatica (RAMA), measures SO2, carbon
monoxide (CO), ozone (03), nitrogen oxides (NOx) and non-methane hydrocarbons (NMHCs) and covers the majority of the MCMA. There are currently no routine measurements of VOCs in the MCMA, but measurements of some selected hydrocarbons
are made at two sites. There are only five full capability stations, however, equipped to
measure all of these five pollutants. One of these stations is located in each of the four
city quadrants and in the city center. The 16 station manual network is still operational as JUU 250 1. o 200 E 150 0 en 0 100
0
:3 50 LL 0 E Other Intermediates o Solid Fuels 0[ Industrial Fuel f9 Diesel mi LPG 3 Natural Gas * Gasoline (j0k 'OIe-
4 COo. .'---
II I .0IQ,'C 1-1140well. Universities, such as the National (UNAM) and the Metropolitan (UAM), also use
some of their own monitoring equipment. Regulation
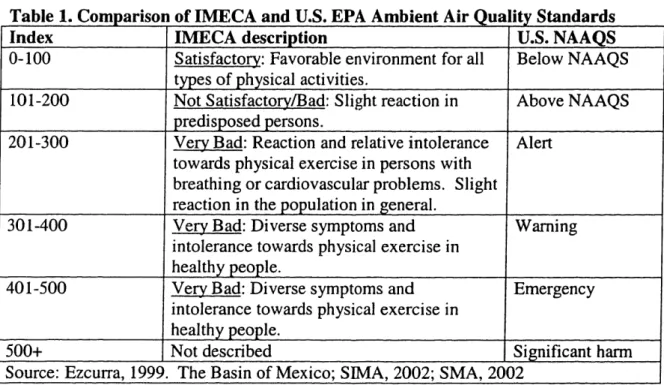
The measurements are reported daily to the public as an index value named an "IMECA" (Indice Metropolitano de la Calidad del Aire). The IMECA calculation scales each pollutant concentration from 0 (best) to 500 (worst) and sets the criterion value for each pollutant equal to 100 points. If the IMECA passes 300 points, a contingency program is
triggered. This contingency program includes actions such as industry activity reductions and vehicle restrictions. Table 1 describes each IMECA Index level in terms of the
health effects expected and the relative stringency compared to U.S. Environmental
Protection Agency National Ambient Air Quality Standards (NAAQS), which are used to
regulate metropolitan areas.
Table 1. Comparison of IMECA and U.S. EPA Ambient Air Qua lity Standards
Index IMECA description U.S. NAAQS
0-100 Satisfactory: Favorable environment for all Below NAAQS types of physical activities.
101-200 Not Satisfactory/Bad: Slight reaction in Above NAAQS predisposed persons.
201-300 Very Bad: Reaction and relative intolerance Alert towards physical exercise in persons with
breathing or cardiovascular problems. Slight
reaction in the population in general.
301-400 Very Bad: Diverse symptoms and Warning
intolerance towards physical exercise in healthy people.
401-500 Very Bad: Diverse symptoms and Emergency
intolerance towards physical exercise in healthy people.
500+ Not described Significant harm
Source: Ezcurra, 1999. The Basin of Mexico; SIMA, 2002; SMA, 2002
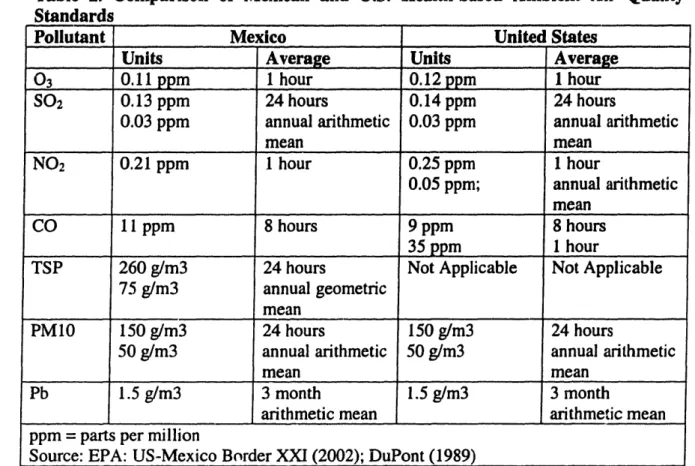
For comparison, Tables 2 presents the numeric air quality standards for Mexico and the U.S. Environmental Protection Agency. As shown, the health-based standards are very
Table 2. Comparison of Mexican and U.S. Health-based Ambient Air Quality Standards
Pollutant Mexico United States
Units Average Units Average
03 0.11 ppm 1 hour 0.12 ppm I hour
SO2 0.13 ppm 24 hours 0.14 ppm 24 hours
0.03 ppm annual arithmetic 0.03 ppm annual arithmetic
mean mean
NO2 0.21 ppm 1 hour 0.25 ppm 1 hour
0.05 ppm; annual arithmetic mean
CO 11 ppm 8 hours 9 ppm 8 hours
35 ppm I1 hour
TSP 260 g/m3 24 hours Not Applicable Not Applicable
75 g/m3 annual geometric
mean
PM10 150 g/m3 24 hours 150 g/m3 24 hours
50 g/m3 annual arithmetic 50 g/m3 annual arithmetic
mean mean
Pb 1.5 g/m3 3 month 1.5 g/m3 3 month
arithmetic mean arithmetic mean
ppm = parts per million
Source: EPA: US-Mexico Border XXI (2002); DuPont (1989)
Although studies of other metropolitan areas with urban pollution problems have been useful, each nation's air quality standards and laws to achieve reduction are, and should be, situation specific (LANL, 1999). While Mexican policies and actions have addressed a portion of the problem and reduced some emissions, serious problems still persist. Distribution
Generally, air pollution as measured by RAMA is highly variable within the city with
SO2, 03, and CO showing the greatest presence in all areas. SO2air quality standards are
exceeded occasionally at specific sites (UNEP/WHO, 1993). Ozone levels are highest in the southwest and lowest in the northeast. Using information from Blake and Rowland (1995), it can be hypothesized that ozone produced from LPG leakage (during transmission, distribution and use, contributing to about 20 percent of ozone formation) would originate in the most populated sections and then be carried by the prevailing northeast winds to the southwest. As expected, CO levels peak during morning hours, when low temperatures and atmospheric inversions often occur in combination with high vehicular traffic.
PM is concentrated in the northeast and declined towards the southwest, possibly illustrating the importance of winds (Pick and Butler, 1997). PM emissions frequently violate daily and annual standards (Molina, 2000). PM10, particles less than 10 micrometers in size, have the most pronounced impact on health and visibility and
typically represent between 40 and 60 percent of the total suspended particulate matter (SPM) reported by monitoring stations.
NOx concentration levels are often above WHO guidelines and the national air quality standards. During 1986-1991, safe levels of NOx were exceeded less than 5percent of
the time (UNEP/WHO, 1993). NOx is also a precursor of ozone and, as expected, high NOx and HC pollutant levels and local topography and meteorological conditions contribute to very high ozone levels in the city. The greatest frequency of excess occurs in the south-western zone of the MCMA, at the Pedregal monitoring site. Eighty to 100
hours per month of exceedance is not unusual. Health Effects
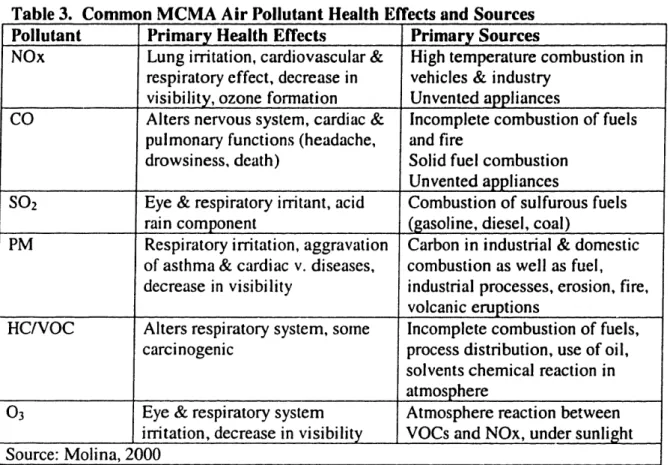
The air pollutants present in the MCMA each have several health effects that have been associated with them. Table 3 presents the most common health effects and the primary pollutant sources.
Table 3. Common MCMA Air Pollutant Health Effects and Sources
Pollutant Primary Health Effects Primary Sources
NOx Lung irritation, cardiovascular & High temperature combustion in respiratory effect, decrease in vehicles & industry
visibility, ozone formation Unvented appliances
CO Alters nervous system, cardiac & Incomplete combustion of fuels
pulmonary functions (headache, and fire
drowsiness, death) Solid fuel combustion Unvented appliances
SO2 Eye & respiratory irritant, acid Combustion of sulfurous fuels
rain component (gasoline, diesel, coal)
PM Respiratory irritation, aggravation Carbon in industrial & domestic of asthma & cardiac v. diseases, combustion as well as fuel, decrease in visibility industrial processes, erosion, fire,
volcanic eruptions
HC/VOC Alters respiratory system, some Incomplete combustion of fuels,
carcinogenic process distribution, use of oil, solvents chemical reaction in
atmosphere
03 Eye & respiratory system Atmosphere reaction between irritation, decrease in visibility VOCs and NOx, under sunlight Source: Molina, 2000
Air pollution problems impose significant health and economic costs. Worldwide, PM
has been found to increase daily mortality, primarily from cardiovascular deaths
(American Cancer Society, 1995; Six Cities Study, 1993). Some recent evidence also
suggests it could contribute to premature deaths among infants (Molina, 2000).
Long-term exposure could increase the chronic mortality caused by respiratory or cardiovascular diseases as well as chronic bronchitis, hospital admissions for respiratory or cardiovascular cases, visits to the emergency room for respiratory problems, asthma
attacks, symptoms in the upper airways, and restricted activity days. The incomplete fuel combustion mentioned earlier also exacerbates respiratory health problems, such as asthma. Ozone also has strong effects on respiratory function, respiratory symptoms
(such as eye irritation and cough) and on hospital admissions for asthma and other
respiratory conditions. More information on health effects within households and
CHAPTER 4. RESIDENTIAL SECTOR PROFILE
As stated above, the residential sector contributes to the air pollution in the Mexico City
Metropolitan Area and is an important point of direct human exposure to pollutants. This chapter will provide more information about this Program's definition of the residential sector and sources of information about the sector's characteristics. It also describes
historic sector socioeconomic and housing trends and current conditions.
Residential Proiect Scope
The residential sector, as defined by this project, includes all households within the
MCMA and household activities such as fuel consumption and combustion and solvent
usage. It includes households as defined and included by the Mexican Census and INEGI housce'rld surveys. It does not include external activities related to households such as
trash collection and disposal, industry or other sector emissions caused by an increase in household product consumption or commercial operations performed within the home. A household is defined by this project as the related and unrelated residents living in one
living area or housing unit and occupants are defined as the individuals who reside in the household. In some cases, this may be more than one family. This level of analysis has been chosen because this unit will be involved with making energy consumption decisions and will receive services and pay bills as a group. Generalizations beyond this unit of measurement will not be made.
At this time, residential characteristics and data are only available at the MCMA and
municipality/district level. However, other groups have tried to categorize the population
by other means. Disaggregating the residential sector into subsectors would provide
more accurate modeling and more specific and focused policy options. Because data was not available at this level of specificity, we were only able to model the MCMA residential sector only at the MCMA level, aggregating what data we had of more
specific subcategories. However, possible subcategories are presented here for future consideration.
The Mexican Association of Marketing and Public Opinion Research Agencies (AMAI)
uses a Socioeconomic Level (SEL) as a way to measure and classify the Mexican
population. This variable is divided into six groups, based on household income and/or
lifestyle, as shown in Figure below. As shown, the MCMA population is slightly skewed to the high and low extremes of the income/lifestyle categories.