2D IR Spectroscopy and Computational Modeling:
Application to Protein Folding and Binding
by
MASZiad Ganim
B. S., University of California (2003)
Submitted to the Department of Chemistry
in partial fulfillment of the requirements for the degree of
Doctor of Philosophy in Physical Chemistry
at the
MASSACHUSETTS INSTITUTE OF TECHNOLOGY
SACHUSETTS INSTYTiTE OF TECHNOLOGY
JUN 0
2
2010
LIBRARIES
ARCHIVES
May 2010
@
Massachusetts Institute of Technology 2010. All rights reserved.
Author..
. ... :... ... . . . . . . . . .Department of Chemistry
May 21, 2010
/'.4C ertified by ...
Andrei Tokma
Profess
Thesis Supervisor
72
A ccepted by ...
Robert W. Field
Chairman, Department Committee on Graduate Theses
This doctoral thesis has been examined by a Committee of the Department of Chemistry that included,
Professor Robert . ffin
Chair
Professor Keith A. Nelson
Professor Andrei Tokmakoff Thesis Supervisor A ii /
"6
11---A--6
...
2D IR Spectroscopy and Computational Modeling:
Application to Protein Folding and Binding
by
Ziad Ganim
Submitted to the Department of Chemistry on May 21, 2010, in partial fulfillment of the
requirements for the degree of
Doctor of Philosophy in Physical Chemistry
Abstract
In this thesis, dynamics experiments are developed that can be used to study pro-tein conformational changes such as folding and binding. Every functional motion of a protein is inextricably linked to conformational dynamics. However, most of our insight into protein folding and binding is indirectly obtained through kinetics experiments that measure reaction rates and reveal how fast populations of stable states interconvert. Two-dimensional infrared spectroscopy (2D IR) is the central tool developed in this thesis for protein dynamics experiments due to its combination of time and structural resolution. As a vibrational spectroscopy, 2D IR potentially of-fers femtosecond time resolution. Its advantages over linear, absorption spectroscopy come through correlating excitation and emission frequencies to allow for a separa-tion of homogenous and inhomogeneous line shape components, and to give rise to structurally sensitive cross-peaks. One general problem was repeatedly addressed in this thesis: how can 2D IR spectra best be modeled to reveal atomistic structural in-formation? The key feature that now sets 2D IR apart from other fast protein probes is that the data can readily be calculated from an atomistic structure or molecular dynamics simulation using the methods developed in this thesis work. Demonstra-tive applications are presented for the amide 1-11 spectroscopy of NMA, the amide 1'-II' spectroscopy of poly-L-lysine, isotope-edited 2D IR spectroscopy of trpzip2, and transient 2D JR spectroscopy of ubiquitin unfolding after a temperature jump. The emerging paradigm is to interpret 2D IR spectra with the aid of an atomistic, molecu-lar dynamics simulation. The applications to protein binding use the monomer-dimer transition of insulin as a model system. Using a combination of experiments and sim-ulations, this equilibrium was characterized as a function of protein concentration, temperature, and solvent. Finally, as a complement to the structural information provided by 2D IR, dye-labeling and intrinsic tyrosine fluorescence experiments on insulin are described.
Thesis Supervisor: Andrei Tokmakoff Title: Professor
To my first math and science teachers-my mother and father
Acknowledgments
Graduate school has been an incredible ride for me. I would like to start my acknowl-edgments by reflecting on what brought me here. For as long as I can remember, I've known my parents to be incredibly hard workers and I've tried to emulate their example. They instilled in me a love for school and wound my spring tightly enough to keep me excited about learning all this time. I knew that I had to be good at math like my mom and dad before I even knew what math was. They made sure that I did know before my first day of kindergarten, and continued to take my education seri-ously and personally from then on. They gave me great confidence in myself, enrolled me in the best public schools, and always made sure I had all the tools necessary to learn. As the culmination of the schooling they began, I dedicate this thesis to my mother and father.
My parents are only the beginning of the tremendous encouragement I've received
from my family. I am very grateful for the unwavering support of my brother, Sam.
I am fortunate enough to have many aunts, uncles, and cousins, which guarantees a
constant flux of their well-wishes. Thank you for everything.
I first knew that I wanted to go to graduate school when I was an undergraduate
in Rich Mathies' group. I started as a biochemistry major, barely out of freshman chemistry, and interested in proteins. Rich gave me the responsibility for purifying rhodopsin and it was through him that I was able to work closely with three grad-uate students- Judy Kim, David McCamant, Mike Tauber- and two post-docs- Elsa Yan and Duohai Pan. Discussions with them about quantum mechanics, vibrational spectroscopy, and optics captured my imagination; I got to see the life of a graduate student up close and personal, and I learned that graduate school was the place for curious people to learn, teach other, and discuss all day. Rich gave me the freedom to work on my first computational project, and by then I was hooked. I am so grateful that I had such a wonderful group of mentors to help me find my path.
When I came to MIT, I was not expecting to stay into the next decade. I credit Andrei for advising me through a set of projects that leave me excited enough at
the end of the day that I'm always ready to pick up the next morning. I believe the scariest feeling in graduate school is being trapped; to be unable to leave a dark, locked room until you've slain a beast, which you've already failed to slay and is not guaranteed to be mortal. These character-building moments are indeed necessary to appreciate success. However, these moments have been rare for me, and for that, I am thankful for Andrei's creativity, open-mindedness, and trust. With his encouragement, I've been able to grow protein crystals, learn gene expression, work on ion-caging complexes and amyloid fibrils. While these projects have at times been tangent to my top priorities, I would never trade the experiences. As a direct result, when I look back at graduate school my vivid memories are of thoughts such as, "Maybe this will work, and wouldn't it be great if it did?" and, "I can't wait for the next step. This is going to be amazing." In addition to helping me self-actualize, such a work environment has given me strength during some challenging personal times.
As a young student, I learned the most about lab from Hoi Sung Chung. I re-member watching him and building an expectation that whenever I would touch any optic, the signal would go up. His talent was matched by patience and generosity; this was the perfect safety net for someone new to the world of corralling invisible beams around the table. I also benefitted from working with Adam Smith and Benjamin Dietzek in lab. Through my early interactions with senior students, Chris Fecko and Joel Eaves, I quickly learned that the Tokmakoff Group set high standards for the quality of work, and I have been compelled to maintain that reputation.
I learned a great deal about optics and spectroscopy from Joe Loparo, Matt De-Camp, Poul Petersen, and Lauren DeFlores. For a while, our desk arrangement was most conducive to continuing the flowing conversations from lunch that would me-ander from academic life, interferometry, and photon echoes into politics and policy. As I began to discover my niche as the computational student for protein-related projects, I was thankful that other people were willing to share their projects with me. I first worked with Lauren on NMA because I thought it was fun; the fact that it ended up being both fun and productive helped shape these types of collaborations into a pattern for me.
I feel a kindred bond to students who entered my year and went through all the
same trials with me. As the last person in my incoming class to graduate, I've seen them all come and go, and I look forward to keeping in touch. Sean Roberts is a talented researcher who shares my vision of combining experiments and simulations, and has always been a wonderful resource and a sympathetic ear whose opinion I trust and respect greatly.
A very special mention needs to go out to the "Muddy Crew" who are the people
that deal with my anguish and share in my joys on nearly a daily basis, and cer-tainly on Wednesday nights- Marvin Bayro, Marc Caporini, Xander Barnes, Galia Debelouchina, Ashley Ball, Leo Gomez, Bj6rn Corzilius, and Albert Smith are a tremendous support group that have surely helped me more than they realize. A du-bious honor goes to Becky Nicodemus for her dual membership in the Muddy Crew and Tokmakoff group. As a close friend and a careful scientist, I have depended a lot on her and will always value her direct opinion. I've been reminded that life doesn't end at MIT through friendships with John Higby, Joe Osborne, and people from CAMS and Berkeley. They've all helped me maintain perspective and allowed me to live vicariously in the world outside academia.
As someone who enjoys both teaching and learning, I'm thankful for the time I've spent working with younger students. I've enjoyed plenty of scientific and light-hearted discussions with Joshua Lessing and Krupa Ramasesha. In lab, I quickly realized that Kevin Jones, and more recently, Chunte Sam Peng are both far more than just extra hands. I've learned from their expertise and they have helped me become a better teacher by challenging my perspective. They have helped me find and plug knowledge gaps, and I look forward to seeing their successes in the Big Lab.
Contents
1 Introduction
1.1 Dynamics Experiments . . . . 1.2 Thesis O utline . . . .
1.3 Introduction to Two-Dimensional Infrared Spectroscopy . . . . 1.3.1 Challenges in Interpreting Protein Vibrational Spectra
1.3.2 Amide I Vibrations . . . .
1.3.3 Amide I 2D IR of Secondary Structure 1.3.4 Protein 2D IR Spectra . . . . 1.4 Afterword . . . .
2 Third-Order Infrared Experimental Methods
2.1 Implementations of 2D IR Spectroscopy . . . . 2.2 Acquiring 2D IR Spectra . . . . 2.2.1 Generating 6 pm Light . . . . 2.2.2 2D IR Spectrometer . . . . 2.2.3 2D IR Experiments . . . . 2.3 2D IR Data Workup . . . . 2.4 Representations of 2D IR Spectra . . . .
2.5 Basic Features of 2D IR Spectra . . . .
2.5.1 Diagonal Peaks . . . .
2.5.2 Cross Peaks . . . .
2.6 Line Shapes and Intensity . . . . 2.6.1 Polarization-Selectivity . . . . . . . . 35 . . . . 35 . . . . 38 . . . . 40 41 . . . . 4 1 . . . . 43 . . . . 43 . . . . 44 . . . . 46 . . . . 50 . . . . 52 . . . . 54 . . . . 54 . . . . 55 . . . . 57 . . . . 59
2.6.2 Phase Twist in 2D IR Line Shapes . . . .
2.6.3 2D IR Peak Positions . . . . 2.7 Slices and Projections: One-Dimensional Representations of 2D IR
Sp ectra . . . . 3 Numerical and Analytical Methods for Evaluating Third-Order
Re-sponse Functions
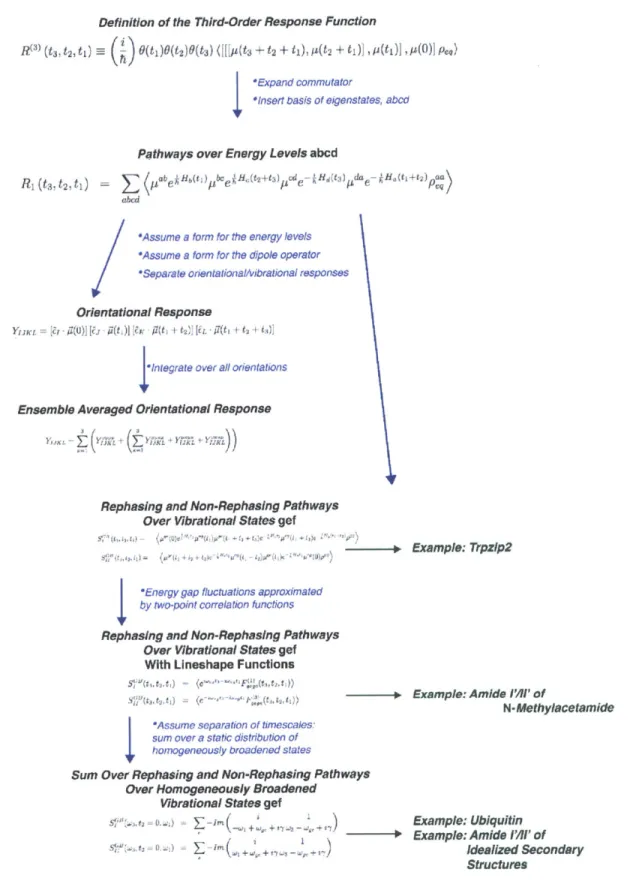
3.1 Response Function Formalism . . . .
3.2 Amide I' - Amide II' 2D IR Spectroscopy of N-methylacetamide . . . 3.3 Modeling the Amide I'-II' 2D IR Spectra of Idealized Secondary
Struc-tures ... ...
3.3.1 Experimental Results . . . .
3.3.2 Amide I'-II' Model . . . . 3.4 Afterword and Acknowledgements . . . . 4 Simulating 2D IR Spectra Using MD Simulations: Spectral
Signa-tures of Heterogeneous Protein Ensembles
4.1 Introduction . . . . 4.2 Methods .... ...
4.2.1 The Amide I Subspace . . . . 4.2.2 MD Simulations . . . .
4.2.3 IR Spectroscopy . . . .
4.2.4 Experimental . . . .
4.3 Results and Discussion . . . . 4.3.1 Information Content of FTIR vs. 2DIR
4.3.2 Static Averaging for 2DIR . . . .
4.4 4.5 4.6
4.3.3 The Origin of Frequency Shifts in Site F 4.3.4 Relative Importance of Coupling and Si Conclusions . . . . Acknowledgements . . . . A fterword . . . . 91 . . . . 9 1 . . . . 94 . . . . 94 . . . . 98 . . . . 99 . . . . 102 . . . . 102 . . . . 102 . . . . 104 nergy Models . . . . . 108 te Energies . . . . 109 . . . . 112 . . . . 114 . . . . 114 59 61 62 65 67 77 81 81 84 88
5 Melting of a 3-hairpin Peptide Using Isotope-Edited 2D IR
Spec-troscopy and Simulations 119
5.1 Isotope Labeling Experiments ... 120
5.2 Modeling Trpzip2 Spectroscopy using Hidden Markov Model Macrostates 122 5.2.1 Time-Correlation Methods vs. Static Averaging Methods for Calculating 2D IR Spectra . . . . 123
5.3 Results for Trpzip2 . . . . 124
5.4 Conclusions . . . . 132
5.5 Acknowledgements and Afterword . . . . 132
6 Transient Two-Dimensional Spectroscopy of Ubiquitin Unfolding: A Comparison of Dynamics from Experiment and MD Simulation 135 6.1 Introduction . . . . 6.2 Materials and Methods . . . . 6.2.1 2D JR Spectroscopy . . . . 6.2.2 Transient 2D IR spectroscopy . . . . 6.2.3 Temperature Jump Synchronization . . . . 6.2.4 Sample Preparation . . . . 6.2.5 Simulating 2D IR Spectra . . . . 6.3 Experimental Results and Discussion . . . . 6.3.1 Equilibrium Measurements . . . . 6.3.2 Transient Thermal Unfolding of Ubiquitin 6.3.3 Line Broadening During Unfolding . . . . . . . . 135 . . . . 139 . . . . 139 . . . . 141 . . . . 141 . . . . 142 . . . . 143 . . . . 145 . . . . 145 . . . . 147 . . . . 151
6.3.4 Comparison to T-jump 2D IR Spectrum of Ubiquitin a
25 0C...
6.3.5 Comparison with DVE Results . . . . 6.3.6 Temperature Dependence of Homogeneous Broadening
6.3.7 Unfolding Mechanism of Ubiquitin . . . .
6.3.8 Comparison with Simulation . . . .
6.4 Conclusions . . . . 152 153 155 155 157 162 t Ti =
6.5 Acknowledgements . . . . 6.6 A fterw ord . . . .
7 The Biophysics of Coupled Protein Folding and Binding
7.1 Diffusive Encounter . . . .
7.1.1 Single Particle Diffusion . . . .
7.1.2 Association Kinetics from Two Particle Diffusion . . . .
7.2 Recognition and Binding . . . .
7.2.1 Methods for Studying Protein Association Biophysics . . . . .
7.2.2 Computational Methods for Predicting Protein Association . .
7.2.3 Conclusions about the Current State of Protein Association M odels . . . .
7.3 Free Energy Surfaces for Coupled Protein Folding/Binding Processes
7.3.1 Binding Mechanisms Characterized by Free Energy Surfaces 7.4 Insulin Background . . . .
8 Insulin Dimer Dissociation and Unfolding Revealed by Amide I Two-Dimensional Infrared Spectroscopy
8.1 Introduction . . . . 8.2 M ethods . . . . 8.2.1 Sample Preparation . . . . 8.2.2 Window Treatment . . . . 8.2.3 Sim ulations . . . . 8.3 R esults . . . .
8.3.1 Concentration-Dependent 2D IR Spectral Features
8.3.2 KD Measurements . . . . 8.3.3 Temperature-Dependent 2D IR Spectral Features . 8.3.4 8.3.5 8.3.6 8.3.7 181 . . . . 181 . . . . 182 . . . . 182 . . . . 182 . . . . 183 . . . . 185 . . . . 185 . . . . 187 . . . . 189
Solvent-Dependent Thermal Dissociation and Unfolding. Thermodynamic Modeling . . . . Structural Modeling of Insulin 2D IR Spectra . . . . Bright State Analysis of the Calculated Spectra . . . . .
190 194 197 198 162 162 63 163 163 165 166 167 169 171 174 175 177
8.4 Discussion . . . . 8.4.1 Monomer and Dimer Spectral Signatures Across the Various IR
Spectra . . . . 8.4.2 Solvent and Temperature Effects . . . . 8.5 Conclusions . . . . 8.6 Acknowledgements . . . . 8.7 Afterword . . . .
9 Insulin Monomer and Dimer Equilibrium Fluorescence Experiments211
9.1 Motivation . . . . . . . . 211
9.2 Dye-Labeled Insulin Fluorescence . . . . 9.2.1 Synthesis, Purification, and Spectroscopic Methods 9.2.2 Characterization of Labeled Insulin . . . . 9.2.3 Measuring the Dissociation Constant, KD -... 9.2.4 Thermal Dimer Dissociation . . . . 9.2.5 Conclusions . . . . 9.3 Intrinsic Insulin Fluorescence . . . . 9.3.1 Background . . . . 9.3.2 Experimental Setup . . . . 9.3.3 Results and Discussion for Insulin Fluorescence . . 9.3.4 Conclusions . . . . 9.4 Acknowledgement . . . . . . . . . 212 . . . . . 213 . . . . . 216 . .. . . 219 . . . . . 223 . . . . . 224 . . . . . 227 . . . . . 227 . . . . . 228 . . . . . 230 . . . . . 234 . . . . . 234
A MATLAB Code for Calculating 2D IR Spectra of Six-Level Systems235
243 B Texas Red-Insulin Mass Spectra
17 200 200 202 207 209 209
List of Figures
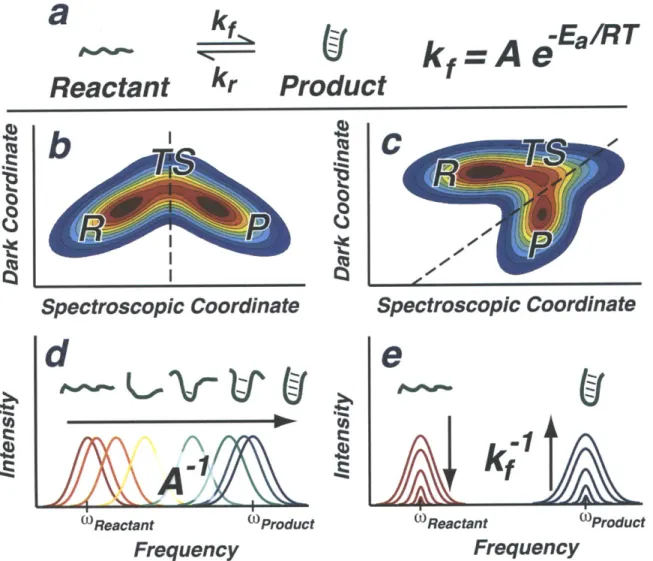
1-1 Illustration of considerations for a dynamics experiment. (a) A
fold-ing reaction with two structurally distinct equilibrium states that is characterized by the rates kf and kr. (b) A spectroscopic coordinate that distinguishes between the reactant (R), product (P), and transi-tion state (TS) with a dividing line on the free energy surface. (c) A free energy surface where the product well and transition state are not separable from the reactant without inclusion of an unobservable, dark coordinate. (d) A schematic of a dynamics experiment that directly reveals time-resolved structural changes and the barrier-free rate. (c) Time-resolved populations observed in a kinetics experiment that mea-sure the overall rate, kf, and require additional assumptions to reveal dynamical information. . . . . 28
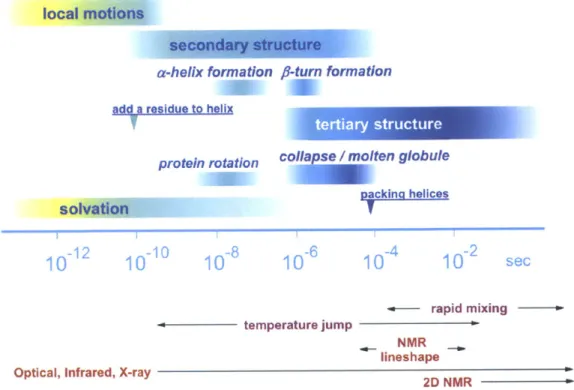
1-2 Overview of time scales for protein dynamics and kinetics and directly accessible time scales by experiments. . . . . 29
1-3 The Amide I Mode in Proteins. (Top) Empirical protein structure-frequency relationships in the amide I region. (Bottom) A color-coded visualization of the IR active 0-sheet and a-helix states where the shading intensity is proportional to the participation ratio of a unit oscillator and the color denotes its phase; blue and red are 1800 out-of-phase. Figure excerpted from Ganim et al.1 . . . . 36
1-4 Amide I FTIR and 2D JR spectra demonstrating secondary structure sensitivity. (Top) FTIR and 2D IR spectra of the three forms of poly-L-lysine compared to calculated FTIR and 2D IR spectra of ideal-ized structures (Bottom). Gaussian random site energies are sampled around a mean of 1650 cm- for the a helix, and random coil (o- = 10
cm-1 and 12 cm-1) with a homogeneous line width of -y=12 cm-1 for
all. Figure adapted from Ganim et al.. . . . . 37 1-5 FTIR and 2D IR spectra for proteins with a varying amounts of 3
sheet and a helix secondary structure. The data was compiled from Demird6ven et al.,2 Chung et al.,3 Smith et al.,4 and Ganim et al.1. . 39
2-1 2D IR Inteferometer, Sample, and Detection Schematic. Figure adapted from Khalil et al.5 t* 0-The local oscillator (LO) and tracer (d)
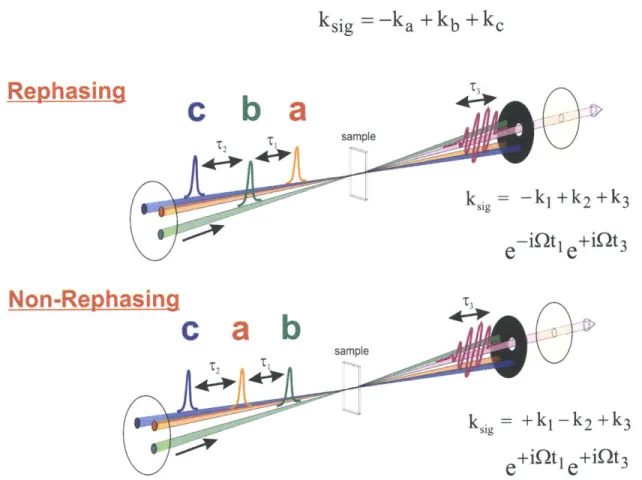
are delayed using the same translation stage, and are thus alternately u sed . . . . 45 2-2 Pulse Sequence and Wavevector Matching for Rephasing and
Non-Rephasing Experiments. Figure adapted from Khalil et al.5 . . . 47
2-3 Calibrating the w3 axis using spectral interferometry. . . . . 49 2-4 Rephasing and non-rephasing ti-w3 surfaces for the insulin dimer 2D
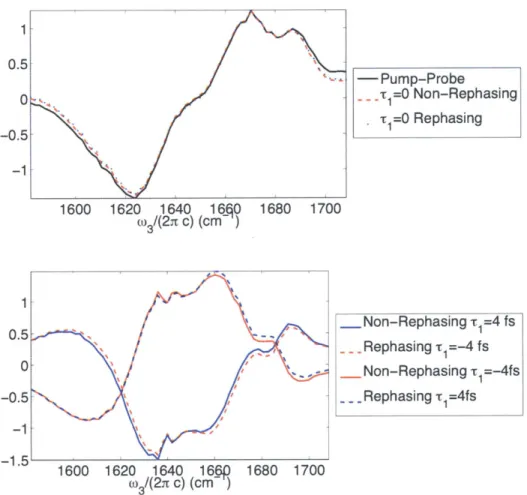
IR surface shown in Figure 8-2A. . . . . 50 2-5 Slices of correctly phased data from Figure 1-4, and comparison to the
pum p-probe. . . . . 53 2-6 One- and two-quantum dipole allowed transitions (in red and blue,
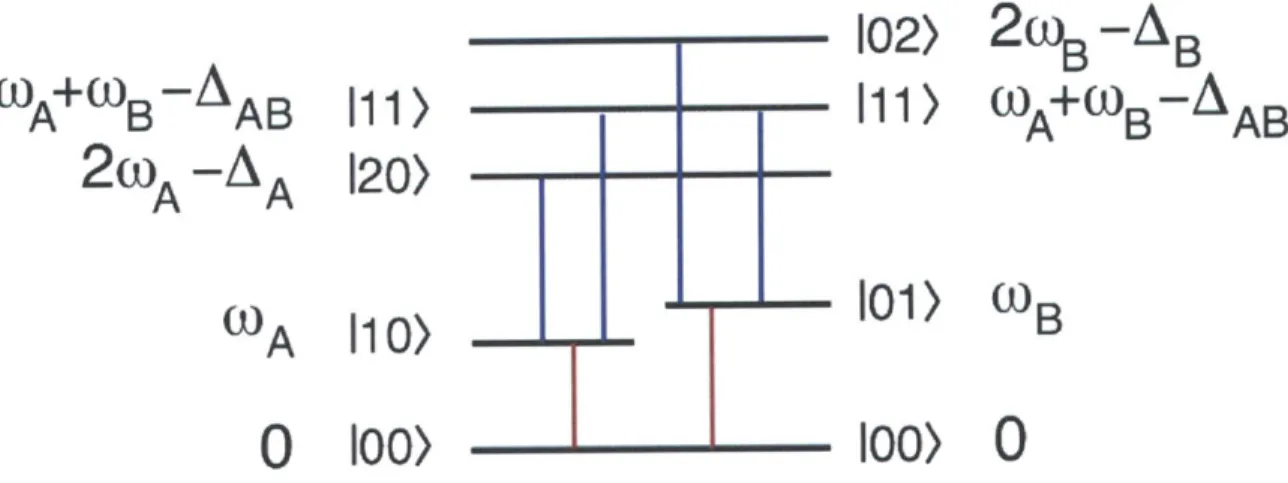
re-spectively) and energy levels for a two-dimensional anharmonic oscillator. 55
2-7 Sample 2D IR spectrum for the six-level system. . . . . 56
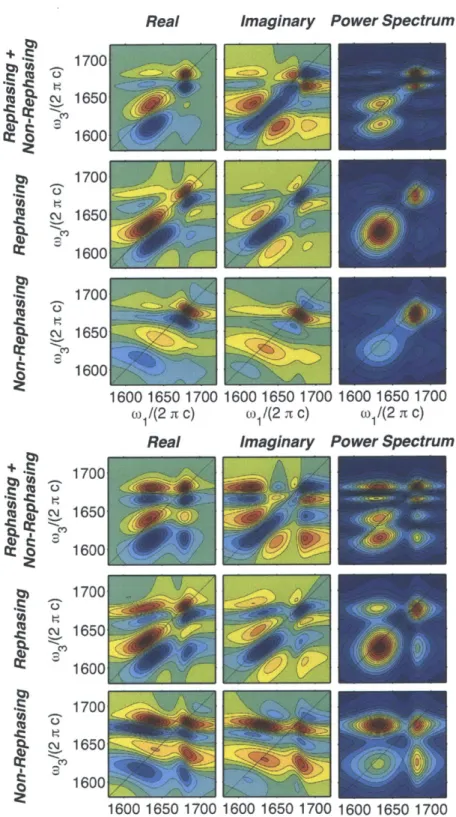
2-8 ZZZZ (Top) and ZZYY (Bottom) Real, Imaginary, and Power Spectra of Rephasing, Non-Rephasing, and Summed 2D IR spectra . . . . 58 2-9 Slices of the ZZYY 2D IR surfaces in Figure 1-8 at w1=1635 cm- . . 60
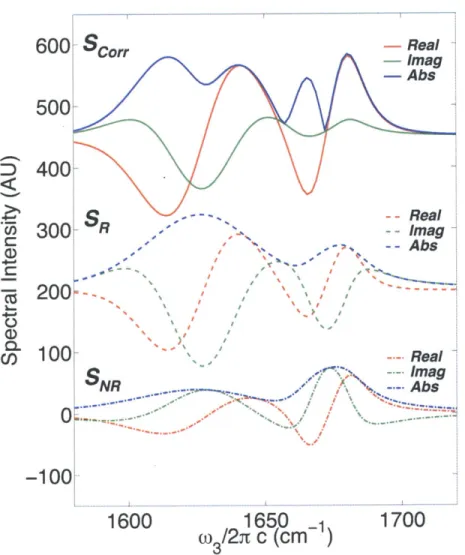
2-10 FT IR Spectrum, HDVE Spectra, Pump-Probe Spectra, and 2D IR Diagonal Slices for the Six-Level System in Figure 1-8. FT IR spectrum for the six-level system shown in Figure 1-8, projections (HDVE and pump-probe), and slices (Correlation Spectrum and NRPS Diagonal). 64
3-1 Layout of the approximations made to derive the third-order response functions presented in this chapter. . . . . 66
3-2 Feynman Diagrams corresponding to third-order signals for a multilevel
system . . . -. 71
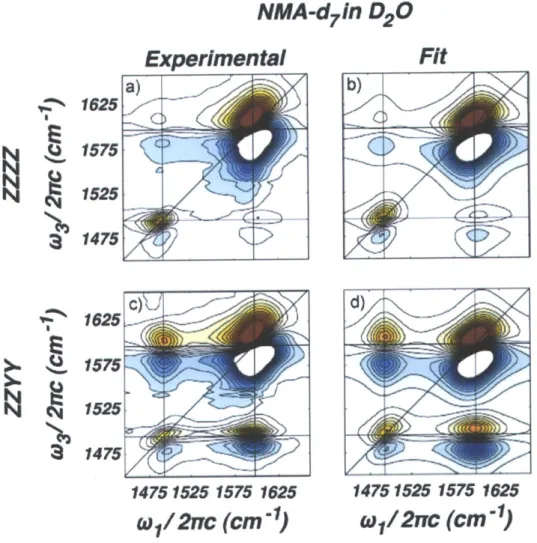
3-3 Simulated and experimental data for NMA-d7 in D20. Adapted from
D eFlores et al... . . . . 78
3-4 Six level system for NMA-d7 in D20 . . . . 79
3-5 Experimental amide I'-II' spectra of poly-L-lysine in its three forms. 2D IR spectra in (A) ZZZZ and (B) ZZYY polarization are plotted
along with (C) wi projections. Contours are plotted from ±80% of the amide I' normalized peak at a 5% spacing. For the -sheet conforma-tion, contours are plotted at 1.25% between ±20% to enhance subtle features of the cross peak region. . . . . 82
3-6 Calculated amide I'-II' spectra of three idealized secondary structures.
2D IR spectra in (A) ZZZZ and (B) ZZYY polarization are plotted
along with (C) wi projections. Contours are plotted from ±100% of the amide I' normalized peak at 7% spacing and 1.25% spacing for ±15%. 83
3-7 The Amide I-II Model Hamiltonian and Transition Dipoles. (Top) A
color-coded visualization of the amide I-II Hamiltonian. Each square on the diagonal represents a site and each off-diagonal square repre-sents a coupling value. The top left quadrant is the amide I manifold and the bottom right quadrant is the amide II manifold; the coupling between the amide I and amide II blocks is diagonal, which indicates that amide I-II couplings are only non-zero if the oscillators are at the same backbone site. (Bottom) A visual representation of the transition dip oles. . . . . 86
3-8 Comparison of Amide II' Coupling Mechanisms- Nearest Neighbor
Coupling and Mutual Coupling to Amide I'. . . . . 87
4-1 Comparison of Homogeneous and Inhomogeneous Broadening Mecha-nisms. As the Lorentzian HWHM parameter -y is increased, the pre-dicted FTIR linewidth begins to match experiment, but the prepre-dicted tilt in the 2DIR peaks is qualitatively incorrect. The spectra are for bovine pancreatic trypsin inhibitor (BPTI) calculated using the heuris-tic site energy model from the PDB structure 1BPI7. 21 evenly spaced contours are plotted from ±50% of the maximum for each spectrum. . 103
4-2 Averaging over structural heterogeneity in 2D IR lineshapes. Two sample spectra and structures are shown for slightly different hydro-gen bonding environments calculated using the Skinner 6P site en-ergy model. Note that the fine structure disappears and the diagonal elongation of the 2DIR peaks arises from the static average over the equilibrium distribution of hydrogen bonding environments character-ized by N, the number of internal hydrogen bonds, and RO-N, the oxygen-nitrogen hydrogen bond distance. 21 evenly spaced contours are plotted from ±50% of the maximum for each spectrum. . . . . 105
4-3 Comparison of Calculated and Experimental FTIR and 2DIR for Tr-pzip2, D-Arg, and Ubiquitin. 21 evenly spaced contours are plotted from ±50% of the maximum for each spectrum. . . . . 106 4-4 Trpzip2 site energy correlation functions. The normalized site energy
fluctuation correlation function (solid line), calculated with the Keider-ling 5P (dark) and Jansen 4F (light) models (a representative potential and field site energy model, respectively) are shown, in addition to the contribution from water (dashed line) for both models. . . . . 110 4-5 Site energy fluctuations give rise to diagonal broadening. Six
ex-ploratory calculations are presented in an attempt to identify the physical origins of spectral features in trpzip2, (A) All elements of the Hamiltonian set to their average value, (B) Site energies set to their average value, couplings sampled from MD, (C) Couplings set to their average value, site energies sampled, (D) All elements sampled,
(E) Couplings set to their average value, site energies sampled from a
Gaussian distribution with center and width corresponding to MD site energy statistics. 21 evenly spaced contours are plotted from ±50% of the maximum for each spectrum. . . . .111 4-6 Comparison of Calculated and Experimental FTIR and 2DIR for
Tr-pzip2, D-Arg, and Ubiquitin for all electrostatic potential-based site energy models. Calculated spectra from the manuscript of Ganim et al.' 21 evenly spaced contours are plotted from ±50% of the maximum for each spectrum . . . . . 116
4-7 Comparison of Calculated and Experimental FTIR and 2DIR for Tr-pzip2, D-Arg, and Ubiquitin for all non-electrostatic and electrostatic field-based site energy models. Calculated spectra from the manuscript of Ganim et al.8 The heuristic model uses PDB structures ILE1 for tr-pzip2, 1UBQ for ubiquitin, and a random equilibrated MD structure for D-Arg. 21 evenly spaced contours are plotted from ±50% of the maximum for each spectrum . . . . 117
5-1 Sequence, backbone structure, and isotope labeling sites for trpzip2 experim ents. . . . . 120
5-2 2D IR spectra of trpzip2 isotopologues focusing on the isotope-shifted
p eaks. . . . . 121
5-3 Comparison between numerical integration of the Schr6dinger equa-tion and static average methods for calculating 2D IR spectra. 2D IR spectra are plotted for the trpzip2 bulged Markov state (BT) us-ing the static averagus-ing method with different values of the Lorentzian linewidth parameter, 'y, and the NISE method. . . . . 124
5-4 Histograms of the site energies for each trpzip2 site separated by the five different Markov states. . . . . 125
5-5 Histograms of the site energies for each trpzip2 site separated by the
number of hydrogen bonds. . . . . 127
5-6 Calculated 2D IR spectra of trpzip2 and isotopologues for five different
M arkov states . . . . 128
5-7 FT IR and FT IR difference spectra of trpzip2 isotopologues.
Equilib-rium FTIR spectra are shown for each TZ2 isotopologue at 25'C and
pH = 2.5. Each spectrum is baseline corrected with a linear subtrac-tion, and area normalized for comparison. Difference data (bottom) are obtained by subtracting the unlabeled spectrum (TZ2-UL) from each of the spectra. The Si difference spectra is presented at 2x mag-nification for clarity. Arrows have been drawn to emphasize the isotope labelled peaks . . . . 129
5-8 Calculated trpzip2 FT IR and FT IR Difference Spectra. The difference
6-1 Downhill unfolding dynamics. A T-jump induces a barrier shift toward the folded state. A subensemble is trapped at the shifted transition state and unfolds in a downhill manner on the nanosecond-microsecond time scale (A). The downhill unfolding appears as a burst phase in experiments with millisecond time resolution. Subsequently, the excess population in the folded well unfolds across the barrier, which results in a millisecond exponential relaxation (B). The dotted vertical lines indicate barrier positions before and after the T-jump. . . . . 138
6-2 Structure of ubiquitin. (a) Crystal structure of ubiquitin9 rendered
with MOLMOL.10 (b) Projection of the 1-sheet of ubiquitin. A square
box with a digit n represents a peptide group formed by residues n and n
+1.
Red and purple lines indicate native contacts used in calculating the interstrand distance coordinates R1 and R2, respectively, in Fig. ??. 1396-3 Beam alignment and data processing for transient 2D IR spectroscopy.
Alignment of beams in the sample region (a). The LO is vertically displaced by 100 pm from the other three beams (a, b, and c) that
generate the third-order signal. . . . . 140
6-4 Equilibrium thermal unfolding of ubiquitin monitored by 2D IR spec-troscopy. Parallel (ZZZZ) (a) and perpendicular (ZZYY) (b) polariza-tion geometries. Spectra are normalized to the maximum of the 63 C spectrum. Twenty-one contours are plotted for ±60% of the spectra at
63 and 72 C and for 15% of the difference spectra (Right). Positive
and negative peaks are indicated by red and blue. Green and purple arrows represent cross-peaks. In the difference spectra, red and blue arrows indicate the diagonal peaks on the red and blue sides of the w3
6-5 Transient 2D IR difference spectra (ZZZZ) after a T-jump from 63 to 72 C. Transient difference spectra are plotted as a function of delay r. Twenty-one contours are plotted at 1.5% of the maximum of the reference spectrum at Tj = 63 0C. The spectra from 1 to 7 ms are
obtained from the same data set as the 100-ns spectrum. The red ellipse in Upper Left indicates depletion on the red side of the diagonal region . . . . 148
6-6 Semilog plot of transient changes in 2D IR spectra. (a) Temporal
profile of unfolding and refolding of ubiquitin constructed from the first
SVD component of the transient difference spectra shown in Fig. ??.
(b) Transient changes of slices at wi = 1642 cm 1 for representative delays between r = 100 ns (blue solid line) and 7 ms (red dashed line). (c) Relaxation profiles from W3 slices in b at W3 = 1639 cm-1 (light
blue) and 1663 cm-1 (magenta). (d and e) Transient slices at wi =
1620 cm 1 and the corresponding frequency shift of the positive peak
w3*. (f) Relative changes in the antidiagonal width of the vil (light blue) and random coil (magenta) components marked with arrows in the Inset. The normalized transient temperature relaxation profile
(black dashed line) is also shown. . . . . 150
6-7 Transient 2D IR spectra of ubiquitin (25->350C). (Left) Reference 2D
IR spectrum of ubiquitin at T = 25 C in the ZZZZ polarization
ge-ometry. Twenty-one contours are plotted in ±60% of the maximum. (Right) Transient 2D IR difference spectra [ZAS(t)]. Twenty-one con-tours are plotted from t1.5% of the maximum of the reference spectra. Depletion of the signal on the red side of the diagonal regions at 200 ns is marked with a red ellipse. The guidelines parallel to the two frequency axes (wi and w3
)
mark the two resonances of the 4-sheet in6-8 Comparison of DVE spectra measured and reconstructed from 2D IR spectra. (a) DVE difference spectra obtained from the T-jump at T =
63 0 C. Each spectrum is divided by the maximum of the reference DVE
spectrum. (b) DVE difference spectra constructed from the absolute value square of the projection of complex 2D IR spectra onto the W3 axis. (c) Comparison of relaxation profiles constructed from the first singular value decomposition component of the v1 region (1577-1651
cm -1). . . . . 154
6-9 Relative changes in the antidiagonal width for a T-jump from Ti = 25 'C, plotted with a temperature relaxation profile normalized to the
initial change (dashed line). . . . . 156 6-10 Thermal unfolding trajectory of ubiquitin. The unfolding simulation"'
is plotted along the coordinates R1 and R, defined in the text. Protein snapshots correspond to five persistent structural regions (shown in green, red, blue, magenta, and cyan, respectively). The trajectory after a 17-ps window average is plotted in black. . . . . 159 6-11 Calculated transient 2D IR spectra of ubiquitin unfolding. Ubiquitin
2D IR spectra calculated at equilibrium (25 'C) (adapted from Ganim
et al.8), for the transient states A, B, C, D, and E, and the difference spectra relative to A (B-A, C-A, D-A, and E-A). The trends in vj frequency and intensity and in vR intensity were obtained from wi =
1640 cm-1 and wi = 1662 cm-1 slices, respectively. . . . . 160 6-12 Doorway modes of the transient ubiquitin unfolding states. Doorway
modes (calculated as described previously12) for selected regions of the v1 and vil bands. . . . . 161
7-1 Examples of protein oligomer complexes displaying shape complemen-tary and symmetry. Reproduced from Goodsell and Olson. . . . . . 168 7-2 Schematic of a thermodynamic cycle used for calculating free energy
14
7-3 Prediction accuracy results of the CAPRI challenge. . . . .1
7-4 Example free energy surfaces for protein dimerization. Insulin monomer and dimer structures are shown as illustrative examples rather than constraints or specific predictions. . . . . 169 7-5 Structural visualizations of insulin dimer and monomer models.
Strucutral models from PDB IDs 4INS (a,b), 2JV1(c), and 1JCO (d). Structures visualized using VMD15 and POV-Ray. . . . . 173
8-1 Structural visualizations of insulin dimer and monomer models. Strucutral models from PDB IDs 41NS (a,b), 2JV1(c), and 1JCO (d). Structures visualized using VMD15 and POV-Ray. . . . . 177 8-2 Concentration-dependent Insulin ZZYY 2D IR spectra and difference
spectra. Concentration-dependent ZZYY 2D JR spectra and difference spectra acquired in 0.27 M DCl 20% (v/v) EtOD-D20. Top: absorptive spectra; bottom: NRPS. All contours are plotted in 8.3% intervals. Slices along the diagonal (wi = w3) are plotted above each spectrum,
except for panel A and B, where the slices chosen to coincide with the
peak maximum (wi + A = w3). . . . . 180
8-3 Measurement of the insulin dimer dissociation constant, KD.
Extrac-tion of dimer fracExtrac-tion from FTIR and 2D IR rephasing power spectra (RPS). Representative RPS spectra, and the FTIR series and 2nd SVD component are shown on top. Concentration-normalized off-diagonal integration of 2D IR spectra and second component SVD amplitudes of FTIR spectra were fit to the dimer fraction to extract KD (bottom). 182 8-4 Temperature-dependent Insulin ZZYY 2D IR Spectra. ZZYY spectra
were acquired for 1.7 mM insulin concentration in 0.27 M DCl, 0.1 M NaCl 20% EtOD-D20. All spectra show contours plotted in 8.3% intervals. . . . . 183
8-5 Temperature-dependent HDVE spectra were acquired as a function of
ethanol co-solvent concentration. Spectra were acquired in 2.5 'C in-tervals from 10-55 'C. Representative spectra and 2nd SVD component are shown in panel A for 30% EtOD. Extracted melting temperatures and amplitudes of the second SVD are shown in B and C. . . . . 185 8-6 Extracted parameters for the two-state insulin dimer dissociation model. 186
8-7 Temperature-dependent HDVE series showing the aggregate peak used to exclude spectra from two-state fitting. . . . . 187 8-8 Solvent-dependent HDVE spectra. The HDVE spectra are shown for
25'C with reconstructed spectra using a two-state basis derived from 0.27 M DCl, D20:20% EtOD + 100 mM NaCl. The fit residuals are
indicative of experimental irreproducibility, such as shifts in the spec-trum of the laser or variations in scattering. . . . . 189 8-9 Simulated 2D IR spectra for insulin monomers and dimers. Simulated
2D IR spectra for dimers (4INS), compact monomers (1JCO) and
ex-tended B-chain monomers (2JV1). The intensity at 1620 cm- includes an exaggerated contribution from proline. Structures visualized using VMD" and POV-Ray. . . . . 190 8-10 Bright state analysis and calculated FT IR spectra. Top: plot of the
mode composition from bright state analysis decomposed by secondary structure, and the calculated IR absorption spectrum for the (a) dimer,
(b) compact monomer, and (c) extended monomer ensembles. For the
mode decomposition, the independent axis gives the beginning of the
5 cm-1 window. Below: Visualizations of the bright states for
rep-resentative spectral regions, prepared using PyMol. (Delano Scientific) The color (red or blue) represents the vibrational phase of backbone amide I oscillators, while the intensity of color reflects the amplitude of vibration. For each bright state, the vibrational amplitudes were normalized to the large magnitude value. . . . . 198
8-11 Insulin melting and dissociation curves. Melting and dissociation curves in all tested solvents along with two-state model fits, shown in Figure 8-6. The total insulin concentration was 1.7 mM and all solvents included 0.27 M DCl. HDVE experiments were repeated 3-7 times in each solvent, and the sets of spectra chosen for analysis had the
least aggregation. For solvents that caused persistent aggregatation, aggregate spectra (points indicated with an X) were excluded from the fit (see Figure 8-7). . . . . 205
9-1 N-hydroxysuccinimide ester Texas Red reacts with primary amines to form a very stable amide bond. . . . . 213
9-2 A digital camera photograph of the Texas Red-labeled insulin (dark,
purple) and free dye bands (light, pink). . . . . 214
9-3 Diagram of the primary amines in the insulin dimer crystal structure,16 with Texas Red conjugated to one of the N-termini, drawn to scale. . 215 9-4 Insulin, Free Dye, and Dye-Labeled Insulin Absorption and
Fluores-cence Spectra. Normalized absorption and fluoresFluores-cence spectra for all
NHS dyes used for labeling. Malachite green is a nonfluorescent dye. All solutes were optically dilute (OD < 0.5) in water. Fluorescence
spectra were collected with excitation at 532 nm. . . . . 218 9-5 Characterizing aliquots from the column-separated TR-ins synthesis
using UV and visible absorption. The absorption at 593 nm arises from Texas Red chromophores, which may be covalently bound to insulin. The absorption at 280 nm arises from insulin, Texas Red, and possibly also the NHS leaving group. . . . . 219 9-6 Concentration-dependent fluorescence decays of Texas Red-Labeled
In-su lin . . . . 220
9-8 Temperature-dependent fluorescence spectra of TR-insulin. Dimer
dis-sociation is observed in acidic conditions as an increase in fluorescence due to the loss of quenching. At pH 8.1, where dissociation is strongly inhibited, a much smaller increase is seen. . . . . 224
9-9 Sensitivity to the dimer fraction as a function of concentration and
labeling efficiency for KD= 100 uM. . . . . 226
9-10 Diagram of the six pheynalanine and eight tyrosine residues in the
insulin dimer crystal structure.16 . . . . 228 9-11 Absorption and emission spectra of phenylalanine and tyrosine.
Adapted from Lakowicz et al.1 7 . . . . 229
9-12 Experimental scheme for tyrosine fluorescence experiments. Li (BK7, f=15 cm), BBO 1-3 (0-BaB204), WP (quartz waveplate 14 A at 400
nm, 6.5 A at 800 nm, 0.584 mm), M (silver mirror), CM (curved alu-minum mirror, r=40 cm), PR (fused silica, 1 cm), PIN (Thor Labs
DET210 High Speed Silicon Detector), L2 (fused silica f=7.5 cm), L3
(fused silica, f=7.5 cm), S (brass sample cell), FIL (UG 11 Schott Glass Filter), ASD (Electro-Optics Technology ET 2030A 1.2 GHz amplified silicon photodetector) . . . . 230
9-13 Insulin and tyrosine fluorescence. . . . . 232
9-14 Temperature-dependent intrinsic insulin fluorescence. . . . . 233 B-1 Texas Red-Insulin HPLC Log . . . . 244 B-2 UV-Vis assay of the LC/MS separation, and demarcation of the fractions. 245 B-3 Mass Spec for Fraction 8 . . . . 246 B-4 Mass Spec for Fraction 8, expanded . . . . 247 B-5 Mass Spec for Fraction 9 . . . . 248 B-6 Mass Spec for Fraction 10 . . . . 249
B-7 Mass Spec for Fraction 13 . . . . 250
B-8 Mass Spec for Fraction 14 . . . . 251
List of Tables
2.1 Six level system parameters. Parameters for the six-level system are explained in Chapter 2, Section 2.2. The code to calculate the 2D IR spectra appears in Appendix A . . . . 57 2.2 Peak positions for the 1635 cm-1 fundamental mode in the ZZZZ
spec-tra of Fig. 1-8. Specspec-tra are defined in Equations 1.18. . . . . 61
3.1 Tensor components of the orientational response. . . . . 73 3.2 Numerical parameters for six-level system model of NMA-d7 in D20.
Values in parentheses indicate those expected from harmonic scaling. 80
3.3 Amide I'-II' Modeling Parameters. . . . . 88
4.1 Site Energy Models and Fluctuation Statistics for Trpzip2. Listing of site energy models tested, comparison of electrostatic property corre-lated, site correcorre-lated, nomenclature, and fluctuation statistics for Tr-pzip2.
(w)
is the average site frequency, which is broken down tocontri-butions from water, backbone, and sidechain respectively in (6 wWater),
(6Wacibone), and (6 WSidechain). (o) is the average site standard devia-tion. All quantities are in cm --1. . . . . 115 8.1 Measures of Insulin Dimerization KD . . . . . . . . .. . .. . . 206 9.1 Availability of Primary Amines in Insulin as a Function of pH, and
half lives for NHS-ester hydrolysis.'s 20. N terminus pKa was taken to
Chapter 1
Introduction
Proteins are the nanoscopic automatons that direct every process that we associate with life. Proteins control our growth and reproduction by carefully unraveling our genome, faithfully duplicating every base in the two meter length of our DNA, and then repackaging it.1 Proteins break down our food into the tiniest usable blocks, extract its energy, and use the pieces to construct sophisticated devices like lungs and eyeballs and more proteins. Proteins drive the thunderstorm of electrical currents responsible for memory and thought, they patiently capture photons one at a time to allow for vision, and synthesize the hormones and other chemicals that guide our personalities; they synthesize the adrenaline, oxytocin, and seratonin that help us rise to action, bond with people, and relax. It's not much of an exaggeration to say that every biochemical bond in the body that is formed or broken has a protein's fingerprints on it.
Proteins perform a vast array of functions, and we know that each can be de-composed into a nested application of chemical forces acting on short distances and fast time scales. Thus, proteins act as gears in a transmission device that couples the world of pairwise molecular interactions acting on Angstrom distances and fem-tosecond time scales into a universe of emergent synthetic and regulatory changes appearing on pm-m distances and ms-min time scales. What is the best way to
un-'DNA fully stretched is ~ 107 the length of DNA polymerase. A similar scaling of length scales
derstand the functions of proteins? Because atomistic structure elucidation methods such as x-ray crystallography and NMR have been the traditional workhorses for molecular biophysics, it is unsurprising that these methods have driven the major ad-vances in our understanding of protein function. However, the increasing availability of atomistic models has not been accompanied by growing confidence in the ability to intuit biochemical mechanisms from the inspection of static protein structures. Universal application of the biological dogma that "form determines function" has not been feasible because protein functions often arise as a result of a competition between weak, non-covalent interactions that are difficult to predict based on the
structure and are not amenable to localized descriptions.
Every functional motion of a protein is inextricably linked to conformational dy-namics. Thus, an alternative route towards understanding protein function is to complement structural studies with dynamics experiments aimed at elucidating a time-resolved view of the order of events. The ultimate goal of these dynamics ex-periments is to characterize the free energy surface, which is a model that encapsu-lates dynamical information, thermodynamics, and probable reaction pathways. In this thesis, there is an emphasis on protein folding because the associated molecu-lar forces and search problems are ubiquitous elements; the same physical principles underlie phenomena such as allostery, cooperativity, fibrilization, and assembly. The tools required to probe these events require considerations of disorder, collective co-ordinates, and multidimensional reaction surfaces. One outstanding problem that highlights many of the challenges in understanding protein functions is the biophysics of protein-protein interactions. For flexible proteins that undergo a conformational change upon binding, this process is intimately related to the folding problem. A wide variety of length and time scales are juxtaposed in the process of diffusing sev-eral intermolecular lengths, recognizing a binding partner, and refolding. Chapter 7 provides a detailed introduction to the questions that arise in protein-protein binding and the framework for designing dynamics experiments aimed at protein association.
1.1
Dynamics Experiments
Ultimately, this thesis is concerned with developing dynamics experiments that can be used to study the biophysics of protein folding and binding. Most of our insight into protein folding and binding is indirectly obtained through kinetics experiments that measure reaction rates and reveal how fast populations of stable states interconvert. In contrast, a dynamics experiment reveals evolution along a reaction coordinate; this type of experiment is challenging because most biophysical processes are encumbered
by activation barriers that obscure the fleeting motion along reaction coordinates
rel-ative to the many failed attempts to cross reaction barriers (non-reactive dynamics). Furthermore, in equilibrium bulk experiments these brief barrier-crossing events are unsynchronized, and cannot be observed in a time-dependent fashion.
These considerations detail the needs for a dynamics experiment, which are illus-trated using the reaction shown in Figure 1-1a. Figure 1-lb and c show two associated free energy surface with obligatory, two-dimensional reaction coordinates. While no one-dimensional reaction coordinate fully describes the pathway from reactant to product, the spectroscopic coordinate in Fig. 1-lb allows for a continuous description of the changes from reactant, through the transition state, to the product; this is not so in Fig. 1-1c because the reactant well overshadows the product well when only the spectroscopic coordinate is observed.
Figure 1-id shows a schematic of the spectral changes that would be observed if a barrier-free reaction was initiated on the surface in Fig. 1-lb and probed with suf-ficiently fast time-resolution. Because no barriers are encountered to desynchronize the reaction, the barrier-free timescale, A-- is revealed. Further, because the spectro-scopic coordinate projects favorably upon the pathway from reactant to product, the time-dependent frequency characterizes the structural changes. If the spectroscopic
coordinate does not distinguish continuous changes along the reaction pathway, or if thermally activated barrier crossing is initiated a kinetics experiment such as shown in Fig. 1-le is still possible that measures the overall conversation rate, k7 without structural information.
a
Reactant
kr
Product
iEa/RT
k
=Ae
a)
Uk. Iamb 0 0 (U) Ia. Uk. U)a)
*k.C
Spectroscopic Coordinate
e
WReactant WProduct WReactant WProduct
Frequency
Frequency
Figure 1-1: Illustration of considerations for a dynamics experiment. (a) A folding reaction with two structurally distinct equilibrium states that is characterized by the rates kf and kr. (b) A spectroscopic coordinate that distinguishes between the re-actant (R), product (P), and transition state (TS) with a dividing line on the free energy surface. (c) A free energy surface where the product well and transition state are not separable from the reactant without inclusion of an unobservable, dark coor-dinate. (d) A schematic of a dynamics experiment that directly reveals time-resolved structural changes and the barrier-free rate. (c) Time-resolved populations observed in a kinetics experiment that measure the overall rate, kf, and require additional assumptions to reveal dynamical information.
The requirements of structural sensitivity and time-resolution can come into con-flict; since spectroscopy typically infers structure using energy gaps, temporal and spatial resolution are effectively conjugate variables, and a compromise between both is required. Without structural resolution, product and reactant are indistinct. As
Spectroscopic Coordinate
d
7\r
(:fy
temporal resolution is reduced, only the average structure is characterized.
local motions
secondat
a-helix form
add a residue to helix
ation fl-turn formation
tetaystructure
protein rotation collapse / molten globule
p_ _q helices__acking solvation T - 1 -6 -4 -2
10
10
10
10
10
10
sec rapid mixing temperature jump NMR lineshapeOptical, Infrared, X-ray 2D NMR
Figure 1-2: Overview of time scales for protein dynamics and kinetics and directly accessible time scales by experiments.
In summary, there are three requirements for a successful dynamics experiment of the type described above:
1. Temporal Resolution The time resolution of the probe must be faster than
the dynamics of interest. Figure 1-2 shows the time scales for a variety of biomolecular motions. There is an approximate inverse relation between the length-scale for the structural rearrangement and its rate; the time scales range from fast motions correlated only among a handful of atoms to slow motions for global structural changes; biophysically relevant conformational changes include short-range fluctuations of protein side-chains, torsions, and hydrogen bonds (~ 10-4-10-11 s); protein reorientation, chain diffusion, nucleation and folding
of secondary structure (~ 10-9- - 10-6 s); domain folding and tertiary contact
formation (- 10-6 s); and folding, binding or aggregation kinetics through
activated barrier crossing (> 10-3 s). From investigations for a protein folding "speed limit," there is evidence that a time resolution of 1 ps or shorter is required, which is set by the diffusion-limited passage time across protein folding transition states.21-25
2. Structural Resolution Protein folding and binding dynamics can occur over
several disparate coordinates including solvation, reorientation, secondary struc-ture formation (a helices, 3 turns and sheets), hydrophobic association of side chains, and spatial diffusion. Each coordinate probed in a dynamics experiment reveals a projection of the reaction coordinate, and while a full characteriza-tion requires a complement of tools, consideracharacteriza-tion must be given to the trade-off between spatial and temporal resolution. Multidimensional NMR provides atomic level structures, but its utility for following folding is restricted to long times.26,27 As the motionally narrowed limit is approached, the ability to extract fast kinetics becomes dependent upon modeling assumptions. Time-resolved x-ray diffraction probes atomic-level structural changes in crystals,28,29 and has been applied to proteins in solution with only coarse structural information.30,31
IR absorption,32,33 Raman,34,35 and UV circular dichroism3 ,37 have been used with success to reveal the rates of folding and unfolding processes on picosecond to millisecond time scales, but these methods are challenged by ambiguous re-lations between observables and folding coordinates. Single-molecule methods offer unparalleled sensitivity to heterogeneity, but have historically been limited to ~~ms time resolution and coarse structural information from fluorescence.38,39 While the time resolution of single-molecule experiments is improving,39 poor structural resolution and difficulty sampling rare events continue to limit their dynamical information content.
3. Rapid Reaction Initiation Because the flux of proteins undergoing
equilib-rium bulk experiments, rapid initiation techniques are required to observe the fastest biomolecular motions. Microfluidic rapid mixing devices offer a versatil-ity of possible denaturants, but are only capable of 10 ps time resolution.40 4 1 The fastest, generally applicable technique has been unfolding with a laser-excited temperature jump. In these experiments, the solvent is rapidly heated via absorption of an optical dye42 or by direct excitation of water in the in-frared. For the latter, nanosecond temperature jumps (~z.10-20 K) are routinely reported21,'4 , and changes as fast as 3-100 ps have also been observed.4445
Shorter time scales are yet possible, although non-thermal distributions46 are created once the pulse length is shorter than the ~10 ps thermalization timescale of water. Sufficient time-resolution to observe protein folding speed limits has also been reported using a 0.7 pus pressure jump.47
1.2
Thesis Outline
Two-dimensional infrared spectroscopy (2D IR) is the central tool developed in this thesis to meet the challenges addressed above for protein dynamics experiments due to its combination of time and structural resolution. The year this research began, a feature article was published by our group highlighting the ability of 2D IR to characterize the potential energy surface and transition dipoles for a system of two coupled oscillators, Rh(CO) 2C5H702.5 This thesis chronicles a transition in the use
of 2D IR from studying few-atom systems to dynamics experiments on proteins, macromolecules with so many degrees of freedom that vibrational spectroscopy is often considered ambiguous.
The experimental and calculation tools required to probe protein conformational dynamics were formulated to treat the folding of trpzip2 and ubiquitin, and are de-scribed in Chapters 2-6. The technical challenges associated with performing third-order infrared spectroscopy on proteins are discussed in Chapter 2, and system-specific details appear in Chapters 5, 6, and 8. Chapter 5 examines structural heterogeneity in the -hairpin trpzip2. These experiments and modeling provided evidence for two
turn geometries, which argues against the consensus that the native state of trpzip2 consists of one well-ordered structure. In Chapter 6, transient temperature-jump 2D IR was used as a probe of the unfolding dynamics of ubiquitin. Time-resolved struc-tural changes manifested as a frequency blue-shift were compared against transient
2D IR calculations to interpret the unfolding mechanism as a sequential loss of strands
in the 0-sheet.
One general problem was repeatedly addressed in this thesis: how can 2D IR spectra best be modeled to reveal atomistic structural information? The key fea-ture that now sets 2D IR apart from other fast protein probes is that the data can readily be calculated from an atomistic structure or molecular dynamics simulation using the methods developed in this thesis work. The theoretical background for these calculations is described in Chapter 3, and applications are presented for the amide I-II spectroscopy of NMA (Chapter 3); the amide I'-II' spectroscopy of poly-L-lysine (Chapter 3); the D-Arg peptide (Chapter 4), trpzip2 (Chapter 4 and 5); ubiquitin (Chapter 4 and 6); and insulin monomers and dimers (Chapter 8). These applications demonstrate the entire range of currently available theoretical models for 2D IR spectra ranging from phenomenological (Chapter 3) descriptions; models suited for idealized, periodic systems (Chapter 3); calculations that reach the limit of currently available numerical accuracy (Chapter 5); the calculation of transient
2D IR spectra (Chapter 6); and approximations for calculating the 2D IR spectra of
larger protein systems (Chapter 8). In addition to calculating 2D IR spectra, these simulations can be used to examine the vibrational mode composition (Chapter 8), directly learn about solvation (Chapter 4 and 5), and characterize unfolding mech-anisms (Chapter 6). The emerging paradigm is to interpret 2D JR spectra with the aid of an atomistic, molecular dynamics simulation.
Chapters 7-9 describe the application of these tools to study protein binding. The monomer-dimer transition of insulin was first considered as a model system for the biophysics of coupled folding and binding in this work. It was chosen for our first protein dissociation dynamics experiments because it displays the coupling between binding and folding that has been described as the major challenge for models of
protein-protein interactions. Moreover, it is a small (51 amino acid) protein that diffuses across average intermolecular separations during time scales that are relevant to structural changes, and is amenable to molecular dynamics simulations. While
2D IR spectroscopy has undergone rapid maturing, there are no formulaic tools for
interpreting the data, and each experiment inspires new ways to visualize and model the data. Chapter 7 presents an introduction of the biophysics of protein binding and folding, a critical review of the currently used tools, and a framework for de-signing dynamics experiments aimed at protein association. Chapter 8 describes the monomer-dimer equilibrium of insulin, and how it can be tuned with by the protein concentration, temperature, and solvent studied using 2D IR, related nonlinear spec-troscopies, and molecular dynamics simulations. As a complement to the structural information provided by 2D IR, Chapter 9 describes dye-labeling and intrinsic tyro-sine fluorescence experiments on insulin that provide a more coarse-grained sensitivity to the monomer-dimer equilibrium.
1.3
Introduction to Two-Dimensional
Infrared
Spectroscopy
Two-dimensional infrared spectroscopy is one of a rapidly expanding class of new ultrafast coherent vibrational spectroscopies48-55 that are finding broad use in stud-ies of molecular structure and dynamics that probe peptides,56 proteins,1-3,5 7 DNA,58 chemical exchange kinetics,5960 ' hydrogen bonding, 6,62 and rapidly initiated chemical reactions.63-65 Inspired by pulsed NMR techniques, 2D IR spreads a vibrational spec-trum over two frequency axes to reveal vibrational couplings through cross peaks. A
2D IR spectrum correlates the frequency of vibrational excitation wi (referred to by others as w or wp,,p) with the frequency of detection w3 (or wt or Wprobe). Diagonal
peaks can be assigned to chemically distinct normal vibrational modes or eigenstates. The presence and splitting of cross peaks characterizes the anharmonic couplings between vibrations. Connectivity, distance, or orientation between chemical bonds