Advancing Lean Implementation for Next Generation Biomanufacturing Operations By
Joshua David Jensen
B.S. Mechanical Engineering, Iowa State University, 2010
Submitted to the MIT Sloan School of Management and the Department of Mechanical Engineering in Partial Fulfillment of the Requirements for the Degrees of
Master of Business Administration And
Master of Science in Mechanical Engineering
ARCHIVES
In conjunction with the Leaders for Global Operations Program at the
ov
ECMassachusetts Institute of Technology
JUN
June 2016@2016 Joshua David Jensen. All rights reserved. LIBF
The author hereby grants MIT permission to reproduce and to distribute publicly copies of this thesis document in whole or in part in any medi known or hereafter created.
MHNOLOGY
08 2016
ARIES
Signature of Author Certified bySignature redacted
MIT Sloan School of Manag epartment of Mechanical Engineering
A May 6, 2016
Signature redacted
I I
Dr. Scott Keating Thesis
Pupervisor,
Senior Lecturer in AccountingCertified by
Signature redacted
Dr. Jung-Hoon Chun Toesis Supervispr, Professor in Mechanical Engineering Accepted by
Accepted by
Signature redacted
Maura Herson Director of MBA Program MIT Sloan School of Management
________________
Signature redacted
Dr. Ro4n Abeyaratne Chair of the Graduate Program Committee, Professor of Mechanical Engineering
Advancing Lean Implementation for Next Generation Biomanufacturing Operations By
Joshua David Jensen
Submitted to the MIT Sloan School of Management and the Department of Mechanical Engineering on May 6, 2016 in partial Fulfillment of the Requirements for the Degrees of Master
of Business Administration and Master of Science in Mechanical Engineering. Abstract
Amgen Singapore Manufacturing (ASM) is a "first of its kind" commercial biomanufacturing site, incorporating myriad innovations including a full scale single-use bioreactor production model. Known internally at Amgen as Next Generation Biomanufacturing, this model will be the future of drug substance manufacturing at Amgen Inc. With the creation of Next Generation
Biomanufacturing, significant changes are required within site operations including how Lean principles and methodologies are implemented and utilized in this model. An opportunity had been identified to determine an effective Lean implementation for ASM in order to capitalize on
its full potential and set the Lean strategy for future Amgen Next Generation Biomanufacturing sites.
This thesis has two primary objectives: documenting how Lean principles are deployed within a biomanufacturing operation and investigating potential opportunities for Lean within
Next Generation Biomanufacturing. The first objective documents the methodology and results of the author's efforts in implementing Lean principles at ASM for Amgen while the second objective generates hypotheses on elements that will lead to more effective and efficient Lean
implementation for future applications of Amgen's Next Generation Biomanufacturing model. These hypotheses were developed with qualitative research conducted within Amgen Inc. through interviews and surveys with Amgen leadership and staff. The responses from these efforts were assimilated with the use of a Grounded Theory approach and three unique
hypotheses were created, summarized as: 1) Lean implementation from the start of operations, 2) Site-wide Lean implementation and 3) Technology enabled Lean implementation. Each of these hypotheses were preliminary validated through a quantitative analysis of a process
improvement that involved elements of each hypothesis.
The results from the process improvement showcased positive reinforcement from each of the hypotheses, with a quantifiable improvement of the process of over 70%. This thesis provides significant evidence on how biomanufacturing operations can improve the efficiency and efficacy of Lean implementations within to their organizations.
Thesis Supervisor: Dr. Scott Keating,
Senior Lecturer in Accounting
Thesis Supervisor: Dr. Jung-Hoon Chun,
Acknowledgements
The author would like to thank Amgen Inc. for providing the opportunity to be a part of the ramp up of Amgen Singapore Manufacturing and the experiences that came with it. He would like to specifically thank Kimball Hall for her mentorship and dedication, Matt Shields for his support and guidance and Praveen Oberai for his knowledge and willingness to help during his internship.
He would also like to thank his academic advisors at the Massachusetts Institute of Technology (MIT), Scott Keating and Jung-Hoon Chun, for their steadfast support in crafting the scope and structure of his thesis. Also from MIT, the author would like to thank the leadership and staff of the Leaders for Global Operations program along with his classmates in the program.
Finally, the author would like to thank his family and friends for their support during this transformative part of his life. Most importantly, he would like to thank his wife, Mary, for her never-ending support and guidance over the years.
Table of Contents
A b s tra c t ... 3 Acknowledgements ... 5 L is t o f F ig u re s ... 9 L is t o f T a b le s ... 1 0 G lo s s a ry o f T e rm s ... 1 1 1 .0 In tro d u c tio n ... 1 3 1.1 Problem Statement ... 1.2 Project Objectives... 1 .3 T h e s is O v e rv ie w ... 13 14 16 2.0 Review of Current State ... 172.1 The Biopharm aceutical Industry ... 17
2 .2 A m g e n In c . ... 1 8 2.3 Am gen Singapore Manufacturing ... 19
2.4 Am gen O perational Excellence & Lean Transform ation ... 20
3.0 Literature Review ... 23
3.1 History of Lean M anufacturing ... 23
3.2 Lean M anufacturing within Drug Biom anufacturing ... 24
4.0 Im plem entation of Lean at ASM ... 27
4.1 Evaluation of Current State of Operations ... 27
4.3 Development of Site Metric Plan... 31
4.4 Development of Lean Sustainment Strategy ... 34
5.0 Investigation of Future of Lean at Amgen... 37
5.1 Generation of Lean Implementation Hypothesis... 37
5.1.1 Analysis Structure and Approach... 37
5.1.2 Data Collection and Analysis... 38
5.1.3 Hypothesis Generation... 43
5.2 Hypothesis Validation through ASM Use-Case... 43
5.2.1 ASM Raw Material Release Process Overview... 43
5.2.2 Stakeholder Development ... 44
5.2.3 Root Cause Analysis ... 45
5.2.4 Solution Development ... 46
5.2.5 Key Results from R2R Process Improvement... 48
6 .0 C o n c lu s io n s ... 5 1 Appendix 1 - Amgen Stability Lean Methodologies ... 53
Appendix 2 - Raw Material Receipt Process Map ... 55
List of Figures
Figure 1 Amgen Long-term Manufacturing Plan... 13
Figure 2 Project Objectives Venn Diagram... 15
Figure 3 ASM Organizational Structure... 20
Figure 4 Amgen Lean Transformation Roadmap... 21
Figure 5 ASM Stakeholder Analysis...28
Figure 6 ASM Lean Practices Dashboard ... 29
Figure 7 Example of ASM SQDIP ... 33
Figure 8 Grounded Theory Approach...38
Figure 9 Survey Question Structure ... :...39
Figure 10 ASM Raw Material Release Overview ... 44
Figure 11 R2R Process Map ... 45
Figure 12 R2R Tool Failure Analysis Output ... 47
Figure 13 R2R Visual Management Tool... 48
List of Tables
Table 1 Open Code Sum mary... 40 Table 2 Axial Code Sum m ary... 42
Glossary of Terms
MIT - Massachusetts Institute of Technology LGO - Leaders for Global Operations Program NGB - Next Generation Biomanufacturing
FTE - Full Time Employee TPS - Toyota Production System ASM - Amgen Singapore Manufacturing
NGB - Next Generation Biomanufacturing R2R - Raw Material Release Process MAbs - Monoclonal Antibodies
OE - Operational Excellence
1.0 Introduction
The activities and efforts discussed within this thesis were completed during a seven month research internship from June 2015 to January 2016 as part of the Leaders for Global Operations (LGO) program at MIT. The internship was based at Amgen Singapore
Manufacturing (ASM), a newly built biologics facility. ASM incorporates a new production process, known internally at Amgen as Next Generation Biomanufacturing (NGB), utilizing a single-use bioreactor production model. The author was asked to support the implementation of Lean manufacturing principles in order to help the site achieve stability in its operations.
1.1 Problem Statement
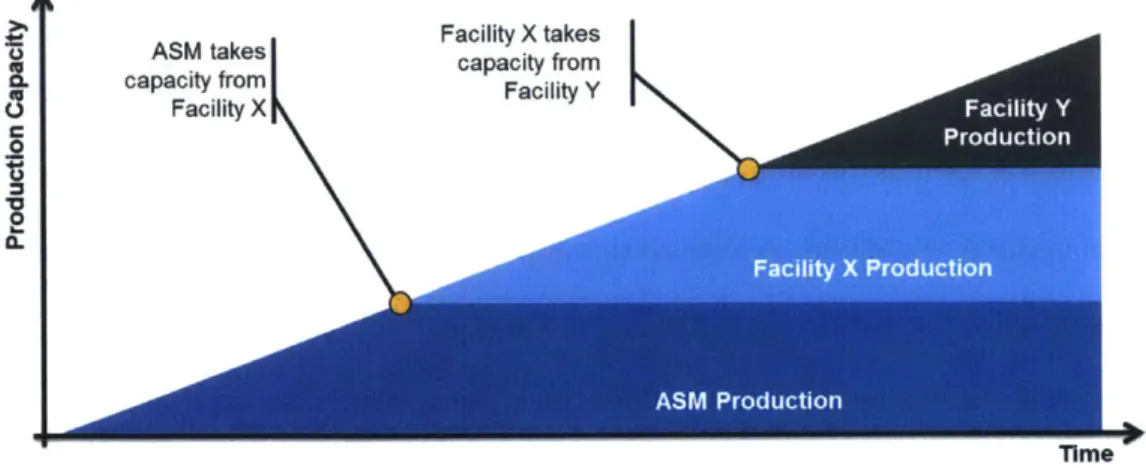
The objective behind the investment in ASM is to create a more flexible and cost effective manufacturing footprint that can respond to fluctuating customer demand and increasing operating costs. ASM is the linchpin of a broader manufacturing plan in which manufacturing capacity is transitioned from a series of facilities in order to accommodate future drug substance
manufacturing. As shown visually in Figure 1, when ASM takes capacity from Facility X,
capacity is freed up in Facility X to make room for new drug production from Facility Y and so on and so forth, a load balancing effort across facilities with varying capacity constraints.
A5M takes Facility X takes
capacity from capacity from
U Facility X
0
Time
With this objective, the company's leadership has applied pressure on ASM's management to lower both the time and cost required to stabilize operations at ASM during site ramp up. To support this stabilization, ASM has deployed initial efforts to establish Lean principles at the site, but given existing challenges, an opportunity was identified by management at ASM for the author to further support this effort. Some challenges faced by ASM are:
1. ASM is the company's first manufacturing facility based in Asia, specifically Singapore. This results in supply chain and vendor challenges and inherent isolation from the Amgen network.
2. The facility is still in the process of completing qualification runs in order to legally sell its produced drug substance.
3. The head count does not support full-time employees (FTE) focused on the Lean implementation. With the completion of the author's assignment, the Lean effort will need to be sustained from existing head count.
With full-scale production targeted for Q1 2016, ASM needs to stabilize its operations in order to meet the supply plan established for the site. The implementation of Lean throuohoit all
of ASM's operations is seen as a building block towards achieving that stability.
1.2 Project Objectives
This thesis will explore the opportunities of a Lean implementation at ASM and support the design and execution of said implementation. The results of this body of work will include short term benefits in the form of the stabilization of operations at ASM along with long term benefits
in the form of recommendations on improved methods of implementing Lean at other Amgen facilities. Specifically, the author will address the following:
1. Support stability in ASM's operations, leveraging Amgen's Corporate Lean Transformation strategy.
a) Develop competency in Lean principles at ASM through training, tool creation and process development.
b) Establish a site-level metrics plan in order to monitor and act upon plant performance results.
c) Create and implement a strategy for Lean sustainment by developing ownership in both leadership and staff.
2. Provide recommendations for modifications or additions to Amgen's Corporate Lean Transformation strategy for use in future Amgen facilities.
a) Survey Amgen's existing Lean network to identify opportunities for improved Lean implementation in the Amgen Next Generation Biomanufacturing Model.
b) Pilot initial use-cases within ASM's operations and provide conclusions on overall validity.
c) Ensure knowledge is shared and leveraged within the Global Amgen Lean network to support a cohesive strategy company-wide.
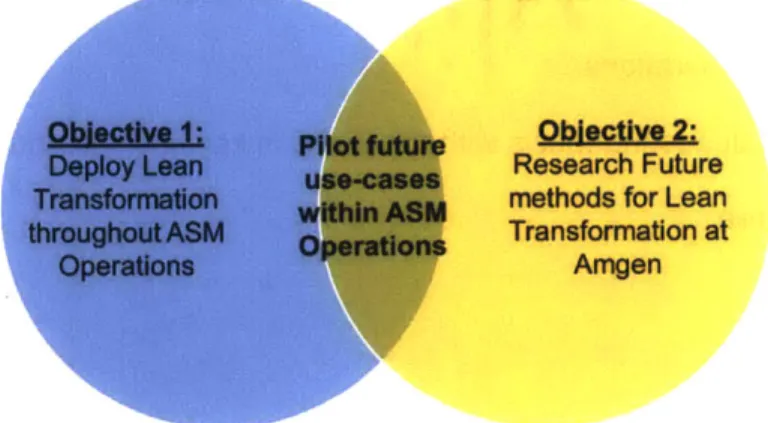
Both objectives are interlocked in the overall goal to create a more flexible and cost-effective manufacturing footprint at Amgen Inc., as shown Figure 2. The short-term efforts
conducted at ASM can be viewed as preliminary validation on the long-term recommendations proposed to Amgen's Corporate Lean Transformation Strategy.
Objective 1: Pilot future Objective 2:
Deploy Lean use-cases Research Future
Transformation within ASM methods for Lean
throughout ASM Operations Transformation at
Operations Amgen
1.3 Thesis Overview
This body of work is structured in the form of six chapters, each building upon the previous. An overview of the chapters is provided below:
1. Chapter One provides an introduction to the body of work for the thesis including the background of the project, motivation of the work and objectives for the author's efforts. This provides the structure for the thesis before significant background information is reviewed.
2. Chapter Two provides further context of the environment in which the author completed his efforts including information on the industry, company, facility and organization in which his work was completed.
3. Chapter Three completes a thorough literature review of the technical and managerial concepts utilized in examining the author's thesis and the knowledge gap the thesis seeks to fill.
4. Chapter Four describes the approach used and results found for the first objective of the thesis, supporting the stability of ASM operations, showcasing the Lean
implementation led by the author at ASM.
5. Chapter Five details the approach used and results found for the second objective of the thesis, providing recommendations on modifications or additions to Amgen's Lean
strategy, by investigating alternative methods of conducting Lean implementations within biomanufacturing operations.
6. Chapter Six concludes the thesis with the author's key findings and future efforts in each research area.
2.0 Review of Current State
2.1 The Biopharmaceutical Industry
The term biopharmaceutical (biopharma) is used to describe the segment of the pharmaceutical industry that creates drug products that are extracted from biological sources (biologics). The biopharmaceutical industry saw its emergence with the release of insulin to the market in 1923 by the University of Toronto and quickly spread throughout the world.' While the industry saw some growth during and after the World Wars, it was not until the 1970s with the creation of
monoclonal antibodies (MAbs), along with many other breakthroughs, that the real opportunity for commercialization of the industry became evident. Investments began to pour into
biotechnology companies starting with Genentech in 1976 and followed by Amgen, Biogen and Genzyme to name a few.2
During the 1980s and 1990s both technical advances and policy changes led to
exponential growth within the industry. The large, traditional pharmaceutical companies such as Eli Lilly, Roche and Pfizer began to take a greater interest in biopharma either through
investments, joint ventures or acquisitions of the smaller biotechnology companies. Other giants including Baxter and Hoechst were slow to invest in the biopharmaceutical industry and began to fall behind the smaller US and Swiss based firms. During the 2000s, the industry began to prepare for the inevitable patent cliff and started focusing investments and resources into both the drug pipeline and more importantly, operational efficiencies. In some situations, block-buster drugs that lost patent protection and were replaced by biosimilars, lost up to 80% of the original price, resulting in heavy losses to the companies' bottom lines. Biosimilars are comparable to the generics of the pharmaceutical industry; once patent protection expires on a drug,
1 Michael Bliss, The Discovery of Insulin (Toronto, Ontario: McClelland and Stewart, ci 982., 1982).
2 Ibis Senchez-Serrano, "3 - A Brief Commercial History of the Biopharmaceutical Industry up to the Year 2000*," in The World's Health Care Crisis (London: Elsevier, 2011), 47-70,
competitors can begin manufacturing drugs with a similar structure. The increasingly
competitive environment of the biopharmaceutical industry has driven a shift from a research-based focus to a board room mindset with a focus on cost cutting and improved efficiencies.3
2.2 Amgen Inc.
Applied Molecular Genetics, or more commonly known as Amgen, was founded in California in 1980 by venture capitalists William K. Bowes and associates with the focus on developing biotechnology medicines to cure orphan diseases, or rare illnesses that affect a small subset of the world's population.4 George Rathmann, a former executive at Abbott Laboratories became
the company's first CEO and is considered to be one of the most influential individuals within the industry's history. The 1980s were a period of drug development for Amgen, with its first FDA drug approval granted in 1989 for EPOGEN*, a red blood cell booster that won Product of the Year for Forbes magazine the same year.
Through the 1990s, the company expanded its product line and began entering markets overseas, resulting in incredible growth. At the same time, Amgen began expanding its
manufacturing footprint, acquiring facilities in Rhode Island and Puerto Rico. Amgen's commercial and clinical pipeline continued to grow throughout the 2000s along with the
maturing of its operations with the introduction of Lean manufacturing in 2005. In recent years, Amgen has invested heavily in single-use technologies, including the opening of the world's first commercial single-use biomanufacturing facility in Singapore in 2014 (Single-use technology is a new wave of biomanufacturing materials that replace the existing stainless steel bioreactors
3 Ibid.
4 E-CFR: Title 21: Food and Drugs, Electronic Code of Federal Regulations, vol. Title 21: Food and
Drugs, accessed February 2, 2016,
http://www.ecfr.gov/cgi-bin/retrieveECFR?gp=&SID=0e737d1 N ef9a632b19a Ie713b93cc4&mc=true&n=pt21.5.316&r=PART&ty =HTML.
with that of single-use bioreactors). Amgen's impressive journey has led to a company of over 17,000 employees and gross revenue of $20.063 billion (2014).5
2.3 Amgen Singapore Manufacturing
Amgen Singapore Manufacturing (ASM) is a manufacturing site based in the Tuas industrial section of the country of Singapore. Announced in January 2013, with an estimated construction finish date in 2016, ASM consists of two facilities: ASM-1, a next generation biologics facility utilizing a single-use bioreactor production, and ASM-2, a small-molecule production facility producing Amgen's Kyprolis*, a product for treating myeloma patients through inhibiting tumor growth. The content for the author's body of work was generated based on efforts at ASM-1 and with the broader ASM leadership team. ASM-1 began commercial qualification runs in August 2015 and commenced commercial production in January 2016.6
Organizationally, ASM-1 consists of 90 employees (as of December 2015) and is quickly growing towards its target headcount of 120. The operations in Singapore have, to date, been led by Kimball Hall, regional Vice President of Manufacturing at Amgen. Reporting to Kimball have been the plant managers, facility managers and supply chain managers for both ASM-1 and ASM-2. All quality groups, including quality control and assurance, reported outside of Singapore, to corporate groups; a standard practice within the pharmaceutical industry in order to prevent conflict of interest between manufacturing and quality. Given that the author's efforts were focused on ASM-1, he worked directly for the plant manager of ASM-1, Matt Shields.
Figure 3 summarizes the organizational structure of ASM.
5 "The Amgen Story: Celebrating 35 Years of Unlocking the Potential of Biology for Patients," The Amgen
Story: Celebrating 35 Years of Unlocking the Potential of Biology for Patients, accessed February 2,
2016, http://www.amgenhistory.com/.
6 November 20 and 2014, "Amgen Opens Next-Generation Biomanufacturing Facility in Singapore,"
FiercePharmaManufacturing, accessed February 2, 2016,
http://www.fiercepharmamanufacturing.com/press-releases/amgen-opens-next-generation-biomanufacturing-facility-singapore.
Chief Operating Officer, Amgen
Manuf uringSVP, Quality
.- - - - - - - - - - - - - s-t Head--
---I angd Plant Manager, do up Sr. Business Qualityc'it e I
ASM-1ASM-2 A i Manager Head, ASM
Josh JensenDretr ait
CItr I
- - - - - - - BasedinSingapore - - - - - - - - - -- - --- -- -- --- -I
Figure 3 ASM Organizational Structure
2.4 Amgen Operational Excellence & Lean Transformation
Since the early 2000s, Amgen as a company has been investing time and resources into
developing a corporate wide strategy on operational efficiency improvements including ventures in Lean manufacturing, Six Sigma (a data driven methodology focused on eliminating defects from a process) and hybrids of the two. Initial attempts had mild success, but ultimately failed at taking hold across the company. In the mid-2000s, the Operations Improvement team at Amgen
began developing the Amgen Process Excellence (APEX) methodology that focused on
developing Amgen specific tools and processes adopted from the Lean manufacturing mindset. The APEX program was soon adopted throughout the company and ultimately reshaped into the Operational Excellence (OE) group at Amgen.7 The OE group initially focused on
operations, but has since spread to other groups within the company.
7 Adam Daniel Villa, Lean Transformation Methodology and Implementation in Biopharmaceutical
Operations (c2008., 2008).
-The OE group at Amgen is a corporate shared resource consisting of industrial
engineers, Lean experts and Six Sigma black belts. The team is viewed as the subject matter experts (SMEs) on OE within the company and act as the governing body on developing the maturity of OE at Amgen. A major element of the OE strategy at Amgen is the pursuit of Lean implementations throughout all areas of the business of the company. The OE team is
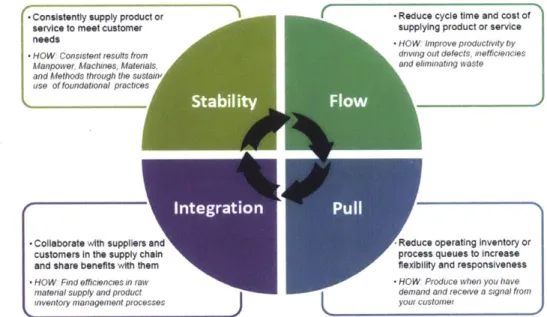
responsible for developing the roadmap for Lean at the company and acts as an assessor of the progress towards this road map. The roadmap for Lean at Amgen is viewed as a pathway for advancing Lean maturity, including four milestones: Stability, Flow, Pull, and Integration. Similar to Lean, the roadmap is not seen as a one-way journey, with the expectation that organizations may need to go backwards in order to go forwards as the organization grows. A graphical representation of this roadmap can be seen in Figure 4.
-Consistently supply product or -Reduce cycle time and cost of
service to meet customer supplying product or service
needs HOW impiove pioductyvitv by
-HOW Cosiostent reulO from d1iving out defects, Iefficlencies
Manpower. Aachines. Materials, and ehminating aaste
and Methods through the sustain use of foundational piactices
$44
-Collaborate with suppliers and Reduce operating inventory or
customers in the supply chain process queues to increase
and share benefits with them flexibility and responsiveness
-HOW Fid efficienctes in maw W HOW Produce when you have
material supply and pioduct demand and recee a signal fiotm
1nventory nianageimenit proes er Y) um iiustome!
Organizations may work on multiple phases at the same time
Figure 4 Amgen Lean Transformation Roadmap
The author's work focused primarily on the Stability phase, given that ASM had just begun ramping up operations. As seen in the figure, organizations first achieve Stability, a level of maturity in the operations that produces consistent, repeatable results. Stability is viewed as
the foundation for Lean at the company, embracing the core principles of Lean that are seen as the building blocks for the remaining levels in the roadmap.
3.0 Literature Review
3.1 History of Lean Manufacturing
Lean manufacturing has increasingly become an area of focus for large global manufacturers over the past two decades with many companies creating its own recipe for Lean within its organizations. The majority of these companies have based the recipe off of the Toyota Production System (TPS) that, within popular belief, is seen to be start of Lean manufacturing as known today. More accurately, as discussed in the book The Machine That Changed the
World, the principles of Lean were implemented within manufacturing decades before Toyota's
TPS by Henry Ford of the Ford Motor Company. Ford's mass production concept revolutionized manufacturing at the time invoking ideas of standard work and parts, built in quality and piece flow. By making both tasks and parts standardized, Ford was able to take the rather complex task of building an automobile and simplify it into a straight forward flowing process with each step building on the last. The success of Ford's mass production concept led to the rise of the American automotive industry both during and after the first two World Wars.8
By the 1950s, the American automobile industry had lost its competitive advantage due to increasing pressure from global manufacturers in Europe and Asia. Japanese manufacturers, specifically Toyota, began investigating methods of improving the efficiency of the mass
production concept while adding variety of product offerings into the mix. A young industrial engineer at Toyota, Taiichi Ohno, began to build on Ford's mass production model by seeking to add more flexibility to production by reducing the time to change over tools when switching
products. Ohno's work on stamping presses resulted in a significant reduction in tool change-over time, but, more importantly, he made the discchange-overy that parts manufactured in small batches were actually lower cost than large batches and provided earlier failure detection. This
8 James P. Womack, Daniel T. Jones, and Daniel Roos, The Machine That Changed the World: The
Story of Lean Production -- Toyota's Secret Weapon in the Global Car Wars That Is Revolutionizing
discovery led to Lean Manufacturing as it is known today as a continuous improvement process focused on eliminating wastes from the organization. Ohno compiled the following list of seven wastes which provide the context for driving operations to stability and efficiency.9
1. Waste of overproduction 2. Waste of time on hand 3. Waste of excess inventory 4. Waste of motion
5. Waste of transport 6. Waste of rework
7. Waste of over processing
As Toyota gained traction with Lean and specifically the TPS, the global market share of Toyota transformed the company from being a fraction of the size of the American automobile
manufacturers in the 1950s to being the current global market share leader. Toyota's success convinced other automotive manufacturers to invest in Lean implementations for operations and eventually rippled into other industries with manufacturing operations. By the late 1990s, Lean principles were being utilized within services including retail banking, hospitals, and even restaurants resulting in significant impact. This "new wave" of Lean manufacturing opened the door to many other industries including the sciences such as biotechnology.1 0
3.2 Lean Manufacturing within Drug Biomanufacturing
As highlighted in section 2.1, the drug biomanufacturing industry has grown and matured significantly since its technological revolution during the 1980s. During this time, companies such as Amgen, Genentech and Biogen made revolutionary developments within
9 Ibid.
10 "Next Frontiers for Lean I McKinsey & Company," accessed February 1, 2016,
biomanufacturing production such as large volume stainless steel bioreactors. However, these advances were made without thought to the overall manufacturing flow and process and resulted in a production process not optimized for efficiency, but rather efficacy." Biotech companies are not fully to blame for this direction given the infancy of the industry and extraordinary gross margins that came with it. As the industry matured, it has encountered a paradigm shift with biopharmaceutical products becoming more commoditized within the global economy with the release of biosimilars. With the on-going shift in the industry,
biopharmaceutical companies such as Amgen are looking for methods to reduce the cost of goods sold (COGS) while ensuring high quality output in order to compete with the inevitable drop in market price of the products following the release of bio-similars. Lean manufacturing is seen as an essential tool for achieving the reduction in COGS, but it has yet to be understood how to best go about implementing Lean within drug biomanufacturing operations.
1 Nigel J. Smart, Lean Biomanufacturing: Creating Value through Innovative Bioprocessing Approaches,
Woodhead Publishing Series in Biomedicine: No. 37 (Oxford; Philadelphia: Woodhead Publishing, 2013., 2013).
4.0 Implementation of Lean at ASM
Given that an existing Lean strategy was in place at Amgen, the author followed the existing methodology to create the foundation of Lean at ASM; this process and its efficacy will be covered in detail in this section. Effective Lean implementations vary immensely throughout different industries and applications, but share one common element: an effective plan. Through research conducted both internally and externally, the following plan was developed and
proposed to site leadership.12
1. Evaluation of current state of operations 2. Deployment of Lean principles
3. Development of Site metric plan
4. Development of Lean sustainment strategy
4.1 Evaluation of Current State of Operations
Coming into a new organization, it was important for the author to gain an understanding of the current state of operations at ASM in order to better understand both the scope of his efforts and the site's current level of maturity with Lean principles. In terms of scope, discussions were
held with site management to understand where Lean should be targeted throughout the organization (i.e. specific groups). Given the limited time of the assignment, the decision was made to focus only on ASM-1, the biologics facility of ASM. Within ASM-1, six groups are involved within the site operations: manufacturing, supply chain and warehouse (SC/WH), process development (PD), facilities and engineering (F&E), quality control (QC), and quality assurance (QA). To understand the connections between the groups, Amgen corporate, and the author's academic stakeholders, a stakeholder analysis was conducted to visualize these
connections; this analysis can be seen in Figure 5. The figure helps to visualize the complexity
of ASM's organization along with the various stakeholders whom were interested in form and function of the site's Lean program.
Sr. Vice Exec Vice
F&E Manager i Aresdent President, Presdnt COO Chairman, CEO Manufacturing
t
Director, Sr. Vice President
Manufacturing Plant Manager Quality
ASM 1Director. PID
Lean Director Director,
SC/WH
Josh Jensen
L GO Fellow Site Quality
Head, ASM
MIT Advisor
-Director, Legend
Quality Wa
Scott Keating ManagerI, Assurance Medium --.
MIT Advisor Quality Control A cd
Strong
Figure 5 ASM Stakeholder Analysis
ASM-1 had already conducted initial efforts for its Lean implementation, with a
preliminary Lean roll-out occurring in early 2015. This work included initial training of site staff and leadership and preliminary process development within the information cascade among the organization's levels. The author's efforts would pick-up where this initial work left off, further maturing the site's operations.
In order to quickly understand the current state for each group, interviews were
conducted with both the leadership and staff from every group. Additionally, the author attended the daily stand-up meetings (daily meeting with manager and staff in order to plan the day's activities for the group) for each group once per week. This allowed the author to gain a real understanding on how the group was performing on a daily basis. Finally, the author looked for opportunities for quick wins that could be accomplished through him personally deploying Lean principles within the groups. While the impact of the quick wins to the operations were marginal,
the act of helping the groups built trust and rapport between the author and group leadership and staff.
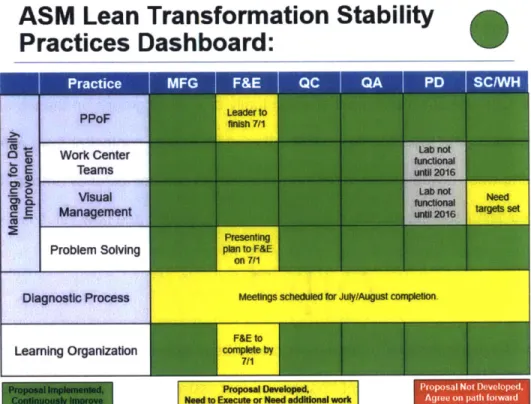
To help quantify the level of maturity in Lean across ASM-1, a Lean practices dashboard was developed to measure each group qualitatively with respect to the key Lean methodologies
defined by the corporate OE team at Amgen. These methodologies include: Diagnostic and Maturity Assessment, Managing for Daily Improvement, and Learning Organization; a detailed overview of each of these methodologies can be seen in Appendix 1. A matrix tool was
established as the maturity assessment of ASM-1 and gave a visual representation of the Lean competency of the entire site and quickly identified gaps on which to focus efforts. Figure 6 showcases a particular instance of the tool.
ASM Lean Transformation Stability
aPractices Dashboard:
m mo iTw.T -,OPP" o E C 0 PPoF Work center Teams Visual Management Problem S Diagnostic Pro Learning Organi Proposal Implemented, Continuously lmprove Leader to finish 7/11 Lab not until 201C6 Lab not functional until 2016 Need targets set Presentingolving plan to F&E
on 71
cess Meetings scheduled for July/August completion
F&E to
zation complete by
7/1
L_
_ _Proposal Developed, Need to Execute or Need additional work
Figure 6 ASM Lean Practices Dashboard
4.2 Deployment of Lean Principles
Once a current state was determined, an action plan was developed to help address gap areas. It was quickly identified that some groups were further along than others and the author's focus was distributed accordingly. Thus groups which were further along received less focus from the author. The deployment of Lean principles occurred within one of the following three methods: training, tool creation, and process development. These three methods were viewed as a
hierarchical structure in how competency was developed within staff members. Training
While some training was provided before the start of the author's efforts, it was higher level and to a broader audience. Both ex-patriate employees from the United States and local
Singaporeans spent time with the corporate OE team in the United States receiving training. This training focused more on the background of Lean and how it creates value within Amgen. The author provided specific training either individually or in small groups on the various Lean
principles. Material for the trainings was based off existing Amgen content or from external sources. Training was viewed as the initial step in building Lean competency among the staff members by providing context on how the methodology is applied and how value is extracted by using it.
Tool Creation
The author worked alongside staff members to create Lean tools specific for their work streams. Examples included visual management boards and root cause analysis tools. This was seen as the second step in the development process, with staff members beginning to deploy Lean
methodologies to change how they do their daily tasks. While initially the impact was minimal for site level performance, it had a dramatic impact on the employee's daily responsibilities and was
seen as the strongest method for building buy-in from the staff members and ultimately the long-term site performance.
Process Development
When applicable, new processes were developed in order to transform a process from its current state to the identified future state. These efforts were more involved and incorporated larger teams; an example of a process development is shown in greater detail in section 5. The effort of developing new processes was viewed as the final step in deploying Lean throughout the organization and ultimately had the largest impact in terms of stabilizing the operations at ASM given the cross-functional nature of processes being developed and improved.
4.3 Development of Site Metric Plan
A well-documented challenge for any organization implementing Lean is quantifying the actual value of Lean for the organization.13 In order to provide clarity for this challenge at ASM, the
author spent significant effort working with site leadership to define the performance metrics for each department. Given the infancy of the operations at ASM, little to no definition behind metrics was in existence at the start of the effort. That being said, Amgen as a company had significant definition from corporate on what sites should consider for metrics along with what was required by corporate for reporting.
Instead of simply replicating what was provided by corporate, a value stream approach was conducted to define key performance indicators (KPIs) for ASM. Value streams are defined as the path in which an organization creates value for its end customer. This effort consisted of defining the various value streams for each department and identifying what KPIs are essential in measuring if the value streams were successful or not. These KPIs were then further refined in order to establish leading KPIs (a data point that allows an organization to detect a failure
before it actually occurs, allowing the organization to make changes to avoid the forth coming issues) for monitoring. Finally, once a list of leading KPIs were defined, the frequency with which the metric was monitored would be defined, such as daily, weekly, or monthly. For
example, if the human resources department is monitoring attrition rate (the speed in which employees are leaving an organization), it would not make sense to review the attrition rate on a daily basis if the rate is less than one employee a month.
With metric plans created for each department, a process was then developed to provide the governance behind how the plans would be updated and monitored. For daily leading KPIs, the Lean tool SQDIP Board (Safety, Quality, Delivery, Inventory, and Productivity) was
leveraged to track performance daily. The idea of the SQDIP board was extracted from the original principles of TPS as a tool for identifying and elevating wastes within the system.14 The SQDIP Boards were managed by the department's front-line managers and provided a pulse for the operation. The SQDIP Boards were also designed to trend daily performance in an effort to help predict larger, longer term issues. An example of one of ASM's SQDIP Boards can be seen in Figure 7. As shown in the figure, the SQDIP board provides a quick, visual representation of the performance of the organization that is being measured. For example, an individual without any prior knowledge of the group's performance can easily tell that the only challenge of the group lies within inventory, given the single red box.
-
~Supply Chain-QDIP T0plateBank-v8 Sa Deivr 0__- __-s 1, c, lical w/o (1 5 -ry/ Illness = , - (Card/Week = ,I SEE Card
-DPCard /Week 1- )
3 -- 2 -3
.-equahty records past due = {> 2
Class I NC close -5 (5,
yClass 2 NC cdose I - )2
necontol date m-sed o
Delivery 1
D
ipec,-,n > 2 d.y,, 2 =- ) -a Ples,>3days - 3 = -D 5 1 t o k-u -- e g dlays- (>0= .5o OZ Feb 2016 _ ____ -ID __ ----- -~1_V
P D, d s =0nid IiFigure 7 Example of ASM SQDIP
For weekly and monthly metrics, another Lean tool, Performance Boards, were utilized. Performance Boards are a visual management tool for organizations to display KPIs in public areas in an effort to show visibility of organizational goals and provide keen focus on
improvement areas. Given the complexity of the KPIs being measured, significant effort was focused on streamlining how data was collected and analyzed for site. The motivation was to minimize the time needed to find the data and focus more time on acting upon the data. Through leveraging existing enterprise software platforms (e.g. SAP, QMS, MES), data
collection was automated for many departments resulting in reductions in time collection up to 90%. On a specific example, a weekly operations report that would be reviewed by the site's
leadership team was automated by creating a report that assimilated data from multiple systems and automatically sent an email to the plant manager for review. This report reduced the time required to build the report from roughly 45 minutes to 5 minutes.
1 2 3 4 5 6 7 3 9 W0 11 12 13 14 15 16 1 / IK I1l 20 '1 ?2 23 24 ?, 2b 21 2 8 ?9 30 31
E
--I
3 2 14.4 Development of Lean Sustainment Strategy
The final step in the deployment of Lean at ASM focused of developing the long term strategy for the sustainment of Lean at the site. This strategy would set the vision for how Lean would continue to grow and develop at ASM at the conclusion of the author's efforts. To help structure the Lean Sustainment Strategy, its elements were broken into three key areas: Strategy
Governance, Action Plan, and Lean Competency Plan. Strategy Governance:
Given that the author's role of Lean Champion would not be backfilled at the end the
assignment, a form of governance would need to be established in order to provide ownership of Lean moving forward. Through working with site leadership, the decision was made to put
ownership of Lean on the department heads and create a governing committee comprised of the site leadership in order to monitor the progress towards the site's Lean activities. The
committee would also act as a forum to ensure best practices were being transferred between the various departments. The chair of the committee would be the site's Senior Business
Manager (see Figure 3) given the individual's existing ownership of site-wide initiatives. Additionally, the Senior Business Manager could easily perform the role without biasing the
committee's actions towards one department or another. Action Plan:
Once the program governance was established, an action plan was established for the
committee to then govern. This action plan included key milestones for the site's Lean program and tied these directly to the operational goals of the site (e.g. production targets, headcount levels, and supply plans). The plan would be reviewed during each committee meeting and revised, when needed, to align with site goals.
Lean Competency Plan
The final element of ASM's Lean Sustainment Strategy was focused on the continuous development of Lean competency at ASM. As mentioned earlier, significant effort went into
providing training and project work to staff members in order to build the site's Lean competency along with obtaining staff buy-in. Given that ASM will ultimately have some level of turn-over in employees, a training program was developed to ensure new staff would be consistently trained in ASM's system of Lean. The training program echoed the deployment plan covered in section 4.2 with elements of training, individual project work, and group process development.
5.0 Investigation of Future of Lean at Amgen
5.1 Generation of Lean Implementation Hypothesis
As highlighted earlier, a conscious effort was made at Amgen Inc. to design and deploy the Lean implementation at ASM differently from past efforts. Through preliminary interviews conducted by the author with Amgen staff, the motivation to implement Lean differently was found to be stemming from past experiences with Lean implementations at Amgen. Specifically, the challenges the participants encountered with the change management involved with a Lean implementation. In order to develop a more accurate hypothesis on how Lean should be
implemented at ASM, a grounded theory approach was utilized to better understand the opinions of Amgen's Lean experts and their views on the Lean implementation at ASM.
5.1.1 Analysis Structure and Approach
In order to collect a sufficient dataset both in quantity and quality, a proper sample group was defined that would provide diverse, yet bounded responses. A criterion was established which ensured that all participants in the study would have a sufficient level of direct experience with past Lean implementations and a basic understanding of the traditional and Next Generation Biomanufacturing production models. Additionally, given the international footprint of the company, conducting in-person interviews was ruled out and an electronic survey was chosen as the medium to collect the data. To provide focus for the survey, respondents were asked to
share feedback on the four key areas that were deemed viable opportunities to integrate into the Lean implementation at ASM. These key areas include: 1) Single-use bioreactor production model, 2) Greenfield implementation of Lean, 3) Site-wide implementation of Lean and 4) Technology enabled Lean tools.
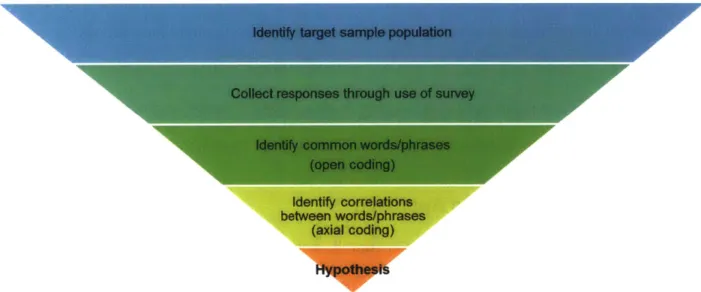
For analyzing the survey response, a grounded theory approach was used to assimilate the myriad participant responses into a single, coherent response. Grounded theory deploys a
coding approach that sifts through large amounts of text to identify key words or phrases that appear frequently in responses.15 First, open codes are identified by looking for common words and phrases within the participant's responses. These open codes are then analyzed to find underlying correlations and similarities, or axial codes. The resulting axial codes are then used to create the overarching hypothesis of the sample population. Figure 8 visually depicts the steps of grounded theory utilized by the author.
Identify target sample population
Collect responses through use of survey
Identify common words/phrases (open coding)
Identify correlations between words/phrases
(axial coding)
Hypothesis
Figure 8 Grounded Theory Approach
5.1.2 Data Collection and Analysis
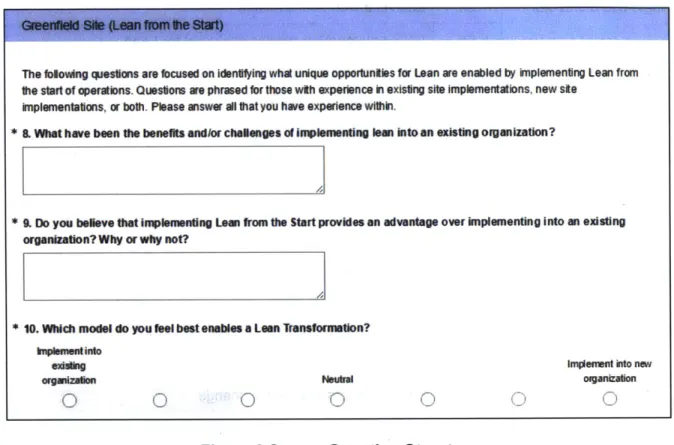
A survey was created utilizing a mix of both qualitative and quantitative responses from the participants. Although all comments would be presented anonymously, each participant was asked to provide their current position, tenure at Amgen, and experience with Lean
manufacturing principles; this helped ensure the diversity and competency of the sample group evaluated. For each key area, a qualitative question was asked in two separate ways in order to validate the permanence of the participant's response. Additionally, the participant was asked to rate the key area relative to the current state, bringing a quantitative element to the survey.
15 Kathy Charmaz, Constructing Grounded Theory: A Practical Guide through Qualitative Analysis
Figure 9 shows and example of the survey; the section focused on the Greenfield implementation of Lean.
Greenfield Site (Lean from the Start)
The following questions are focused on identifying what unique opportunities for Lean are enabled by implementing Lean fromn the start of operations. Questions are phrased for those with experience in existing site implementations. new site
implementations, or both. Please answer all that you have experience within.
* 8. What have been the benefits and/or challenges of implementing lean into an existing organization?
* 9. Do you believe that implementing Lean from the Start provides an advantage over implementing into an existing
organization? Why or why not?
* 10. Which model do you feel best enables a Lean Transformation?
Implement into
existing Implement into new
organization Neutral organization
Figure 9 Survey Question Structure
A sample group of 30 participants were targeted and 25 responses were successfully collected for the analysis over a four week period. The responses were reviewed continuously as
received in order to create initial open codes, or rather the primary elements from each
response. According to Charmaz 6, initial open coding enables the analyst to quickly assimilate key points from large masses of responses without any bias towards the end result. Table 1 summarizes the open codes created directly from the responses of the participants.
Table 1 Open Code Summary Key Area Label Open Codes
Single-use bioreactor 01 Lean is driven by the culture
02 GMP environment creates obstacles for Lean
03 Lean is the same, not matter if stainless or single-use 04 Any process is the same for Lean
05 More flexible, but principles still apply
06 No difference
07 Lean is management philosophy, doesn't matter on the process
08 Leaders have the influence, not the process
09 More pressure on suppliers of bags
010 More pressure on quality and suppliers of bags
Greenfield implementation Oi Lean is targeted in areas of lower resistance or non-compliance areas
012 Existing processes/connections can inhibit change in the organization
013 Past behaviors are hard to change
014 Baseline data helps demonstrate improvement
01s Unfamiliarity with lean creates difficulty in change
016 Engagement is difficult
017 Setting Lean behavioral expectations from the start helps the lean
implementation
Designing physical/business processes from the start minimizes waste in lean implementation
New organization prevents dealing with bad habits, building the right 019 ones from the start
020 Mature learning organization enables lean implementation
From the start implementation allows quicker integration since Lean is seen as part of business, not add-on.
022 Lean practioners trained from the start enables lean implementation
From the start implementation creates less rework and change 023 management
Focus on departments creates silo design of system
Technology enabled tools
026 Focus on departments can focus energy on specific processes
027 Focus on departments can create challenges in hand-offs and shared
processes
028 Integrated approach is key to seeing business approach due collective
effort from all departments to ensure success.
029 Integrated approach allows everyone to speak the same language (in
terms of Lean)
030 Integrated approach strengthens connections and creates alignment
throughout organization
031 Integrated approach strengthens hand-offs and shared processes, that
eliminates more waste
032 Integrated approach gets customers/suppliers to learn together, but
requires strong coaching
033 Integrated approach better helps the organization's ability to identify
issues and resolve
034 Integrated approach enables common learnings and ability to learn
from each other
035
036
Integrated approach ideally is better, but requires more bandwidth to provide adequate support in each area
Technology supports improved visual management, especially for virtual teams
07 Technology can help, but only slightly due to the importance of
03 behavioral change
038 Technology does not improve, it is a management philosophy
039 Technology is helpful, but only after a process is stable
040 Technology is helpful
041 Technology is helpful when it improves communication
042 Technology is helpful, but only after an engagement has started
043 Technology is helpful, especially for virtual teams
044 Technology is helpful in the gathering of data
045 Technology should be used when applicable of reaching your future
state
046 Technology is helpful when tracking schedules and adherence
047 Technology is helpful for repetitive and reproducible tasks
048 Technology is helpful for automation and must add real value, not
surplus value
049 Technology is helpful once the process is stable
The open codes created were then grouped together to produce overarching axial codes within each key area. Axial coding is used to take scattered open codes and begin to build a coherent categorization for the analysis.17 This was completed by identifying common words and phrases within the open codes and creating higher level categories. Table 2 summarizes the axial codes produced.
Table 2 Axial Code Summary Key Area Open Codes Axial Codes
01, 03, 04, 05, Lean is a management philosophy and its success depends on the
Single-use bioreactor 07, 08 leadership, not the process.
The implementation of Lean for a Single-use bioreactor facility puts 09, O1o a higher pressure on collaboration with suppliers/vendors.
013, 016, 018, Implementing Lean into new organizations allows you to create
Greenfield implementation 019, 020, 022, behaviors from the start and minimize change management.
023, 024
Implementing Lean into new organizations minimizes waste due to 017, 022 designing out waste from the start
Site-wide Implementation 025, 027, 028, Implementing Lean simultaneously across all departments 030, 031 strengthens connections and hand-offs between departments. 029, 032, 033, Implementing Lean simultaneously across all departments enables
034 the sharing of Best Practices and ability to learn from each other Technology enables Lean efforts through increased communication Technology enabled tools 036, 041, 043 and visibility for virtual teams
039, 042, 049 Technology only enables Lean if the process is stable
044, 045, 046, Technology enables Lean efforts through the collection and 047, 048 automation of data and/or information
5.1.3 Hypothesis Generation
From the axial codes, hypotheses are generated around each key area that was identified initially. Due to the limited scope of the author's body of work, three specific hypotheses were identified and are described below:
* Hypothesis 1: Implementing Lean into new organizations allows you create behaviors from the start and minimize change management.
* Hypothesis 2: Implementing Lean simultaneously across all departments strengthens connections and hand-offs between departments.
* Hypothesis 3: Technology enables Lean efforts by increasing communication between groups through automating data collection, analysis, and presentation.
A fourth hypothesis was identified around the area of single-use bioreactor production model, specifically its need for a stronger collaboration with vendors and suppliers. This was deemed out of scope for this thesis, but recommended for evaluation in future work.
5.2 Hypothesis Validation through ASM Use-Case
As reviewed above, three hypotheses were created around how to improve the implementation of Lean at Amgen. This section tests the validity of said hypotheses with a thorough case review of a specific process improvement implementation, incorporating elements of each of the
hypothesis. This will provide testing for each hypothesis in both qualitatively and quantitatively aspects.
5.2.1 ASM Raw Material Release Process Overview
In order to provide greater granularity of the potential impact of the stated hypotheses, a specific case review follows to showcase the operations improvement for an application at ASM: the Raw Materials Release Process (abbreviated as R2R). The ASM R2R process governs the method in which raw materials are received by ASM and qualified for use in drug substance
manufacturing. The process not only manages the quality of the materials being used at ASM, but also the speed in which materials are released for use. An Amgen corporate metric was set for all sites to achieve 90% of raw materials released within 20 days of receipt into the
enterprise material tracking database. A simple schematic of the process can be seen in Figure 10.
20 Days
Raw materials received Sample is taken and Laboratory tests
into warehouse tested at laboratory reviewed and materialsreleased for use
Figure 10 ASM Raw Material Release Overview
The decision to use the R2R process as a case review for the defined hypotheses was based on two factors. First, at the start of the author's assignment at ASM, the R2R process was found to have little standard work defined and was described anecdotally by leadership to
not be hitting its performance metrics. Thus, there was significant opportunity for improvement in the process and measurable value. Additionally, the process required a cross-departmental effort involving teams both in Singapore and the United States that would be useful in evaluating the three hypotheses.
5.2.2 Stakeholder Development
At the start the effort, information was collected to identify the key stakeholders of the process and a cross-functional team was created to oversee improvements to the process. The team consisted of representatives from each of the departments involved in the process: supply
chain/warehouse, quality control, and quality assurance. For the process to be successful the three departments would need to work closely and effectively together.
5.2.3 Root Cause Analysis
Before any solutions were considered to improve the process, significant effort was put into adequately framing the problem and determining the root cause of the issues in the process. To
help frame this effort, a current state process map was created in order to segment work streams for each department and understand where data could start being collected to identify root causes in the process. With the process segmented, performance metrics were defined in order to set expectations for the departments. A full view of the process map can be seen in Appendix 2, but a high level view can be seen in Figure 11.
20 days
3 days 15 days 2 days
Warhous Warehouse. QUAliyQlQI s
Start -- Receive into - Take sample foF--omplete testine - Review and END
Warehouse testing effort Rlease material
Figure 11 R2R Process Map
Using the process map as a guide, pain points were discussed among the key
stakeholders and the 5 Why's framework (a Lean tool in which Why is asked five times in order to determine the root cause) was used to drill these points into root causes.18 This effort
resulted in root causes being attributed to the connections, or process hand-offs, between the various departments. The current state lacked any process or tool for identifying when work shifted from one department to another, thus not only did miscommunications often occur, but each department had limited visibility to its own individual performance. Through the root cause
analysis, it was then determined that a forthcoming solution would need to provide the data analysis on the performance of each group and improve communications between departments.
5.2.4 Solution Development
With the problem adequately identified, a solution to the process was developed in order to reach the two objectives of the future state of the process: understanding individual group performance and improving communications between groups. For the first objective research was conducted to determine what data and systems currently were in place for determining the individual department performances. Additionally, it was identified that while the data did exist in many of Amgen's enterprise software platforms, not only was the dataset incomplete, but
assimilating data from the disparate platforms would be infeasible given current capabilities. It was determined that a new process for collecting and analyzing data in one safe source would be needed. Given that the stakeholders were based globally, a web-based tool would be needed so all departments could provide inputs with as much ease as possible.
Utilizing an excel platform, a tool was created that allowed users to provide input data for analysis; that data was the start and end dates for each of the departmental processes. Given that all users had access to the tool, user permissions were utilized to ensure users could only
update data for over which they had ownership. This raw data could then be analyzed and compared to the departmental targets set earlier to determine where failures were occurring and attention was needed. The analysis was outputted from the tool in the form of a Pareto analysis, as seen in Figure 12. The Pareto provides a quick view on where the process is failing, that for the month of October, shows that the Test and Release process failed to meet the set targets 100% of the time; effort would then be prioritized to focus on those two areas.
ASM R2R Failure
Pareto
-
October
120% 100% 80% 60% -40% 20% 0%Test Process Release Sample Total Visual Process
Process Process
Figure 12 R2R Tool Failure Analysis Output
The second objective of improving communication between departments during the process was seen as more proactive than the failure analysis, helping reduce failures in the process before these occur. In the current state, communication during the process was set up primarily in a push manner, with departments waiting until samples reached the work stations to plan, schedule, and ultimately, execute the processes. For the future state, a pull manner of communications was sought, where departments proactively looked at what was coming down the pipeline in order to plan and schedule the processes and simply execute once the materials
reached the work stations. To achieve this, a tool was developed to depict visually where materials fell within the R2R process and ultimately provide a full spectrum forecast to all departments. Given that the data needed for such a tool existed in the web-based excel platform developed for the first objective, the visual tool was incorporated into the existing platform. The visual tool creates color coded "cards" that move along the process as dates are
updated by the departments as seen in Figure 13. The visual tool provides a real-time source for viewing the pipeline of raw materials at ASM, easily accessible by all departments involved