ADIABATIC INSTABILITY IN THE ORTHOGONAL CUTTING OF STEEL by
Joseph Carl Lemaire
B.S.M.E. University of Denver (1970)
Submitted in Partial Fulfillment of the requirements for the degree of
MASTER OF SCIENCE at the
Massachusetts Institute of Technology June, 1971
Signature of Author Department of Metallurgy and Materials Science
Approved by Thesis Supervisor Accepted by Chairman, Departmental Committee on Graduate Students
Signature Redacted
SI ueSignature Redacted
Archives
~ss.INst-JUN
9 1971
4 I8RARESii
ADIABATIC INSTABILITY IN THE ORTHOGONAL CUTTING OF STEEL
by
Joseph Carl Lemaire
Submitted to the Department of Metallurgy and Materials Science on May 14, 1971 in partial fulfillment of the requirements for the
degree of Master of Science
ABSTRACT
Discontinuous chips of Fe-18.5Ni-.52C tempered martensitic steel were formed by orthogonal cutting at speeds from .074 ft/sec. to
.333 ft/sec. for several depths of cut using tools with rake angles of 0, 5, 10, 15, and 200. Martensite is observed to revert to austenite in a thin band along the sheared edges of the chips for speeds > 7.50 in/min. and rake angles < 15*. The existence of austenite is taken as an indication that the temperature of these bands is in excess of 4260C. It is found that only those cutting conditions which create shear-zone temperatures between 100 and 2000C facilitate the formation of austenite. Tensile tests con-ducted in the range of temperatures from 25 to 3140C reveal austenite on the fracture surface only at temperatures below 2000C. It is suggested that an adiabatic instability and sub-sequent release of elastic energy from the machine accounts for the presence of austenite bands.
Thesis Supervisor: Walter A. Backofen Title: Professor of Metallurgy
TABLE OF CONTENTS Page Number ABSTRACT --- ii LIST OF FIGURES --- iv LIST OF TABLES --- vi ACKNOWLEDGEMENTS --- vii INTRODUCTION --- 1 EXPERIMENTAL --- 4
Materials and Preparation --- 4
Machining Tests --- 6 Tension Tests --- 9 RESULTS --- 10 DISCUSSION --- 19 CONCLUSIONS --- 29 REFERENCES --- 31
APPENDIX I - Strain vs. Cutting Speed Data for Chip Types 2 and 3.--- 33
APPENDIX II - Conditions for Adiabatic Instability and Subsequent Temperature Rise Leading to Reversion.--- 42
iv
LIST OF FIGURES
Figure Page
Number Number
1 Discontinuous chip nomenclature. Dotted profile applies
to analysis for continuous chips. --- 3 2 Tempered martensitic microstructure of Fe-18.5Ni-.52C
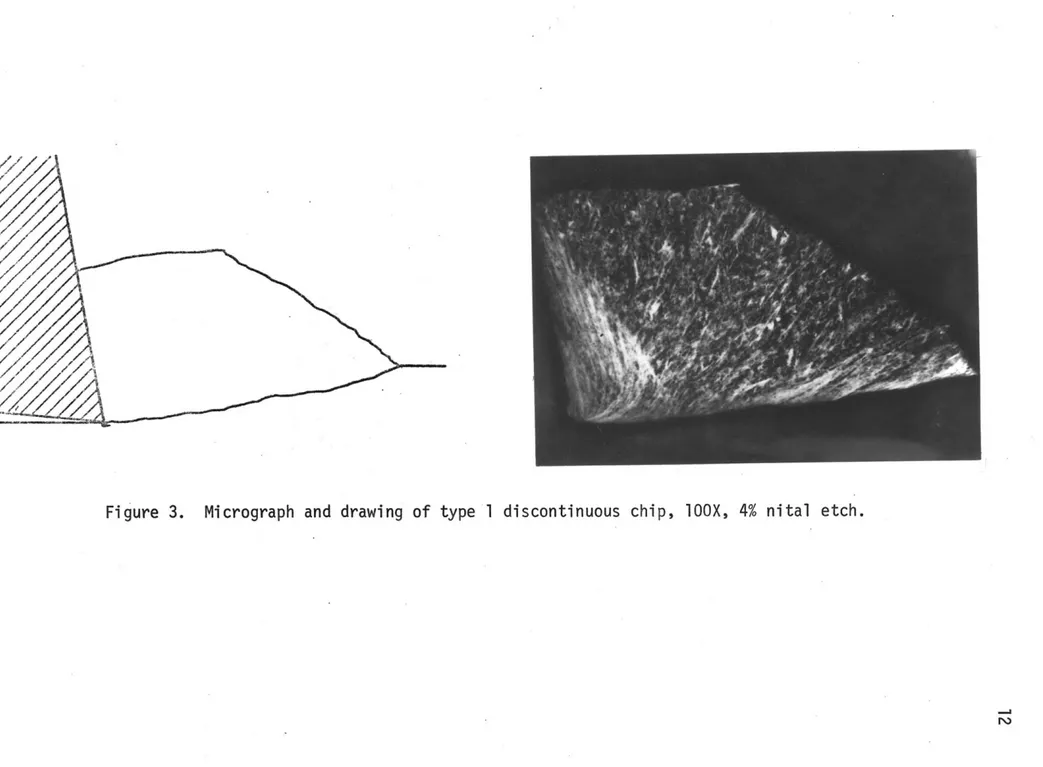
as treated, 1250X. --- 7 3 Micrograph and drawing of type 1 discontinuous chip,
10OX, 4% nital etch. --- 12 4 Micrograph and drawing of type 2 discontinuous chip,
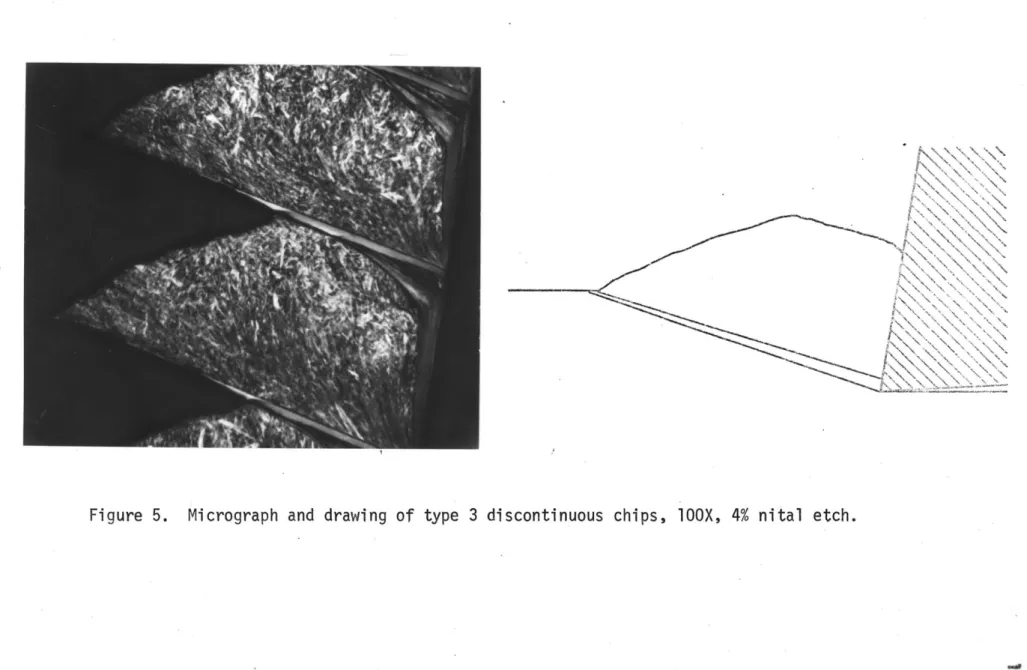
10OX, 4% nital etch. --- 13 5 Micrograph and drawing of type 3 discontinuous chips,
10OX, 4% nital etch. --- 14 6 Partially discontinuous chip with austenite bands,
10OX, 4% nital etch. --- 16 7 Typical horizontal force vs. time data for 3 chip
types from the Sanborn recorder. --- 17 8 Sketch of an oscillograph of horizontal cutting force
vs. time representing the load drop during instability and chip separation for v = 20.00 in./min., a = 50, d = .010 in. (type 3 chips). The dashed line through F0, Fi, and F2 is the envelope of free machine
vibrations. --- 18 9 Micrographs of tensile specimen sections revealing
sheared portions of (a) sample tested at 2500C, 10OX; (b) same region, 1250X, and fracture surface with austenite of (c) sample tested at room temperature,
10OX; same region, (d) 1250X. --- 20
10 Plot of 0.2% offset yield stress vs. testing
temperature for tensile specimens. --- 21
Figure Page
Number Number
I-1 Strain-cutting speed diagrams for a = 00. Dark circles are actual data; open circles and lines are calculated isotherms. Lower lines = 100*C isotherm; upper lines =
2001C isotherm. --- 38
1-2
Strain-cutting speed diagrams for ot = 50* --- 391-3 Strain-cutting speed diagrams for a = 100. --- 40
1-4 Strain-cutting speed diagrams for a = 150. --- 41
II-1 Schematic of machine-sample-dynamometer system. Dynamometer output, (a), for (b) system unloaded, (c) maximum homogeneous deformation, (d) unstable localized flow, (e) chip separation and machine vibration. --- 45
vi
LIST OF TABLES
Table Page
Number Number
1 Physical and thermal properties of Fe-18.5 Ni-.52C.--- 5 2 Machining test results according to chip type.--- 11 3 Numerical data from machining tests and calculated
values of mean stress, total strain and temperature
in shear zones of type 3 chips.--- 24 4 Machining parameters with associated measured
austenite band thicknesses, shear plane angles and
temperature.--- 28 I-1 Cutting parameters and calculated values of stress,
strain and temperature for all tests resulting in
type 2 and type 3 chips.--- 35
I
ACKNOWLEDGEMENTS
The author is grateful to Professor W.A. Backofen for his patience and guidance throughout all phases of this research.
He also wishes to express his gratitude to Professor N.H. Cook for his helpful discussions and to the members of the Materials Processing Laboratory for assistance in experimental work.
Special thanks are due to Miss Jean L. Di Mauro and to
Miss Patricia S. Murdock for aid in the final preparation of this report.
-4
ADIABATIC INSTABILITY IN THE ORTHOGONAL CUTTING OF STEEL
INTRODUCTION
The role of localized plastic flow and temperature increase dur-ing high speed deformation has been investigated for a number of
con-ventional processes in metal forming. Flow stresses in materials
are often sensitive to strain rates and are usually dependent on temperature. The existence of thermally-aided or "adiabatic" insta-bilities in plastic flow due to the interaction of strain rate, flow stress, and temperature has been suggested for a number of materials and has been observed in an aluminum alloy.(2)
Chips produced during the orthogonal cutting of metals result from high strain rate plastic flow over cutting tools. Discontinuous chips result when chip growth is interrupted by separation on a plane or curved surface ahead of the advancing tool. Field and Merchant(3) proposed that separation occurs when a rupture strain, modified by compressive stress, is achieved on a shear plane ahead of the tool. Cook and others 4 suggested that small fractures, nucleated at the tool tip, grow and cause separation when a critical shear stress is reached on the fracture surface. Further investigations by Palmer and others indicated that fracture was preceded by a concentration of shear deformation into a narrow shear zone as discontinuous chips begin sliding up the tool face.(5) The formation of serrated chips
in titanium and steel by thermally-aided instability has been suggested by Recht for high speed machining processes,(6) and temperature inter-action with stress in the shear zone has been discussed by others.(7,8)
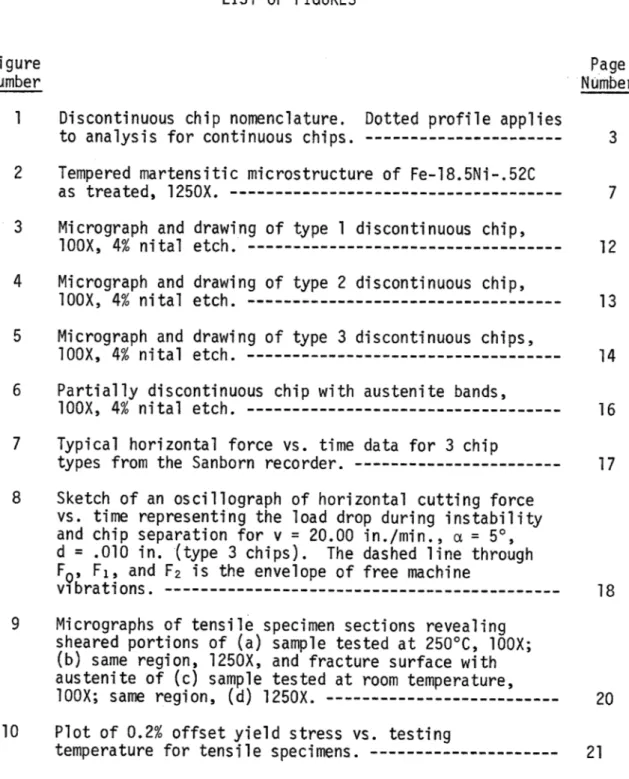
This study of the orthogonal cutting of steel was made to determine experimentally if shear localization by temperature:flow-stress inter-action was involved in the production of discontinuous chips. The orthogonal cutting nomenclature is represented in Figure 1, where a is the tool rake angle, v is the cutting speed, and d is the depth of cut. Combinations of these three parameters together with the material prop-erties determine the nature of the plastic deformation in producing discontinuous chips.
Martensite will revert to austenite if heated beyond its reversion temperature, As, which can be varied in steel by changes in composition. Reversion occurs quickly and serves as an indicator that the As temper-ature has been reached. The reverted regions remain austenitic upon cooling and are observable metallographically. Chips cut from
Fe-18.5Ni-.52C tempered martensitic steel can be expected to revert in those regions which exceed the As temperature, leaving a permanent record of the temperature increases occurring during the chip formation process.
The observation of a martensite reversion to austenite during deformation of Fe-Ni-C steels has been described under a variety of conditions, including hammering, tension and compression testing,
3 I C 0
FF
\ FvF clea rance wz width of sampleFigure 1. Discontinuous chip nomenclature. Dotted profile applies to analysis for continuous chips.
and shock hydrostatic loading. (9,10) More recent investigations have shown that reversion during heavy, rapid shearing occurs only when the material is strain-heated to its A temperature. (11) Under hydro-static pressure the As temperature can be reduced, and a reduction of 80C was achieved by increasing hydrostatic pressure on an alloy of composition Fe-24.8Ni-.50C from 1 K bar to 20 K bar. (12)
EXPERIMENTAL PROCEDURE
Materials and Preparation
An alloy of composition, Fe-18.5Ni-.52C, was obtained in the form of 1/2" diameter round stock. Ladle analysis showed only minor amounts of other constituents to be present. The physical properties of the composition and their method of calculation or source are given in Table 1. It is significant to note that all transformation temper-atures are calculated assuming that the alloying elements are totally
in solid solution in the iron. The martensite start temperature is below room temperature. The specific heat of the martensitic alloy containing retained austenite is assumed to be nearly the same as that of pure alloy martensite, for which a calculated value is shown in Table 1.
Short lengths of the 1/2" rod were heated to 9000C in a vacuum furnace over a period of one hour. The rods were quickly removed from the furnace, forged into 1/4" thick strips, and water-quenched.
5
TABLE 1
PHYSICAL AND THERMAL PROPERTIES OF Fe-18.5 Ni-.52C
Symbol
p
Value Calculation or Source
7.86 g/cc Specific Heat (100'C) Thermal Diffusivity Thermal Conductivity Martensite Start Temp. Austenite Start Temp. CK K K .1098 cal/g-cc .050 cm2/sec 4.32 x 10⁻² cal/cm-sec , 50C " 4260
C
* Specific heat for this composition was calculated according to the method used by source 11 for Fe-Ni-C steels, using data from source 13. Property Density * (11) K = KPCv ( 9) (11)
The strips were heated to 450C in an air furnace and roll-reduced in successive 10% passes to a final thickness of .100" + .005". Each reduction was followed by a brief reheating period. The strips were water-quenched after their last reduction. They were divided and
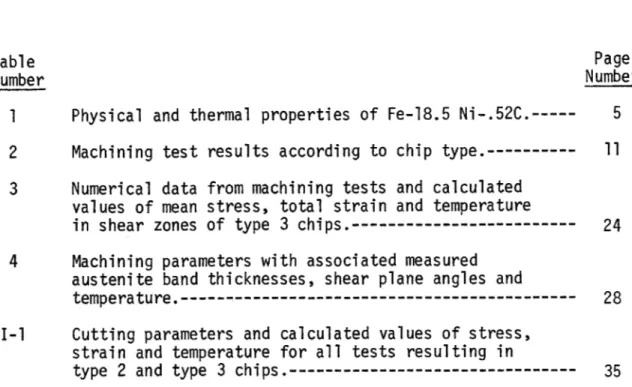
trimmed to a nominal size of 1" x 5" x .100" using a cut-off wheel. The strips were cleaned in a boiling solution of 25% H2S04 in water prior to being sealed under vacuum in vycor tubing for final heat treatment. The encapsulated strips were treated at 9000C for 24 hours and subsequently were water-quenched. The capsule was broken during the quench. The strips were placed in liquid nitrogen and allowed to remain at -1950C for 5 minutes. After gradually warming to room temperature, the strips were given a 5 second temper at 3000C by immersion in a salt pot followed by a water quench. The resulting microstructure is shown in Figure 2. Hardness tests proved uniform for all strips at R 50.
Machining Experiments
Orthogonal cutting was carried out on a converted Kearney and Trucker Model H horizontal milling machine. The arbor assembly and all rotating parts were removed from the head of the machine, and a single-point cutting tool with appropriate rake and clearance angles was fitted into a stationary mount for each test. The test strip was mounted in a vice, which was attached to the table of the milling machine through a strain gage dynamometer. The dynamometer was of
7
Figure 2. Tempered martensitic microstructure of Fe-18.5Ni-.52C as treated, 1250X.
the extended orthogonal ring type, described elsewhere, and was capable of measuring the total horizontal and vertical forces on the test strip during cutting. Cutting was achieved by automatically feeding the strip into the tool using a selected table feed rate. The depth of cut was determined by setting the height of the table.
The dynamometer output was recorded on a 2-channel Sanborn chart recorder, calibrated before usage. At the maximum chart speed the recorder could respond to changes in force which occurred in no less than 10-2 seconds. An oscilloscope, employing a battery potential across the dynamometer strain gages, was used to measure the dyna-output during brief time intervals, when necessary.
The cutting tools of high speed steel were polished on 320-grit silicon carbide papers, and a fresh cutting edge was used for each cut. Wear occurred on the face of the tool during most cuts as the
cut progressed, and the presence of a permanent built-up edge was occasionally noticed after a cut. Separate tools were available with rake angles of 0, 5, 10, 15 and 200.
Each test consisted of a single pass of the cutting tool through the material. Normally about 20 or 30 discontinuous chips would fly off during the cut. The chips were restrained by a shroud covering the tool and test sample and were collected after each test.
Variations in vertical and horizontal force were recorded as each chip was formed.
9
Tension Testing
Tension tests were conducted on round tensile specimens, prepared according to ASTM specifications for small size specimens proportional to standard size. (15) The same 1/2" rod stock was used as that for the machining strips. Prior to machining, short sections of the rod were encapsulated in evacuated vycor tubing and treated for six hours at 900*C. The samples were furnace cooled to soften them for lathe cutting. After turning and cleaning the specimens were again sealed in evacuated vycor tubing and were subsequently treated at 900C for eighteen hours. The remainder of the specimen treatment was identical to that of the machining strips. Metallography revealed that the tensile specimens and machining strips had identical microstructure, and the hardness remained at Rc 50 in the tensile specimen.
Tensile tests were conducted on an Instron machine using a 20,000 lb. tensile load cell, calibrated before each test. A cross-head speed of .020"/minute was used in all tests. A vertically mounted tube furnace with appropriate temperature controls allowed temperature adjustment within 20C, as monitored by an independent thermocouple held near the gage section of the specimen. Heat-up time was between five and ten minutes for each specimen, and the samples were removed and water quenched immediately after failure.
Tests were conducted in the range of temperatures between room temperature and 3150C.
the sample tested at 315*C, in which small carbides and the deterioration of the martensitic microstructure were noticed.
RESULTS
Under most combinations of rake angle, cutting speed and depth of cut, discontinuous chips were formed. Cuts performed at very low speeds and light depths of cut tended to produce continuous chips, particularly when high rake angle tools were used. Austenite was observed in thin, well demarcated bands along the sheared edges of discontinuous chips cut under conditions of low rake angle, higher cutting speed and depths of cut greater than .007". Not all discontinuous chips contained
austenite. A summary of cutting conditions and machinery test results is found in Table 2.
Discontinuous chips tended to fall into three categories, illus-trated in Figs. 3-5. Type 1 chips were characterized by an irregular fracture along the sheared edge of the chip. The fracture occurred from the tip or rake face of the cutting tool and extended to the free surface of the test strip ahead of the tool. No newly formed austenite is observed in type 1 chips. Type 2 chips demonstrated an irregular fracture, similar to type 1, in the lower portion of the sheared edge near the cutting tool but were distinguished by a smooth, thin band of austenite along the remainder of the sheared edge. Type 3 chips contained a band of austenite along the complete
TABLE 2
MACHINING TEST RESULTS ACCORDING TO CHIP TYPE
Rake Angle a* 0 0 50 10 0 Depth of Cut d, in. .007 .010 .012 .007 .010 .012 .007 .01 0 .012 .007 .010 .012 .007 .010 .012 150 200
Cutting Speed, in/sec
v = .333 00 00 00 00 00 .262 00 00 00 0S ow0 0 00 00o 000 000 .204 OS 0. 00 000 00 00 .162 .126 .096 0
00
OS
00
00
on
00
CM~Ose
00
OS
O00
00
00
OU
9O onOS
00 055c0m
O"S* s-OS eft --0
Type 1 Chips- OType 2 & 3 Chips S Continuous Chips - Test Not Conducted
0
AA
'~//' /4/
Figure 3. Micrograph and drawing of type 1 discontinuous chip, 10OX, 4% nital etch.
K NN
Figure ~ ~ ~
~ ~ ~ ~ ~ ~ ~ ~ ~ ~ ~ ~ ~ N 4. Mirgahaddaigo ye2dsotnosci,1O,4 i th
16
q.14 Ni7
N N ~ \ \ N N15
length of the sheared edge. The type of discontinuous chip was mostly consistent for each test and therefore fixed by the cutting conditions.
Chip separation did not always occur along an austenite band, when such bands were present. Discontinuous chips occasionally separated with irregular fractures roughly parallel to the bands and a few
ten-thousandths of an inch ahead of them. Under other cutting con-ditions partially discontinuous chips could form with complete bands of austenite and no associated fracture, as illustrated in Figure 6.
Typical dynamometer output for the three types of discontinuous chips as recorded on the Sanborn chart, is illustrated in Figure 7. All three force-time curves have the same basic shape and it is evident that separation in chip types 2 and 3 occurs at different positions along the same basic curve. It can be concluded that chip
types 2 and 3 are special cases of the general type 1, separating at earlier stages of formation than type 1 chips. The sudden dis-continuity in the Sanborn chart output is always associated with the appearance of an austenite band. The discontinuity results from the inability of the recorder to follow the load drop in the dynamometer.
Oscillographs indicate the nature of the load drop during the Sanborn discontinuities. The oscilloscope traces, represented in Figure 8, indicate that the dynamometer is completely unloaded during the separation of type 2 and type 3 chips and that damped vibrations
Partially discontinuous chip with austenite bands, 10OX, 4% nital etch.
0 (a)
0.2 . 0.4
, sec. Type 1 chips, data for s
a = 0*, d = .012".
0.8 1.0
17
1.2 ample cut at v = 5.75"min.,
0 0.2 0.4 0.6 0.8 1.0 1.
sec.
:b) Type 2 chips, data for sample cut at v = 20.00"/min.,
= 00, d = .012". -
-0
-00.2 0.4 0.6 sec. 0.8 (c) Type 3 chips, data for sample cut at v =
Ot=1009 d = .010".
1.0 1.2
15.75"/min.,
Figure 5. Typical horizontal force vs. time data for 3 chip types from the Sanborn recorder. 1000 800 60o 400 h lbs. -200 Al 1000 800
Fh
lbs. lbs. 600 400 200 0 10 00 800 600F
40 20 1 1/
/
7
I . I AM-).6 I I I IJ
\VNew chip beginst=1x1-3 tec
Sketch of an oscillograph of horizontal cutting force vs. time, representing the load drop during instability and chip separation for v = 20.00"/min.,
= 50, d = .010" (type 3 chips). The dashed line through Fo, F1, and F2 is the envelope of free machine vibrations.
18
1~ III
Unstable flow begins
Fma
Chip separation occurs
F F NF Fh
0
Figure 8. Adl-I I I I19
are established in the machine-sample-dynamometer system. Type 1 chip separation does not result in the complete unloading of the dynamometer; probably because a second chip has begun to form before the preceding chip has completely separated.
Tensile tests conducted below 200*C resulted in fracture before measurable plastic deformation occurred. Samples tested at 25, 125, and 1750C exhibited newly formed austenite on the edge of small shear lips at the outer edge of the fracture, as illustrated by micrographs in Figure 9. The majority of the fracture surface demonstrated
irregular, intergranular fracture. Samples tested at temperatures between 200 and 314C showed increased elongation to fracture and considerably larger shear ligaments. However, no reverted austenite was observed in cross sections of the fracture surface. The .2%
offset yield stress, calculated from the load-elongation output of the Instron machine, is graphed as a function of the testing temper-ature in Figure 10 for samples tested between 200 and 3140C.
DISCUSSION
The force-time curve for discontinuous chip formation has been analyzed in comparison with high speed motion pictures by several authors.(4,16) Just prior to reaching the maximum force, it is
recognized that the chip begins to slide up the face of the tool, and deformation in type 3 chips is confined to a narrow zone
(a)
(c)
(b)
(d)
Micrographs of tensile specimen sections revealing sheared portions of (a) sample tested at 250'C, lOOX; (b) same region, 1250X, and fracture surface with austenite of
(c) sample tested at room temperature, 10OX; same region, (d), 1250X.
14v,
I. I I I
0.2%
OFFSET YIELD 0 0 100 150 200 250 300T,
Yield stress vs. temperature for tensile tests on Fe-18.5Ni-.52C. 150 k KPSI 100 50 0 0 50
1
350 -I I I I a I I Fi gure 10.extending from the tip of the cutting tool to the free surface of the test strip. (5) In type 1 and type 2 chips a partial fracture has developed ahead of the tool point, and the deformation zone extends from the tip of this crack to the free surface. For type 3 chips the total shear strain experienced by an element moving through this zone can be calculated from geometric considerations,(3) and the orthogonal cutting process at this instant is analogous to that for continuous chips.
= cos a 77
sin $ sin (90* + 0 -$)
where y = total shear strain, a and $ are as defined in Figure 1. The mean shear stress within the shear zone has been analyzed for the analogous case of chip formation.(8) Referring again to
Figure 1, the mean shear stress in the shear zone, Tsz, is dependent on the shear stress on the rake face of the tool, TRF9
d T RF
sz = h sin $ cos ($+x-c - (2a)
The shear stress on the rake face during chip sliding is equivalent to the resultant cutting force, FR, divided by the contact area,
FR sin X
RF h-w (2b)
AIL-23
The parameters, a, h, and w are fixed by the experiment; $ can be cal-culated knowing a and measuring the included angle between the sheared and tool contact edges of the chip. The friction angle, X, can be calculated from the vertical and horizontal components of the resultant cutting force, provided by the dynamometer data;
X = tan F tan
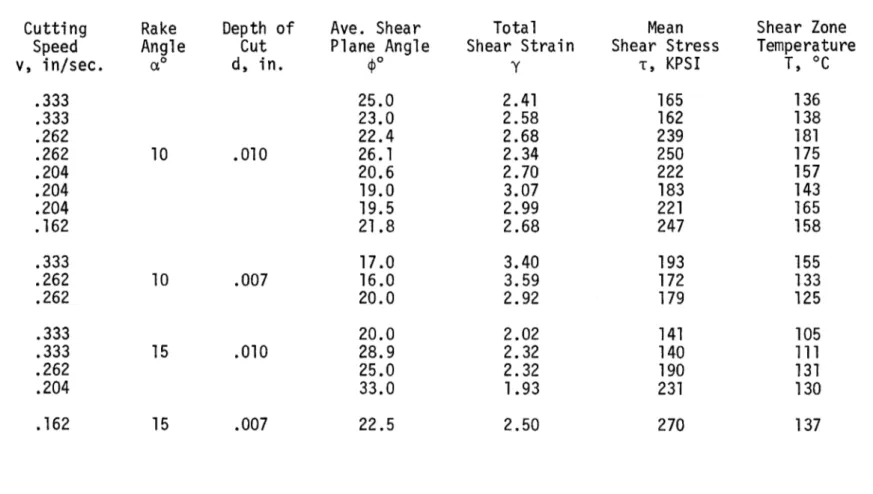
The mean shear stress and the total shear strain are calculated for tests resulting in type 3 chips, and the values are indicated in Table 3. Type 2 chips may be treated by the same analysis under
certain circumstances, and a more thorough discussion of the machining results is presented in Appendix 1.
Shear zone temperatures have been calculated by a number of
authors, (17,18) and it is known that the temperature is dependent on
the amount of deformation work, the thermal and physical properties of the material, and the cutting speed. Large temperature increases in the shear zone are not typical during machinery at the range of cutting speeds used in these experiments. A suitable temperature analysis for the analogous case of continuous chip machinery is presented in source 18. The temperature obtainable in the shear zone, Tszis predicted,
.NL-Ave. Shear Plane Angle TO 16.6 16.0 17.5 21.0 19.4 20.8 13.6 19.3 23.7 20.6 24.7 22.4 26.1 28.9 Ave. Hor. Force FH, lbs. 640 699 683 760 840 900 650 710 663 713 553 790 770 485 Ave. Vert. Force Fv, lbs. 340 404 367 224 190 209 300 318 285 279 395 430 430 347 Total Strain y 3.66 3.78 3.49 2.89 3.09 2.91 4.30 3.16 2.58 2.83 2.41 2.68 2.34 2.32
Mean Shear Shear Zone
Stress Temp. T KPSI T, 0C 164 175 177 207 225 253 156 221 225 225 165 239 250 140 157 156 151 180 184 199 150 160 146 142 136 181 175 111 Cutting Speed v, in/sec 0.333 0.262 0.262 0.333 0.262 0.262 0.262 0.204 0.204 0.167 0.333 0.262 0.262 0.333 Rake Angle ao* 0 0 0 5 5 5 5 5 5 5 10 10 10 15 Depth of Cut d, in. 0.010 0.010 0.010 0.012 0.012 0.012 0.010 0.010 0.010 0.010 0.010 0.010 0.010 0.010
25
Ts -co J (-) + Tam /v 1 + (3)1.328 amb (3)
Vd
where
Tamb = ambient temperature V = cutting speed
J = mechanical equivalent of heat p, Cv and K are as given in Table 1.
Heat generation, due to deformation of the discontinuous chip, may not have reached the steady state assumed in the continuous chip temper-ature analysis, and tempertemper-atures predicted by equation (3) are upper bounds. However, if the shear zones are sufficiently thin that the problem may be considered one of sliding contact, the steady state
is quickly achieved.( Calculated shear zone temperatures are
also given in Table 3 and in Appendix 1.
It is unlikely that the hydrostatic pressure on the material in the shear zone could lower the reversion temperature significantly, and certainly As could not be lowered to the maximum temperature achieved in the shear zone through machining. Therefore,the deforma-tion work provided by machining is insufficient to bring about
reversion.
The temperature in the shear zone will not reach the reversion temperature unless a large amount of deformation work can be performed
26
in the zone rapidly. Conduction of heat from hot thin zones into cooler surroundings occurs rapidly in most metals. The only available source of energy is the potential energy stored elastically in the machine-sample-dynamometer system, and it can only be released rapidly into the shear zone if the deforming material becomes unstable.
A suitable type of instability is that resulting from the thermal softening of material undergoing deformation. An instability occurs when the load on the machine performing the deformation is greater
than the maximum load that the material can resist. If the flow stress of a material drops significantly with increased temperature, then high temperature regions are inherently weaker. Further deforma-tion is confined to the weak regions in which a nearly adiabatic
temperature rise occurs. The criterion for adiabatic, or thermally-aided, instability is given in Appendix 2:
< -Cm b T
57 A (l/Y)
where DT/aT is the sensitivity of the flow stress to temperature, Cm is the machine stiffness, b = deformation zone thickness taken to equal the width of the austenite bands. A is the shear plane area, and aT/ay is the rate of change of temperature with strain. Evaluation of equation (4) for the machining problem, using values for v = .333 in/sec,
a = 00, and d = .010" results in the requirement,
27
L< - 75.5 psi/*C
This represents an easy condition resulting from the assumption of low hardening, the small values of b, and the use of a "soft" machine. In comparison, (a'), as calculated by drawing tangents to data for similar alloys with lower carbon content, (20) reaches a least value of - 294 psi/*C
in the range of temperatures between 150*C and 200C. The tangents do not have negative slopes in the range between room temperature and 150C.
Further heat transfer calculations from Appendix 2 establish the temperature at the boundary of the deforming zone after the machine has rapidly unloaded. Usually chip separation would occur in the austenite band. This made band thickness measurements impossible, since a half-thickness was attached to the separated chip, and the remainder of the austenite was attached to the succeeding chip. On rare occasions, as mentioned above, fracture and chip separation would occur outside the band, and an exact thickness measurement could be made. There was no apparent pattern for the variations of maximum measured band thickness, compiled in Table 4. There was considerable variation from chip to chip in band thickness. A more detailed correlation of force measure-ments and cutting parameters with the resulting chip would have to be made in order to better understand the chip's formation and subsequent instability.
28
TABLE 4
MEASURED AUSTENITE BAND THICKNESSES, SHEAR PLANE ANGLES, TEMPERATURE, AND MACHINING PARAMETERS
Ave. shear plane angle $, in. 16.6 16.0 17.5 21.0 19.4 20.8 13.6 19.3 23.7 20.6 24.7 22.4 26.1 28.9 Austenite band thick b x 104 in. 4.6 3.0 3.5 5.3 4.5 2.0 2.4 5.0 2.5 2.5 4.5 4.0 5.5 3.5 Minimum Temp. at edge of band, *C 449 516 511 563 624 799 421 553 665 708 486 537 470 433 Cutting Speed v, in/sec 0.333 0.262 0.262 0.333 0.262 0.262 0.262 0.204 0.204 0.167 0.333 0.262 0.262 0.333 Rake Angle a, 0 0 0 0 5 5 5 5 5 5 5 10 10 10 15 Depth of cut d, in. 0.010 0.010 0.010 0.012 0.012 0.012 0.010 0.010 0.010 0.010 0.010 0.010 0.010 0.010
29
Calculations of the shear zone temperature, after instability and machine unloading, have been made according to the method detailed in Appendix 2. Table 4 indicates the minimum temperatures reached on the edge of the shear zone, if the observed band thickness equalled the thickness of the shear zone. In all but one case the temperature exceeds 4260C, the reversion temperature for complete solution of alloying constituents. Due to the brief tempering treatment, some carbide precipitation could be expected from the martensite, and an actual reversion temperature, somewhat higher the 426*C, probably was the case.(11)
CONCLUSIONS
1. In addition to normal modes of discontinuous chip separation, it is possible for chip growth to be interrupted by shear inhomo-geneities resulting from thermally-aided instability. The existence of austenite on the sheared edges of discontinuous chips orthogonally cut from Fe-18.5Ni-.52C tempered martensitic steel is evidence that the temperature in the austenitic regions exceeds A These temper-atures result from localized rapid strain heating within a shear zone ahead of the cutting tool during the course of thermally-aided un-stable flow.
2. In many instances thermally-aided instability is the exclusive mode of separation. High speed cutting, using low rake angles and
moderate depths of cut, promotes discontinuous chip separation by this mode. High speed cutting is the case in most machining operations. Thermally-aided instabilities lead to separation at an earlier stage
of chip formation than do other modes, and may occur at any time following the initial concentration of deformation into a shear zone. 3. Thermally aided unstable flow will occur in the alloy investigated only if the cutting conditions lead to shear zone temperatures in the
range of 100 to 2000C, where thermal softening occurs. Cutting con-ditions leading to temperatures below 100*C result in conventional modes of chip separation, or in continuous chips.
-A&-31
REFERENCES
1. A.F. Gerds, Battelle Memorial Institute, DMIC Rep. No. 243, Columbus, Ohio, p. 117, (1967).
2. Z.S. Basinski, Proc. Royal Soc., 240A, p. 229, (1957).
3. M. Field and M.E. Merchant, Trans. ASME, 71, p. 421, (1949). 4. N.H. Cook, I. Finnie, M.C. Shaw, Trans. ASME, 76, p. 153,(1954). 5. W.B. Palmer, J. Mech. Eng. Sci., 9, p. 1, (1967).
6. R.F. Recht, Trans. ASME, J. Appl. Mech., Paper No. 63 WA-67. 7. N.H. Cook, Manufacturing Analysis, p. 39, Addison-Wesley, 1966. 8. R.G. Fenton and P.L.B. Oxley, Proc. Instn. Mech. Engrs., 183,
Pt. 1, p. 417, (1968-1969).
9. P.G. Winchell, Ph.D. Thesis, Department of Metallurgy, M.I.T., Cambridge, Mass., (1958).
10. R.W. Rohde, Acta Metallurgica, 18, p. 903, (1970).
11. R.J. Russell, Ph.D. Thesis, Department of Metallurgy, Purdue University, Lafayette, Ind., (1967).
12. R.W. Rohde and R.A. Graham, Trans. AIME, 245, p. 2441, (1969). 13. D.C. Wallace, P.H. Sidles, and G.C. Danielson, J. Appl. Phys. 31,
p. 168 (1960).
14. N.H. Cook and E. Rabinowicz, Physical Measurement and Analysis, p. 162, Addison-Wesley, 1963.
15. ASTM Standards, 1966, Part 30, p. 136.
16. W.B. Parlmer and M.S.M. Riad, Proc. 8th Inter. M.T.D.R. Conf., Univ. of Manchester, Part 1, p. 259, (1967).
17. J.H. Weiner, Trans. ASME, 77, p. 1331, (1955).
19. N.H. Cook, Temperature of Sliding Surfaces, Department of Mechanical Engineering, M.I.T., Cambridge, Mass., (1970). 20. M.J. Roberts and W.S. Owen, Met. Trans., 1, p. 3203,(1970). 21. C. Zener and J.H. Hollomon, J. Appl. Phys., 15, p. 22, (1944). 22. W.A. Backofen, Deformation Processing, to be published.
23. H.S. Carslaw and J.C. Jaeger, Conduction of Heat in Solids, Oxford, Clarendon Press, p. 80, (1959).
-A&-33
APPENDIX I
STRAIN VS. CUTTING SPEED DATA FOR CHIP TYPES 2 AND 3
The analysis of stress and strain in discontinuous chip machining as developed during the discussion of the machining tests strictly applies only to type 3 chips. The analysis can be extended to type 2 chips if the portion of the sheared edge which is lined with an irreg-ular fracture surface is small and if one assumes that the crack does not influence the chip mechanics other than by allowing shear to be concentrated in the shear zone. These approximations allow a rough estimate to be made of the total shear, mean stress, and temperature of the shear zone just prior to instability for all the samples con-taining austenite. These figures are given in Table I-1.
The data can be analyzed further by plotting, for constant param-eters of rake angle and depth of cut, the variation of strain with cutting speed. Strain is calculated using equation 1. The mean shear stress is given by equations 2a and 2b. The temperature in the shear zone just prior to instability is obtained, using these values of stress and strain in equation 3. It is possible to plot curves of constant temperature using equation 3 and the previously determined values of shear stress for particular values of temperature.
Equation 3 is solved for strain as a function of cutting speed using an iterative process. Plots for the temperature range between 100 and 200'C help to visualize the difficulty of producing temperatures
in the range in which thermally-aided instability may occur.
Figures I-1 through 1-4 demonstrate calculated strain-cutting speed isotherms in comparison with the measured values for chips with austenite on their sheared edges.
TABLE I-i
CUTTING PARAMETERS AND CALCULATED VALUES OF STRESS, STRAIN AND TEMPERATURE FOR ALL TESTS RESULTING IN TYPE 2 AND TYPE 3 CHIPS
Ave. Shear Plane Angle 13.1 13.5 12.1 13.4 11.0 12.4 9.0 10.0 15.0 22.3 16.6 16.0 17.5 7.0 12.0 10.3 18.5 17.5 8.0 7.0 Total Shear Strain -y 4.29 4.40 4.88 4.43 5.35 4.76 6.47 5.85 4.00 2.85 3.66 3.78 3.49 8.25 4.91 5.77 3.32 3.48 7.24 8.26 Mean Shear Stress T, KPSI 145 159 136 151 134 122 87 103 117 197 164 175 177 80 154 137 188 177 84 77 Shear Zone Temperature T, 0C 164 180 152 159 144 127 103 112 97 162 157 156 151 110 163 150 137 135 90 93 Cutting Speed v, in/sec .333 .333 .262 .262 .204 .204 .162 .162 .125 .333 .333 .262 .262 .204 .333 .333 .262 .262 .204 .162 Rake Angle a0 0 0 0 Depth of Cut d, in. .012 .010 .007 wA C,, M
Cutting Speed v, in/sec. .333 .262 .262 .204 .204 .162 .162 .333 .333 .262 .204 .204 .162 .162 .333 .262 .204 .204 .162 .333 .333 .262 .204 Rake Angle a 5 5 5 10 Depth of Cut d, in. .012 .010 .007 .012 Ave. Shear Plane Angle 21.0 19.4 20.8 17.7 19.0 24.0 16.3 18.0 19.0 13.6 19.3 23.7 20.6 13.7 15.0 16.7 17.5 19.2 17.0 21.0 20.0 16.3 18.5 Total Shear Strain y 2.89 3.09 2.91 3.36 3.16 2.59 3.62 3.20 3.16 4.30 3.16 2.58 2.83 4.27 3.91 3.48 3.39 3.12 3.49 2.70 2.88 3.52 3.15 Mean Shear Stress r, KPSI 207 225 253 226 171 232 148 158 164 156 221 225 225 141 151 163 220 241 172 163 182 176 154 Shear Zone Temperature T, *C 180 184 199 179 137 147 120 143 147 150 160 146 142 118 135 125 144 150 111 142 161 160 125 ('3
TABLE I-1 (Continued) Cutting Speed v, in/sec. .333 .333 .262 .262 .204 .204 .204 .162 .333 .262 .262 .333 .333 .262 .204 .162 Rake Angle * 0 10 10 15 15 Depth of Cut d, in. .010 .007 .010 .007 Ave. Shear Plane Angle $ 0 25.0 23.0 22.4 26.1 20.6 19.0 19.5 21.8 17.0 16.0 20.0 20.0 28.9 25.0 33.0 22.5 Total Shear Strain y 2.41 2.58 2.68 2.34 2.70 3.07 2.99 2.68 3.40 3.59 2.92 2.02 2.32 2.32 1.93 2.50 Mean Shear Stress T, KPSI 165 162 239 250 222 183 221 247 193 172 179 141 140 190 231 270 Shear Zone Temperature T, *C 136 138 181 175 157 143 165 158 155 133 125 105 111 131 130 137 (~3 -4
10
01
ifin. 8 6 4 2 0.
oo
d =.007 -0 0--0 0.08 0.16 0.24 C.320~
d:Q1 0-e o -.- ~~-I I I I 0.08 0.16 0.24 0.32 d =.012 -4 0-4 a 0@ 0 0 0 *1 0.08 0.16 0.24 G.S2V
it/sec.Figure I-1. Strain-cutting speed diagrams, for ct = 0*. data; open circles and lines are calculated
lines = 100*C isotherm; upper lines = 200C
Dark circles are actual isotherms. Lower
isotherm.
o
a = * i * I * -d=.007 0 \0 12 1 0 in/in. 81 6 4 2 0 0.08 0.16 0.24 0.32 C 5* I d=.010 i
M,-o
7
0 I A I 0.08 016 0.24 0.32 .4 -0 0(=5* d=.012
0\ 00\0
tu 0N I I 0.08 0.16 0.24 G. 2V
ft/sec.Strain-cutting speed diagrams for a = 50.
I * I I 9 1 I I I I I Figure 1-2.
d =.007 0 07 0 0 II d .010J --0 10 in/in 8 d =012 . j Ja . .I I I~ .~ I I~ I - A I- -I 0.08 0.16 0.24 0.32 0.08 0.16 .24 .
V
ft /sec.Strain-cutting speed diagrams for ct = 100.
0 0 0 0 0 0 6 4 2-01 C I I a
I
I 4 U.U8 V.1 io .24; V.32 Figure I-3.hi i~
~oL
o d, j 1 / C 2 '.A
t a t/ l .APPENDIX II
CONDITIONS FOR ADIABATIC INSTABILITY AND SUBSEQUENT TEMPERATURE RISE LEADING TO REVERSION
The possibility of an adiabatic or thermally-aided instability has been explored elsehwere(21) and has been observed in aluminum at low temperatures.(2) If shear stress, T, is a function of shear strain and shear strain rate, then the condition for instability can be expressed, (22)
C b
A- ' + L1 3 (II-l)
where C = resultant machine stiffness, b = shear zone thickness, A = area of the shear plane. In a material which demonstrates little strain hardening or strain rate hardening, equation (II-1) reduces to
Cmb
(A)( ) < (11-2)
Fe-Ni-C martensitic steels do not strain harden or strain rate harden appreciably at high strains, as true stress-strain curves indicate.(20) The stress dependence on temperature, ( ), is
evaluated by constructing tangent lines to the yield stress-temper-ature curve. At low temperstress-temper-atures the brittle nstress-temper-ature of Fe-18.5Ni-.52C does not permit evaluation of (L). Fe-Ni-C steels of lower carbon content have been tested in the temperature range of interest.(20)
.AL-43
The strain heating term,(3T/ y), is obtained by differentiation of equation 3; since strain heating before the machine unloads is totally due to the strain involved in the chip formation process:
-vd
2 (1 + K
The stiffness of the machine-sample-dynamometer system can be measured by hand feeding a test sample, mounted in the dynamometer-vice, into the tool housing. The feed was advanced by increments of .001",and the force in the dynamometer was measured as the machine deflected. The average horizontal and the average vertical stiffnesses were calculated by dividing the change in force by the incremental
deflection, averaging the quotients in each case.
C = 3.5 x 10 lb/in my
C = 8.3 x 100 lb/in mH
The resultant stiffness depended on the vertical and horizontal forces on the dynamometer.
CmR mH cos (x - a) + *Cm sin (A-ce)
The area of the sheared plane, A, equals wd and the thickness sin $'
of the austenite stripe is assumed to equal b.
In a sample calculation, typical values for these terms are:
(D)
= 122*C/unit strainC = 7.03 x 10⁴ lb/in. A = 3.52 x 10⁻³ in b = 4.6 x 10~4 in;
the requirement for adiabatic instability is,
< - 75.5 psi/*C. (11-4)
If an instability exists the machine will rapidly unload, causing rapid shearing and heating in the shear zone. Not all of the potential energy previously stored in the machine is directly converted into
deformation energy. At some point during unloading, the chip separates, and the machine is free to completely unload and briefly oscillate
about its unloaded position. This is illustrated schematically in Figure (II-1). Oscillographs of the dynamometer output, taken during instabilities, indicate that damped vibrations of varied initial amplitudes occur in the system. This indicates that varied amounts of deformation work are performed prior to chip separation. By measuring the log decrement of the vibrating system,
F2 Fl
F Fc Sample Machine Dynamometer F=O to F F=Fto F F-- to E-O
Figurell-1. Schematic of machine-sample-dynamometer system. (a) Dynamometer output for (b) system unloaded, (c) maximum homogeneous deformation, (d) unstable localized flow, (e) chip separation and machine vibration. 45 (a.) (b.) (c.) (d.) (e.)
it is possible to calculate F 0, the load on the machine at the point of chip separation. The drop in the machine load from Fmax to F , during the instability and prior to chip separation, is used to cal-culate the change in potential energy of the machine, A W :
AWF = Fmax_ F 1 Fmax F (II-5)
m m Hor + m m Vert
Equation (11-5) combines the horizontal and vertical deflection con-tributions, using the horizontal and vertical components of force and stiffness. The change in the potential energy is assumed to equal the deformation work in the unstable shear zone. F0 is typically about 78% of the value of Fmax; therefore, most of the elastic energy of the machine is dissipated by means other than performing deformation work, and in particular by vibrations after the chip has separated.
Deformation work is performed in time, t, measured between Fmax and F0 on the oscillographs. Typically the instability lasts for
approximately 2 x 10~4 seconds.
The temperature at the edge of the shear zone after rapid shearing is solved by heat transfer analysis according to source 23. The
problem is one of constant heat generation in a thin planar zone with conduction in both directions normal to the zone. The equation gov-erning the temperature use, AT, within the zone of width, X, at any point, x, measured from its center is given by
47
AT = 1 - 2i2 erfc (-2x- 2i2 erfc&+2x (11-6)
JPC V V IA IIF i
- 4J-Kt 4/Kt
where p = density, Cv = heat capacity, v = volume of the shear band,
i2 erfc = the second integral of the complimentary error function,
K = thermal diffusivity. The volume of the shear band is,
V = sd (11-7)
If the material inside the band is to be entirely austenitic, then at x = 1/2 the temperature must be at least 426*C, for reversion. If again it is assumed that k = b, then equation (11-6) reduces to,
_ (AW ) sin $
2 b
AT = Jpc d w b .25 - i erfc (11-8)
v 24 K t
The term in large brackets is an indication of the adiabaticity of the temperature rise.