HAL Id: hal-00683879
https://hal.univ-brest.fr/hal-00683879
Submitted on 30 Mar 2012
HAL is a multi-disciplinary open access
archive for the deposit and dissemination of
sci-entific research documents, whether they are
pub-lished or not. The documents may come from
teaching and research institutions in France or
abroad, or from public or private research centers.
L’archive ouverte pluridisciplinaire HAL, est
destinée au dépôt et à la diffusion de documents
scientifiques de niveau recherche, publiés ou non,
émanant des établissements d’enseignement et de
recherche français ou étrangers, des laboratoires
publics ou privés.
marine phytoplankton: an experimental approach with
natural communities
Gabriele Trommer, Philippe Pondaven, Michael Siccha, Herwig Stibor
To cite this version:
Gabriele Trommer, Philippe Pondaven, Michael Siccha, Herwig Stibor. Zooplankton-mediated
nu-trient limitation patterns in marine phytoplankton: an experimental approach with natural
commu-nities. Marine Ecology Progress Series, Inter Research, 2012, 449, pp.83-94. �10.3354/meps09508�.
�hal-00683879�
INTRODUCTION
Nutrient limitation in phytoplankton communities is commonly observed and may eventually lead to growth constraints (Hessen et al. 2004), as well as stoichiometric changes in phytoplankton biomass (Klausmeier et al. 2004a). While nutrient limitation in freshwater lakes is mainly associated with phospho-rus (Schindler 1977, Hecky & Kilham 1988, Elser & Hassett 1994), nutrient limitation in marine environ-ments is not focused on just one nutrient (Hecky et al.
1993). Nitrogen (N), phosphorus (P) and iron can potentially limit the primary productivity of oceans (Boyd et al. 2000, Wu et al. 2000, Sañudo-Wilhelmy et al. 2001, Brzezinski et al. 2011). However, the type of nutrient limitation is dependent on the temporal and spatial distribution of dissolved nutrients (e.g. Tyrrell 1999, Weber & Deutsch 2010), in addition to species-specific requirements of phytoplankton (Quigg et al. 2003, Lagus et al. 2004). Seasonal variations in the nutrient limitation of phytoplankton can be high in coastal areas that are affected by river runoff and
© Inter-Research 2012 · www.int-res.com *Email: gabi.trommer@gmx.de
Zooplankton-mediated nutrient limitation patterns
in marine phytoplankton: an experimental approach
with natural communities
Gabriele Trommer
1,*, Philippe Pondaven
1, Michael Siccha
2, Herwig Stibor
1 1European Institute for Marine Studies (IUEM), Laboratoire des Sciences de l’Environnement Marin (LEMAR),UMR CNRS/UBO/IRD 6539, 29280 Plouzané, France
2Institute of Earth Sciences, Hebrew University of Jerusalem, 91904 Jerusalem, Israel
ABSTRACT: Zooplankton nutrient recycling has been shown to substantially affect nutrient avail-ability for phytoplankton . However, investigations are required to determine whether zooplank-ton also influence nutrient limitation in marine phytoplankzooplank-ton communities, and whether grazing by different zooplankton groups results in different patterns of phytoplankton nutrient limitation. We performed laboratory experiments under different nutrient supply conditions on a variety of phytoplankton communities with natural densities of copepods and rotifers, and tested phyto-plankton nutrient limitation in bioassays for nitrogen, phosphorus, and the combination of the two. After 5 d incubation with zooplankton, we observed a significant increase in phytoplankton bio-mass in the zooplankton treatments. We relate this largely to nutrient recycling effects, which are amplified through possible trophic cascade effects. In copepod treatments, the highest phyto-plankton biomass was reached under Redfield and nitrogen excess nutrient supply conditions, while the highest biomass in rotifer treatments was registered under phosphorus excess con -ditions. In most cases, nutrient limitation assays revealed a co-limitation of phytoplankton by nitrogen and phosphorus. With increasing nitrogen supply, we observed an increase in phospho-rus limitation in the copepod treatments and a decrease in nitrogen limitation in the rotifer treat-ments. The phytoplankton community was driven into phosphorus limitation under nitrogen excess conditions in copepod treatments. Our results indicate that natural densities of zooplankton are able to promote nitrogen and phosphorus co-limitation in phytoplankton communities. KEY WORDS: Nutrient limitation · Marine plankton · Zooplankton-driven nutrient recycling · Stoichiometry
Resale or republication not permitted without written consent of the publisher
O
PEN
PEN
turnover events, which cause seasonally changing ratios of dissolved nutrients, notably N and P (e.g. Fisher et al. 1992, Beman et al. 2005).
In general, the stoichiometric composition of phyto-plankton is dependent on the rate of carbon fixation per assimilated nutrient and can be characterised as the atomic carbon to nitrogen to phosphorus (C:N:P) ratio. The average relationship between C:N:P in seston is found to be relatively stable, rang-ing between 106:16:1 (Redfield 1958, Copin-Mon-tegut & Copin-MonCopin-Mon-tegut 1983) and 166:20:1 (Sterner et al. 2008). Alterations of phytoplankton C:N:P ratios can be caused by changes in various factors, such as growth rates (Klausmeier et al. 2004a), light intensity (e.g. Healey 1985, Sterner et al. 1997, Diehl 2002, Klausmeier et al. 2004b), and dissolved nutrient con-centrations (Klausmeier et al. 2004a).
It has further been shown that the availability of dissolved nutrients is also affected by the nutrient recycling of zooplankton (Sterner et al. 1992, Urabe 1993, Elser & Hassett 1994). Since consumer bodies have relatively conservative stoichiometric composi-tions and specific nutrient requirements (Sterner et al. 1992), the ratio of excreted nutrients is altered through the nutrient demands of the consumer. Hence, the withdrawal of nutrients from zooplankton in ratios required by consumers may consequently affect the nutrient limitation of phytoplankton (Elser et al. 1988, Andersen & Hessen 1991, Urabe 1993, Elser & Hassett 1994). This concept of phytoplankton stoichiometry being affected by a feedback mecha-nism of zooplankton consumer grazing is termed consumer-driven nutrient recycling (CNR; Sterner 1990, Elser & Urabe 1999).
According to the nutrient demands of herbivorous consumers, recycled food should have different effects on the nutrient budget of an aquatic system. Hypothetically, since copepods have a relatively high N demand (Andersen & Hessen 1991, Gismervik 1997, Hassett et al. 1997), they should excrete less N, and consequently drive the system towards N limita-tion (Sterner & Hessen 1994, Walve & Larsson 1999). Conversely, consumers with low N:P ratios and/or higher growth rates (Main et al. 1997), such as daphniids, rotifers (Stemberger & Miller 1998) or ap-pendicularians (Sommer 2003), tend to manoeuvre the system towards P limitation due to higher P mands. Such effects have been observed and de-scribed in freshwater lakes (cf. Table 1 in Elser & Urabe 1999), but are more difficult to detect in marine environments. The effects of nutrient recycling are presumed to be weaker in marine systems, due to a smaller stoichiometric mismatch between
phyto-plankton and consumers (Elser & Hassett 1994). Until now, only one study has attempted to investigate the effect of zooplankton on phytoplankton stoichiometry and nutrient limitation in a marine environment (Sommer et al. 2004). Sommer et al. (2004) performed mesocosm experiments in Atlantic waters off Norway to investigate the influence of density-manipulated copepod and appendicularian communities on phyto-plankton nutrient limitation using bioassays. In the appendicularian treatments, nutrient limitation of phytoplankton was not detected. The authors attrib-uted the absence of phytoplankton nutrient limitation in these treatments to the low densities of appendicularians. However, as the employed concentrations re -presented natural densities, the authors concluded that appendicularians would not be able to drive phytoplankton into nutrient limi tation in the natural environment. In the copepod treatments, Sommer et al. (2004) found that N limi tation was primarily en-hanced through a trophic cascade effect. Ciliates were reduced through copepod grazing, releasing nano phytoplankton from ciliate grazing pressure, while at the same time reducing the amount of N-rich ciliate excretions. As a con sequence, nano phyto -plankton was affected by N limit ation due to the re duced amount of ciliate excretions.
In terms of ecological modelling, 2 studies (Toura -tier et al. 2001, Nugraha et al. 2010) have specifically approached the question of how herbivorous zoo-plankton may influence N and P distributions in aquatic systems. Both studies are based on the model of Sterner (1990) and extend the understanding of the relationship between the N:P ratio of zooplank-ton excretions and the quality of the phytoplankzooplank-ton food (the phytoplankton N:P ratio). Touratier et al. (2001) showed that the type of nutrient limitation in a phytoplankton community is dependent on the zoo-plankton group (in their case copepods and cladocer-ans), and its stoichiometric requirements. The model of Nugraha et al. (2010) was specifically designed for marine systems, and predicts that global primary productivity would be significantly affected by her-bivorous zooplankton. The model also shows that if zooplankton had a higher N:P ratio than phytoplank-ton, global primary productivity would increase in the presence of herbivorous zooplankton. The result-ing low N:P re-supply ratio from zooplankton would favour the growth of P-limited nitrogen-fixing phyto-plankton, which in turn would promote the growth of N-limited phytoplankton (Nugraha et al. 2010).
However, the influence of zooplankton on nutrient limitation and growth of phytoplankton in marine systems has never been tested under controlled
labo-ratory conditions. Therefore, we performed a labora-tory study to investigate the short-term effects of natural zooplankton densities on nutrient limitation patterns of phytoplankton communities. We investi-gated whether zooplankton is able to affect the nutri-ent limitation of phytoplankton on an ecologically reasonable timescale of 5 d. In highly variable envi-ronments, such as the Bay of Biscay, longer periods of stable oceanographic conditions for plankton are unlikely to occur (e.g. Koutsikopoulos & LeCann 1996). In addition, we examined whether different zooplankton groups (copepods and rotifers in our case) can cause different nutrient limitation patterns in phytoplankton communities. To obtain a wide range of responses, we investigated the nutrient lim-itation patterns in different phytoplankton communi-ties arising from a common natural community, and under different nutrient supply conditions.
MATERIALS AND METHODS Experimental design
The experiment was performed in the laboratory facilities of the European Institute for Marine Studies, Plouzané, France, using 6 mesocosm tanks (350 l) at constant temperature (~18°C), and 17 h light expo-sure (60 µmol quanta m−2s−1) with natural spectrum
fluorescence tubes.
The tanks were filled in late February 2010 with 1 µm filtered sea water. The natural phytoplankton community of the Bay of Brest on the Atlantic coast of Brittany, France, served as initial phytoplankton community. To obtain a range of different phyto-plankton communities, a different amount (10, 5, 1, 0.1, 0.01, 0.001 ml) of a Bay of Brest water sample (250 µm pre-filte red) was added to each of the 6
mesocosm tanks. The intentionally introduced higher level of environmental noise across the tanks allows the ob servation of broad instead of specific res pon ses. Phytoplankton communities in the tanks re presented different combinations of spe-cies originating from a single sample of the Bay of Brest community and were therefore treated as repli-cates. The tanks served as growth chambers for the phytoplankton communities, as well as incubation basins for the zooplankton experiments and nutrient bioassays. To attain similar phytoplankton biomasses before zooplankton inoculation, 4 wk of growth was allowed. Aeration of the mesocosms was provided by constant air bubbling.
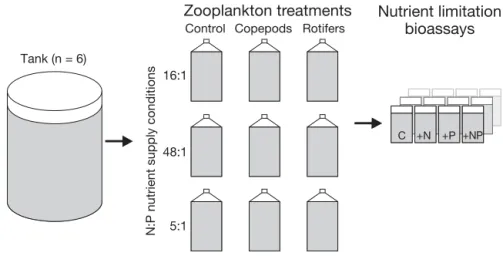
To investigate nutrient limitation patterns of phyto-plankton under different nutrient supply ratios, the following nutrient fertilisation ratios were selected (based on natural dissolved P concentrations): Red-field conditions (16:1 N:P ratio with addition of 8 µmol l−1N and 0.5 µmol l−1P) for a balanced envi-ronment, N excess conditions (48:1 N:P ratio with addition of 24 µmol l−1N and 0.5 µmol l−1P) for a
P-depleted environment, and P excess conditions (5:1 N:P ratio with addition of 8 µmol l−1N and 1.5
µmol l−1P) for a N-depleted environment (Fig. 1). N
was added as 1:1 molar solution of KNO3 and
(NH4)2SO4and P was added as KH2PO4solution. For
each nutrient supply condition, 3 bottles (800 ml) per mesocosm tank were filled with tank water, fertilised and incubated in the respective tanks. To ensure reli-able handling of the manipulation procedure, sam-ples for the 3 nutrient supply conditions were taken out one after the other.
Two days after the initiation of phytoplankton growth in the fertilised 800 ml bottles, copepods and rotifers were each added to 1 bottle per nutrient con-dition at similar concentrations (~200 µg zooplankton carbon l−1). The third bottle served as the control
16:1
48:1
5:1
Control Copepods Rotifers
C +NP
Tank (n = 6)
N:P nutrient supply conditions
+N +P
Zooplankton treatments
Nutrient limitation
bioassays
Fig. 1. Experimental design: 3differ-ent N:P nutridiffer-ent supply conditions (16:1, 48:1, 5:1) were combined with 3 zooplankton treatments (control, copepods, rotifers) using samples from 6 tanks. Tanks were treated as replicates. After 5 d zooplankton in-cubation, the phytoplankton from each experimental unit (n = 54) was tested for nutrient limitation in a bioassay experiment. Bioassays for each treatment comprised no nutri-ent addition (C), nitrogen addition (+N), phosphorus addition (+P), and combined nitrogen and phosphorus
without zooplankton (Fig. 1). For zooplankton treat-ments, the copepod Acartia tonsa and the rotifer Bra chionus plicatilis were used, since both are well established experimental zooplankton species. B. pli
-ca tilis lives mainly in coastal waters and salt lakes
and was chosen for practical culturing reasons. Rotifers were fed with a mixture of Rhodomonas sp. and Dunaliella sp. and were washed over a 63 µm gauze and put into filtered sea water before being transferred into the experimental units. Numbers were estimated by averaging 4 counts of 1 ml each. Cope pods were hatched from eggs in filtered natural sea water, fed with Rhodomonas sp. and cultured until adult stages were reached. They were trans-ferred into the experimental units by individual hand picking after being kept for 1 night in fresh filtered sea water without food algae. After zooplankton addition, the bottles were incubated for 5 d in the respective tanks, and subsequently sub-sampled for stoichiometric analysis and nutrient limitation bio -assay (Fig. 1). Altogether, the experiments consisted of 54 experimental units with 9 factor combinations (3 nutrient con ditions × 3 zooplankton treatments) per tank (n = 6).
Sampling procedure
To ensure the elimination of rotifers and copepods from the samples, the water from all 800 ml bottles was filtered through a 63 µm mesh. For the determi-nation of seston particulate organic carbon (POC), ni-trogen (PN), and phosphorus (PP), 50 ml (for POC and PN) and 20 ml (for PP) of the residual water was tered onto pre-combusted acid-washed glass fibre fil-ters (GF/C, Whatman). POC and PN were measured with a CHN-Elemental Analyzer (CE Instruments), while PP was measured via a molybdate reaction following sulphuric acid digestion. To deter mine the elemental composition of the zooplankton species, 2 × 10 adult Acartia tonsa and 2 × ~1000 Brachionus
plicatilis were brought onto pre-combusted
acid-washed glass fibre filters, and analysed accordingly. The next step in the experimental analysis was to test the phytoplankton for potential nutrient limitation in each of the 54 experimental units in a bioassay ex-periment. For these bioassays, 4 × 20 ml of the filtered water were filled into small sub-sample bottles (Fig. 1). In 3 of the sub-samples, the nutrients N, P, and a combination containing N and P (NP) were added as nutrient pulses (24 µmol l−1 N, 1.5 µmol l−1 P). One
sub-sample served as a control without nutrient addi-tion. In all bioassays, chlorophyll fluorescence was
measured with an AquaPen-C AP-C 100 (Photon Sys-tems Instruments) fluorometer at 455 nm excitation wavelength. Integrated raw fluorescence served as proxy for the chlorophyll a content. Measurements were performed immediately after the addition of the nutrient pulse (0 h) and subsequently at 2, 24, 48 and 72 h after the nutrient pulse (± 30 min).
Calculations
To identify cases of nutrient limitation in each bioassay, the slopes of linear regressions of chloro-phyll a versus time (h) were calculated and tested for significant differences between sub-samples with nutrient addition (N, P, NP) and the control (5% level 1-sided t-test). The presence of significant differ-ences were then classified either as no limitation (no differences from control), P limitation (P or P + NP different from control), N limitation (N or N + NP dif-ferent from control), or co-limitation (NP or N + P + NP different from control). Following Tamminen & Andersen (2007), we used bootstrapping in our nutri-ent limitation classification by the random selection of slopes within factor combinations. Analyses of variance (ANOVAs) were performed on the inte-grated raw fluorescence data (as proxy for chloro-phyll a content) to highlight significant differences (p < 0.05) among tanks and experimental units.
RESULTS
Similar phytoplankton biomasses were observed in the tanks after 4 wk of growth and remained in the same order of magnitude among nutrient treatments throughout the experimental duration (n = 18; chloro-phyll a values among tanks over time, Kruskal-Wallis ANOVA p = 0.344; starting chlorophyll a values among the 3 nutrient approaches over all tanks, Kruskal-Wallis ANOVA p = 0.505). The phytoplank-ton communities in the tanks represented typical phytoplankton communities that can be found in the Bay of Brest (e.g. Del Amo et al. 1997) and were dom-inated by diatoms (Nitzschia sp., Chaetoceros sp.) and dinoflagellates (Gymnodinium sp.).
All 54 experimental units (800 ml bottles) were successfully analysed, and the respective type of nu-trient limitation in phytoplankton communities could be determined. All nutrient limitation assays were analysed; 72 measurements (2 h measurement under N excess conditions) of the total 1080 measurements could not be performed due to technical problems.
Zooplankton effects on algal biomass
We observed significant differences between zoo-plankton treatments averaged over all nutrient conditions (2way ANOVA p < 0.001), expressed as en -hanced phytoplankton biomass in the copepod and rotifer treatments after 5 d of incubation compared to the control treatment without zooplankton (Fig. 2a). The effect of the zooplankton was dependent on the
applied nutrient conditions (2-way ANOVA zoo × nutrient interaction p < 0.001). In the control as well as in the rotifer treatments, the highest phytoplank-ton biomass was found under P excess conditions. In the copepod treatments, the Redfield nutrient condi-tions promoted the highest phytoplankton biomass.
Nutrient limitation assay results
In the bioassays, the highest growth rates (indicated by the slopes in the nutrient limitation assays) were reached under P excess conditions, and the lowest growth rates were reached under Redfield conditions (Fig. 3; same pattern for each zooplankton treatment, not shown separately). A significant in crease in total phytoplankton abundance related to the addition of nutrients was determined in over 75% of all cases. The biomass of phytoplankton communities in -creased significantly in 76% of the control treatments, in 80% of the copepod treatments, and in 87% of the
Chlorophyll a (µg l –1 ) 50
a
b
c
d
40 30 20 10 0 50 40 30 20 10 0 p < 0.001 Control ControlZooplankton treatment N:P nutrient supply condition
Copepods Copepods Rotifers Rotifers 5:1 16:1 48:1 5:1 16:1 48:1 5:1 16:1 48:1 p < 0.05 p < 0.001 p < 0.001
Fig. 2. (a) Mean phytoplankton chlorophyll a in different zooplankton treatments after 5 d of zooplankton incubation (data of all nutrient supply conditions include 6 tanks with 4 replicate measurements; n = 72, 2-way ANOVA factor zooplankton p < 0.001, zooplankton × nutrient interaction p < 0.001). (b) Mean phytoplankton chlorophyll a in different N:P nutrient supply conditions in control treatments (6 tanks with 4 replicate measurements: n = 24, Kruskal-Wallis ANOVA p < 0.05). (c, d) Same as in (b) for (c) copepod (Kruskal-Wallis ANOVA p < 0.001) and (d) rotifer treatments (Kruskal-Wallis ANOVA p < 0.001). Error bars represent 95% confidence interval. Significantly different groups (Tukey’s HSD test, p < 0.05) are marked by
different numbers of asterisks
N:P nutrient supply condition
5:1 16:1 48:1 Slope (chlorophyll a vs. time) 1.5 1.0 0.5 0.0 –0.5 p < 0.001
Fig. 3. Comparison of linear regression slopes of nutrient limitation assays (duration 72 h) as indicator of growth rates under P excess (5:1), Redfield (16:1) and N excess (48:1) nu-trient conditions. Values are means of slopes (chlorophyll a [µg l–1] versus time [h] over all zooplankton treatments and
all slopes in 6 tanks: n = 72, 2-way ANOVA factor nutrient condition p < 0.001, zooplankton × nutrient interaction p < 0.001) with error bars representing 95% confidence interval. Significantly different groups (Tukey’s HSD test, p < 0.05) are marked by different numbers of asterisks. All zooplank-ton treatments showed a similar pattern and are therefore
not shown separately
Zooplankton Bioassay nutrient limitation cases treatment 00 N P NP Control 23.9 19.6 25.9 30.7 Copepods 20.3 18.4 26.0 35.3 Rotifers 13.1 23.7 19.0 44.2 Table 1. Frequencies (%) of nutrient limitation cases (1000 bootstrap probabilities) in zooplankton treatments averaged over all nutrient conditions: no limitation (00), P limitation (P), N limitation (N), NP co-limitation (NP). Highest
rotifer treatments (Table 1). The largest increase in phytoplankton biomass occurred in the zooplankton treatments as a result of combined NP addition, indi-cating a prevalent NP co-limitation. Under Redfield conditions, nutrient addition did not increase the phytoplankton biomass in most cases (no limitation in 66% of cases in control, 38% in copepod and 61% in rotifer treatments; Table 2). Under N excess condi-tions, most cases in the control treatment were also classified as not being nutrient limited, closely fol-lowed by those classified as P limited. Under P excess conditions, phytoplankton communities in the control treatments were most frequently classified as NP co-limited (38%) and P co-limited (36%). In the copepod treatments, phytoplankton was classified as being NP co-limited under P excess (46%) and P limited under N excess conditions (37%). In the rotifer treatments, phytoplankton was classified as NP co-limited under P excess and N excess conditions (45% and 47%, respectively; Table 2).
Phytoplankton stoichiometry
In our experiments, mean C:N ratios of the phyto-plankton biomass (control treatment without zoo-plankton) ranged around 4.3 (average ratio of col-umn 1 in Table 3). These C:N ratios were clearly
below the mean seston stoichiometry in marine and freshwater environments described by Sterner et al. (2008; ratio 8.3) and Redfield (1958; ratio 6.63). These results indicate N excess conditions as prevalent under all initial nutrient conditions (Redfield condi-tions as well as N excess and P excess fertilisation). Phytoplankton C:N ratios in the copepod treatments (average 5.6; Table 3) were slightly higher (statisti-cally not significant) than in the control treatments and the biomass C:N ratio of the copepods (4.5; Table 4). This discrepancy between the C:N ratios may indicate that copepods draw an high amount of N from the system into their bodies, resulting in higher phytoplankton C:N ratios. In the rotifer treat-ments, the phytoplankton C:N ratios were also higher than in the control treatments (Table 3), also indicating a significant use of N by rotifers. In the rotifer treatments, the mismatch between the phyto-plankton C:N ratio (average 5.6) and the rotifer C:N
N:P supply Control Copepods Rotifers
condition 00 N P NP 00 N P NP 00 N P NP 5:1 5.1 21.0 36.3 37.6 3.2 33.5 17.5 45.8 9.6 28.8 16.9 44.7 16:1 65.6 15.1 16.5 2.9 37.6 8.2 21.1 33.2 60.6 14.3 11.7 13.4 48:1 35.8 9.7 31.6 22.9 22.0 16.6 36.8 24.6 21.2 12.0 20.3 46.5 Table 2. Frequencies (%) of nutrient limitation cases (1000 bootstrap probabilities) in all zooplankton treatments under N:P nutrient supply conditions (5:1 P excess, 16:1 Redfield, 48:1 N excess): no limitation (00), P limitation (P), N limitation (N),
NP co-limitation (NP). Highest frequencies are highlighted in bold
N:P supply Control Copepods Rotifers
condition C:N C:P N:P C:N C:P N:P C:N C:P N:P 5:1 4.1 90.8 22.4 4.4 115.1 26.5 5.9 122.2a 19.9a (±1.0) (± 32.3) (± 7.3) (±1.4) (± 35.9) (± 5.2) (±1.3) (± 79.0) (±10.3) 16:1 3.6 94.6 31.2 6.1 96.8 16.7 5.2 86.7 16.0 (±1.4) (± 25.4) (±15.6) (±1.7) (± 20.2) (± 4.9) (± 2.2) (±13.9) (± 5.9) 48:1 5.2 93.4 18.9 6.4 102.8 16.1 5.8 82.4 14.0 (± 2.2) (± 61.4) (± 8.4) (±1.5) (± 49.9) (± 5.5) (±1.6) (± 34.8) (± 3.2) an = 5
Table 3. Mean (± standard deviation) of phytoplankton biomass stoichiometric ratios (n = 6) of all zooplankton treatments in different N:P nutrient supply conditions (5:1 P excess, 16:1 Redfield, 48:1 N excess). Bold numbers mark ratios significantly different from the Redfield relationship (106:16:1), italic numbers indicate ratios significantly different (p < 0.05) from that of
Sterner et al. (2008) (166:20:1)
Zooplankton C:N C:P N:P Copepods 4.5 (± 0.3) 77.6 (± 33.7) 17.6 (± 8.7) Rotifers 5.9 (± 0.1) 103.2 (± 6.7) 17.4 (± 0.9) Table 4. Mean (± standard deviation) of zooplankton stoich
ratio (5.9; Table 4) was smaller than in the copepod treatments.
In general, phytoplankton C:P ratios fitted Redfield conditions, and were significantly below 300 under all nutrient conditions, which indicates the absence of severe P limitation at any time (Table 3). The C:P ratios of copepods were lower than those of the rotifers (77.6 to 103.2; Table 4). The phytoplankton N:P ratios were similar to the 20:1 relationship found by Sterner et al. (2008), and were in 3 cases signifi-cantly higher than the Redfield 16:1 ratio (Table 3). The N:P ratios of copepods were similar to those of rotifers (17.6 to 17.4; Table 4), also matching with the biomass N:P ratios of phytoplankton (Table 3).
DISCUSSION
In our experiments, we observed, on average, posi-tive effects of zooplankton presence on total phyto-plankton abundances compared to the control treat-ments (Fig. 2). In general, higher phytoplankton biomass may result from nutrient recycling or trophic cascade effects of selective grazing and compensatory growth. Compencompensatory growth has been ob -served in freshwater lakes with low zooplankton densities, where grazing caused a significant in -crease in the biomass of grazing resistant algae (e.g. Sommer et al. 2001). Since we were not analysing the grazing efficiency on different phytoplankton spe-cies, we cannot verify this hypothesis. A trophic cas-cade effect was also considered to be responsible for higher phytoplankton abundances in a mesocosm study with North Atlantic phytoplankton (Sommer et al. 2004). Since copepods fed on ciliates and released nanophytoplankton from microzooplankton grazing pressure, total phytoplankton increased in biomass. This mechanism cannot be excluded for our experi-ments, since large ciliates (>100 µm with abundances <1 ml−1) were occasionally present, but may not apply for the rotifer treatments. Although rotifers may feed on small ciliates (< 60 µm, Gilbert & Jack 1993), the upper natural limit of their food size is de-termined by body size, and therefore would not in-clude ciliates larger than 100 µm. In addition, the abundance of rotifers in our experiments greatly ex-ceeded that of ciliates (by a factor of 150). The release of phytoplankton from the relatively low grazing pressure of ciliates through rotifers would thus not suggest a considerable effect on the phytoplankton biomass. Therefore, we exclude a trophic cascade effect involving ciliates in the rotifer treatments. Al-ternatively, an effect of compensatory growth could
be related to bacterioplankton. If roti fers focus on bacteria as food, phytoplankton could increase due to reduced grazing pressure, nutrient recycling of P-rich bacterial food and less competition for nutrients. Similar to the rotifer treatments, the copepod treat-ments showed an increase in phytoplankton biomass compared to the control treatments. Copepod graz-ing on bacterioplankton and ciliates, which were as equally low in abundance as in the rotifer treatments, may have had a minor compensatory effect on the total phytoplankton abundance in our experiments. A more probable link in trophic cascades could involve heterotrophic dinoflagellates, which have been found to be high quality food for copepods (Chen & Liu 2011). Since dinoflagellates were abun-dant in our phytoplankton communities, their selec-tive removal by copepods could release diatoms from grazing pressure. However, since different effects in different nutrient supply conditions were observed in our experiments (Fig. 2), mechanisms other than trophic cascades must have played a role in stimulat-ing phytoplankton growth.
Another process that may have promoted phyto-plankton growth in the zoophyto-plankton treatments is the supply of trace metals through zooplankton excre-tions. Although the input of trace metals in coastal areas might be high, iron was found to limit phyto-plankton growth even in nutrient-rich upwelling regions (Fe up to 3 nmol l−1, Hutchins & Bruland
1998). It is known that zooplankton release trace metals (Fowler 1977, Masuzawa et al. 1988) that stimulate phytoplankton growth (Coale et al. 1996, Boyd et al. 2000). For example, Sarthou et al. (2008) showed that copepod grazing has a significant influ-ence on iron recycling, and hinflu-ence its residinflu-ence time in the water, and in turn, on phytoplankton produc-tivity. However, it is doubtful that concentrations up to 100 nmol l−1total dissolved iron, as in the Bay of
Brest (Laes et al. 2005), are still limiting primary pro-ductivity. Nevertheless, trace metals also appear to influence the uptake and assimilation of macronutri-ents in phytoplankton (Wu et al. 2000, Wang & Dei 2001, Wang 2002). Therefore, the release of trace metals other than iron in the zooplankton treatments through nutrient recycling could have supported phytoplankton biomass growth, by promoting the assimilation of the required macronutrients N and P. As phytoplankton biomass almost doubled under some nutrient conditions in the zooplankton treat-ments, an increased nutrient use efficiency is possi-ble since under zooplankton grazing only a fraction of digested nutrients is excreted and made available for the build-up of new phytoplankton biomass.
The most prominent result of our experiments was that highest total phytoplankton abundances were observed in zooplankton treatments and differed among nutrient supply conditions. This can only be explained if consumer-driven nutrient recycling comes into consideration as a driving factor for the different total phytoplankton abundances, since effects of trophic cascades or micronutrient release should be comparable under all nutrient conditions. The results indicate better phytoplankton fertilisa-tion by nutrient recycling under N-enriched condi-tions in the copepod treatments, and under P-enriched conditions in the rotifer treatments (Fig. 2). Differences become apparent when comparing N ex -cess with P ex-cess conditions: phytoplankton bio-masses in the copepod treatments significantly exceeded those in the rotifer treatments under N excess (Fig. 2), and vice versa under P excess. These results can only be explained by differences in con-sumer-driven nutrient recycling, with respect to growth rate differences of the 2 zooplankton groups. Since copepods have a lower growth rate compared to rotifers (Allan 1976), they should require less P and excrete more P. Thus, under N-rich conditions, P scarcity could be compensated by the Prich ex -cretions of copepods, consequently stimulating phytoplankton growth and biomass accumulation. P ex cretion of a copepod-dominated zooplankton community has been estimated to account for 15 to 20% of the primary production requirements in the north-western Mediterranean Sea, with seasonal peaks up to 90% (Gaudy et al. 2003). Increased P release by herbivorous zooplankton was also sug-gested as a reason for increased primary productivity by model results published by Nugraha et al. (2010). Interestingly, nutrient limitation assays show P limi-tation of phytoplankton under N excess conditions (Table 2), which is not evident by the stoichiometry of 103:16:1 (Table 3) and may be related to higher growth rates under N excess than under Redfield conditions (Fig. 3). In contrast to the copepod treat-ments, phytoplankton in the rotifer treatments reached the highest biomass and growth under P ex -cess conditions (Fig. 2d). Rotifers have higher growth rates than copepods (Allan 1976) and an accordingly higher P demand. Therefore, rotifer excretions con-tain low P concentrations (high N:P ratio) and thus do not stimulate phytoplankton growth in systems with P scarcity (N excess) but do it under N scarcity. As observed in our experiments, the relatively higher N concentrations in rotifer excretions seem to have stimulated phytoplankton growth and biomass accu-mulation under P excess conditions (Fig. 2d).
Under P excess conditions, rotifer biomass may also have influenced nutrient recycling. Rothhaupt (1995) found that Brachionus rubens reached highest bio-mass under non P-limited food conditions, while growth rates declined with P-limited food. In our experiments, there is no indication of severe nutrient limitation from phytoplankton N:P stoichiometry (Table 3). However, since we did not monitor the rotifer biomass after the start of the experiments, it is not possible to estimate the excess of P supply through higher rotifer biomass or the amount of P withdrawal through higher growth rates. Neverthe-less, we observed that P availability did play a signif-icant role in our experiments, since the responses of phytoplankton in the nutrient limitation assays were highest under P excess conditions (Fig. 3; same pat-tern for each zooplankton treatment, not shown).
Nutrient limitation patterns
The results of nutrient limitation bioassays indicate NP co-limitation of phytoplankton in the zooplankton treatments for all conditions other than Redfield (Tables 1 & 2). Averaged over all nutrient conditions, the control treatments showed no clear dominance of any limitation type; all frequencies ranged between 20% and 30% (Table 1). This indicates that zooplank-ton in general increased the phytoplankzooplank-ton NP co-limitation and that the macronutrients N and P had a synergistic effect on the phytoplankton communities. Nutrient limitation patterns for marine phytoplank-ton are known to be heterogeneous and may change over time (e.g. Karl et al. 2001b), and phytoplankton appears to be less affected by nutrient limitation in marine than in freshwater environments (Hecky & Kilham 1988). In open oceans, phytoplankton growth is predominantly P limited (Karl 1999, Wu et al. 2000, Hannides et al. 2009, Weber & Deutsch 2010), where -as in co-astal are-as, it is mainly N limited (Ryther & Dunstan 1971, Beman et al. 2005) or subject to sea-sonally changing nutrient limitation (Delmas et al. 1983, Fisher et al. 1992, Del Amo et al. 1997). How-ever, metadata analyses have revealed combined NP co-limitation as the most abundant nutrient limitation type in both terrestrial and aquatic environments (Elser et al. 1990, 2007, Harpole et al. 2011). These studies imply that combined NP addition has the highest synergistic effects on phytoplankton growth, which coincides with our findings and seems espe-cially promoted by zooplankton.
Besides the dominance of NP co-limitation in our study, the data showed trends of increasing P
limita-tion in the copepod treatments and decreasing N limi tation in the rotifer treatments with increasing N supply ratio (Table 2). Single nutrient limitation was only found in 1 case (P limitation in copepod treat-ments under N excess; Table 2). The nutrient limita-tion patterns of phytoplankton influenced by zoo-plankton nutrient recycling are dependent on zooplankton densities and incubation time. Com-pared to other mesocosm experiments (Sommer et al. 2001, 2004), the zooplankton densities employed in our experiment fall within the lower range. Higher zooplankton densities would certainly increase the nutrient recycling effect, and force phytoplankton into single nutrient limitation more quickly.
Concerning the incubation time, the increased phytoplankton biomass in the zooplankton treat-ments indicates a significant influence of zooplank-ton during the 5 d incubation. In coastal pelagic envi-ronments such as the Bay of Biscay, high temporal and spatial small-scale variability of plankton is commonly observed (e.g. Koutsikopoulos & LeCann 1996). Our applied incubation time of 5 d without dis-turbance is already an optimistic value for the inves-tigation of ecologically reasonable short-term effects of zooplankton on phytoplankton growth.
Another reason for the few cases of single nutrient limitation of phytoplankton in the presence of zoo-plankton may be related to the similar phytozoo-plankton stoichiometry under all applied nutrient conditions. Phytoplankton biomass N:P ratios showed a conserv-ative relationship compared to the initial N:P supply conditions (Table 3). Despite the range of fertilisation from 5:1 to 48:1 dissolved N:P, phytoplankton bio-mass N:P ratios did not reflect these nutrient condi-tions. The stoichiometry of our phytoplankton com-munities differed from the classical Redfield ratio, and were more similar to the findings of Sterner et al. (2008; our Table 3), who observed an average N:P ratio of 20:1 in particulate matter from a variety of aquatic environments. In terms of nutrient limitation, these stoichiometric ratios do not indicate severe sin-gle nutrient limitation, fitting the overall NP co-limi-tation pattern of our bioassays, and only tend towards weak P limitation of the phytoplankton community. Studies investigating seston C:N:P ratios have indi-cated that nutrient limitation seems less pronounced, and biomass carbon to nutrient stoichiometry less variable in marine than in freshwater seston (Hecky et al. 1993, Sterner et al. 2008). The biomass N:P ratios of marine phytoplankton cultures can range from < 3:1 to > 45:1 under extremely nutrient limiting conditions only, while natural marine particulate matter N:P ratios seem to be far less variable (Geider
& La Roche 2002). According to Geider & La Roche (2002) and Guildford & Hecky (2000), critical ratios of dissolved N and P for nutrient limitation in phyto-plankton growth are found below 10 and above 22 N:P. Model predictions indicate that, depending on ecological conditions, variations in phytoplankton biomass N:P ratios in a range of 8 to 45 may be inter-preted as optimal growth conditions (Klausmeier et al. 2004b). Our results seem to support the predicted modelled ranges, and show that marine phytoplank-ton seem to be mainly NP co-limited in ranges between 5 and 48 N:P.
Besides dissolved nutrient availability, factors that affect the stoichiometric N:P composition of marine phytoplankton include growth rates (Klausmeier et al. 2004a) and genetic disposition (Quigg et al. 2003). Highly taxon-specific biochemical requirements are reflected in the N:P ratios of phytoplankton biomass (Rhee & Gotham 1980, Hecky & Kilham 1988, Geider & La Roche 2002, Quigg et al. 2003, Lagus et al. 2004), and influence the dissolved nutrient distribution in the oceans (Weber & Deutsch 2010). Experiments have shown that the phytoplankton N:P ratio de-creases with increasing growth rate (Goldman et al. 1979). Models suggest that under high growth rates, phytoplankton assimilate nutrients in the ratio they require, while changes in the phytoplankton N:P ratio may only occur after a threshold in dissol ved N and P availability is exceeded (Klausmeier et al. 2004a).
Another possible way in which stoichiometric ratios and nutrient limitation patterns of phytoplank-ton might be influenced concerns bacterioplankphytoplank-ton. By competing for dissolved nutrients and changing the relative availability of nutrients, bacteria can promote nutrient limitation of autotrophs (Cherif & Loreau 2009). Under certain circumstances, the influ-ence of bacteria can cause changes in phytoplankton stoichiometry. Danger et al. (2007) have shown that in high N:P growth media (> 95:1), bacteria contri -bute to high C:N ratios in phytoplankton biomass and promote P limitation in phytoplankton growth. Since our plankton communities also contained the natural bacterial populations, their potential influences on the observed limitation patterns cannot be excluded. Since we neither applied very high N:P conditions nor used high zooplankton densities, the obtained results should include only the natural and not an artificially promoted influence of bacteria on the phytoplankton community. The more or less homo -genous stoichiometric ratios of the phytoplankton communities over all applied nutrient conditions (with or without zooplankton) may suggest that a process smoothened potential stoichiometric
differ-ences between the different N:P conditions (Table 3). This process may be related to bacterioplankton nutrient competition and nutrient recycling.
We conclude that zooplankton exerts most influ-ence on the nutrient limitation patterns in our exper-iment by nutrient recycling, leading to NP co-limita-tion in phytoplankton communities. Trophic cascade effects including bacteria and dinoflagellates could have amplified the observed differences in total phytoplankton biomass between treatments. Nutri-ent recycling by bacterioplankton and the genetic disposition of phytoplankton may be responsible for the homogeneous phytoplankton stoichiometry over all applied nutrient conditions.
Implications
Our findings suggest a strong impact of herbivo-rous zooplankton on phytoplankton productivity and biomass even at low zooplankton densities. In rela-tively nutrient-rich environments, such as our meso-cosm experiments or in coastal areas (Elser et al. 1990, 2007), the nutrient recycling of zooplankton seems to lead to nutrient co-limitation patterns. How-ever, this might not be valid in extreme nutrient-poor marine regions, such as subtropical gyres, which oc cupy approximately 40% of the earth’s surface (Polo -vina et al. 2008). In such ecosystems, the near-surface concentrations of below 100 nmol for both inorganic N and P in the euphotic zones (Karl 1999, Karl et al. 2001a) indicate that phytoplankton growth is severely nutrient limited (e.g. Wu et al. 2000, Karl et al. 2001b, Moutin et al. 2005), with zooplankton hav-ing a measurable influence on nutrient availability (e.g. Corner & Davies 1971, LeBorgne 1982, Stein-berg et al. 2002, Hannides et al. 2009). Therefore, in nutrient-poor marine regions, zooplankton might drive phytoplankton communities into single nutrient limitation, rather than nutrient co-limitation. For example, Hannides et al. (2009) showed that the active export of P from the euphotic zone by excre-tions of migrant zooplankton has the same magni-tude as the passive export of P through the settle-ment of particles in the North Pacific Gyre. The same effect of P removal appears to hold for fish: their high demands for P can influence nutrient dynamics even in nutrient-rich regions (Hjerne & Hansson 2002) and may influence nutrient limitation patterns for phyto-plankton through storage of P, mostly in fish bones, and low P recycling (Czamanski et al. 2011). Thus, active P removal from other trophic levels would cer-tainly aggravate P scarcity and limitation of
phyto-plankton communities, and influence primary pro-duction. To begin with, further experimental investi-gations should include the effects of zooplankton on nutrient limitation patterns in nutrient-poor environ-ments to obtain more insights into the influence of zooplankton nutrient recycling on phytoplankton communities.
Acknowledgements. We thank A. Wild and A. Weigert for
technical support, L. Rinkenauer for help in the laboratory, T. Hansen for the supply of copepod eggs and Oceanopolis, Brest, for the supply of rotifers. We acknowledge the com-ments of 3 anonymous referees, which helped improve the manuscript. This project was financed by GIS Europole Mer. G.T. received financial support from the Departmental Council of Finistère, France, and M.S. from the Departmen-tal Council of Vendée, France.
LITERATURE CITED
Allan JD (1976) Life-history patterns in zooplankton. Am Nat 110: 165−180
Andersen T, Hessen DO (1991) Carbon, nitrogen, and phos-phorus-content of fresh-water zooplankton. Limnol Ocea nogr 36: 807−814
Beman JM, Arrigo KR, Matson PA (2005) Agricultural runoff fuels large phytoplankton blooms in vulnerable areas of the ocean. Nature 434: 211−214
Boyd PW, Watson AJ, Law CS, Abraham ER and others (2000) A mesoscale phytoplankton bloom in the polar southern ocean stimulated by iron fertilization. Nature 407: 695−702
Brzezinski MA, Baines SB, Balch WM, Beucher CP and oth-ers (2011) Co-limitation of diatoms by iron and silicic acid in the equatorial pacific. Deep-Sea Res II 58: 493−511 Chen M, Liu H (2011) Experimental simulation of trophic
interactions among omnivorous copepods, heterotrophic dinoflagellates and diatoms. J Exp Mar Biol Ecol 403: 65−74
Cherif M, Loreau M (2009) When microbes and consumers determine the limiting nutrient of autotrophs: a theoreti-cal analysis. Proc Biol Sci 276: 487−497
Coale KH, Johnson KS, Fitzwater SE, Gordon RM and others (1996) A massive phytoplankton bloom induced by an ecosystem-scale iron fertilization experiment in the equa torial Pacific Ocean. Nature 383: 495−501
Copin-Montegut C, Copin-Montegut G (1983) Stoichiome-try of carbon, nitrogen, and phosphorus in marine partic-ulate matter. Deep-Sea Res I 30: 31−46
Corner EDS, Davies AG (1971) Plankton as a factor in nitro-gen and phosphorus cycles in sea. Adv Mar Biol 9: 101−204
Czamanski M, Nugraha A, Pondaven P, Lasbleiz M and oth-ers (2011) Carbon, nitrogen and phosphorus elemental stoichiometry in aquacultured and wild-caught fish and consequences for pelagic nutrient dynamics. Mar Biol 158:2847–2862
Danger M, Oumarou C, Benest D, Lacroix G (2007) Bacteria can control stoichiometry and nutrient limitation of phyto plankton. Funct Ecol 21: 202−210
Del Amo Y, Le Pape O, Treguer P, Queguiner B, Menesguen A, Aminot A (1997) Impacts of high-nitrate freshwater
➤
➤
➤
➤
➤
➤
➤
➤
➤
➤
➤
➤
➤
➤
➤
➤
➤
inputs on macrotidal ecosystems. I. Seasonal evolution of nutrient limitation for the diatom-dominated phyto-plankton of the Bay of Brest (France). Mar Ecol Prog Ser 161: 213−224
Delmas R, Hafsaoui M, Le Jehan S, Quéguiner B, Tréguer P (1983) Impact de fertilisations à forte variabilité saison-nière et annuelle sur le phytoplancton d’un écosystème eutrophe. Oceanologica Acta Actes 17e Symposium Européen de Biologie Marine, Brest, p 81−85
Diehl S (2002) Phytoplankton, light, and nutrients in a gradi-ent of mixing depths: theory. Ecology 83: 386−398 Elser JJ, Hassett RP (1994) A stoichiometric analysis of the
zooplankton−phytoplankton interaction in marine and freshwater ecosystems. Nature 370: 211−213
Elser JJ, Urabe J (1999) The stoichiometry of consumer-dri-ven nutrient recycling: theory, observations, and conse-quences. Ecology 80: 735−751
Elser JJ, Elser MM, Mackay NA, Carpenter SR (1988) Zoo-plankton-mediated transitions between N-limited and P-limited algal growth. Limnol Oceanogr 33: 1−14
Elser J, Marzolf E, Goldman C (1990) Phosphorus and nitro-gen limitation of phytoplankton growth in the freshwa-ters of North America: a review and critique of experi-mental enrichments. Can J Fish Aquat Sci 47: 1468−1477. doi: 10.1139/f90-165
Elser JJ, Bracken MES, Cleland EE, Gruner DS and others (2007) Global analysis of nitrogen and phosphorus limi-tation of primary producers in freshwater, marine and terrestrial ecosystems. Ecol Lett 10: 1135−1142
Fisher TR, Peele ER, Ammerman JW, Harding LW (1992) Nutrient limitation of phytoplankton in Chesapeake Bay. Mar Ecol Prog Ser 82: 51−63
Fowler SW (1977) Trace-elements in zooplankton particu-late products. Nature 269: 51−53
Gaudy R, Youssara F, Diaz F, Raimbault P (2003) Biomass, metabolism and nutrition of zooplankton in the Gulf of Lions (NW Mediterranean). Oceanol Acta 26: 357−372 Geider RJ, La Roche J (2002) Redfield revisited: variability of
C: N: P in marine microalgae and its biochemical basis. Eur J Phycol 37: 1−17
Gilbert JJ, Jack JD (1993) Rotifers as predators on small ciliates. Hydrobiologia 255−256: 247−253
Gismervik I (1997) Stoichiometry of some marine planktonic crustaceans. J Plankton Res 19: 279−285
Goldman JC, McCarthy JJ, Peavey DG (1979) Growth-rate influence on the chemical composition of phytoplankton in oceanic waters. Nature 279: 210−215
Guildford SJ, Hecky RE (2000) Total nitrogen, total phos-phorus, and nutrient limitation in lakes and oceans: is there a common relationship? Limnol Oceanogr 45: 1213−1223
Hannides CCS, Landry MR, Benitez-Nelson CR, Styles RM, Montoya JP, Karl DM (2009) Export stoichiometry and migrant-mediated flux of phosphorus in the North Pacific Subtropical Gyre. Deep-Sea Res I 56: 73−88
Harpole WS, Ngai JT, Cleland EE, Seabloom EW and others (2011) Nutrient co-limitation of primary producer com-munities. Ecol Lett 14: 852−862
Hassett RP, Cardinale B, Stabler LB, Elser JJ (1997) Ecologi-cal stoichiometry of N and P in pelagic ecosystems: com-parison of lakes and oceans with emphasis on the zoo-plankton−phytoplankton interaction. Limnol Oceanogr 42: 648−662
Healey FP (1985) Interacting effects of light and nutrient limitation on the growth-rate of Synechococcus linearis
(Cyanophyceae). J Phycol 21: 134−146
Hecky RE, Kilham P (1988) Nutrient limitation of phyto-plankton in freshwater and marine environments: A review of recent evidence on the effects of enrichment. Limnol Oceanogr 33: 796−822
Hecky RE, Campbell P, Hendzel LL (1993) The stoichiome-try of carbon, nitrogen, and phosphorus in particulate matter of lakes and oceans. Limnol Oceanogr 38: 709−724 Hessen DO, Agren GI, Anderson TR, Elser JJ, De Ruiter PC (2004) Carbon sequestration in ecosystems: the role of stoichiometry. Ecology 85: 1179−1192
Hjerne O, Hansson S (2002) The role of fish and fisheries in Baltic Sea nutrient dynamics. Limnol Oceanogr 47: 1023–1032
Hutchins DA, Bruland KW (1998) Iron-limited diatom growth and Si: N uptake ratios in a coastal upwelling regime. Nature 393: 561−564
Karl DM (1999) A sea of change: Biogeochemical variability in the North Pacific Subtropical Gyre. Ecosystems (N Y) 2: 181−214
Karl DM, Bjorkman KM, Dore JE, Fujieki L and others (2001a) Ecological nitrogen-to-phosphorus at station ALOHA. Deep-Sea Res Part II 48: 1529−1566
Karl DM, Bidigare RR, Letelier RM (2001b) Long-term changes in plankton community structure and produc -tivity in the North Pacific Subtropical Gyre: The domain shift hypothesis. Deep-Sea Res II 48: 1449−1470
Klausmeier CA, Litchman E, Levin SA (2004a) Phytoplank-ton growth and stoichiometry under multiple nutrient limitation. Limnol Oceanogr 49: 1463−1470
Klausmeier CA, Litchman E, Daufresne T, Levin SA (2004b) Optimal nitrogen-to-phosphorus stoichiometry of phyto-plankton. Nature 429: 171−174
Koutsikopoulos C, LeCann B (1996) Physical processes and hydrological structures related to the Bay of Biscay anchovy. Sci Mar 60: 9−19
Laes A, Vuillemin R, Leilde B, Sarthou G, Bournot-Marec C, Blain S (2005) Impact of environmental factors on in situ determination of iron in seawater by flow injection analysis. Mar Chem 97: 347−356
Lagus A, Suomela J, Weithoff G, Heikkila K, Helminen H, Sipura J (2004) Species-specific differences in phyto-plankton responses to N and P enrichments and the N: P ratio in the Archipelago Sea, northern Baltic Sea. J Plankton Res 26: 779−798
LeBorgne R (1982) Zooplankton production in the eastern tropical Atlantic Ocean: Net growth efficiency and P: B in terms of carbon, nitrogen, and phosphorus. Limnol Oceanogr 27: 681−698
Main TM, Dobberfuhl DR, Elser JJ (1997) N: P stoichiometry and ontogeny of crustacean zooplankton: A test of the growth rate hypothesis. Limnol Oceanogr 42: 1474−1478 Masuzawa T, Koyama M, Terazaki M (1988) A regularity in trace-element contents of marine zooplankton species. Mar Biol 97: 587−591
Moutin T, Van Den Broeck N, Beker B, Dupouy C, Rimmelin P, Le Bouteiller A (2005) Phosphate availability controls
Trichodesmium spp. biomass in the SW Pacific Ocean.
Mar Ecol Prog Ser 297: 15−21
Nugraha A, Pondaven P, Treguer P (2010) Influence of con-sumer-driven nutrient recycling on primary production and the distribution of N and P in the ocean. Biogeo-sciences 7: 1285−1305
Polovina JJ, Howell EA, Abecassis M (2008) Ocean’s least productive waters are expanding. Geophys Res Lett 35:
➤
➤
➤
➤
➤
➤
➤
➤
➤
➤
➤
➤
➤
➤
➤
➤
➤
➤
➤
➤
➤
➤
➤
➤
➤
➤
➤
➤
➤
➤
➤
➤
➤
➤
➤
➤
➤
➤
➤
L03618. doi: 10.1029/2007/GL031745
Quigg A, Finkel ZV, Irwin AJ, Rosenthal Y and others (2003) The evolutionary inheritance of elemental stoichiometry in marine phytoplankton. Nature 425: 291−294
Redfield AC (1958) The biological control of chemical factors in the environment. Am Sci 46: 205−221
Rhee G, Gotham I (1980) Optimum N: P ratios and coexis-tence of planktonic algae. J Phycol 16: 486−489
Rothhaupt KO (1995) Algal nutrient limitation affects rotifer growth rate but not ingestion rate. Limnol Oceanogr 40: 1201−1208
Ryther JH, Dunstan WM (1971) Nitrogen, phosphorus, and eutrophication in coastal marine environments. Science 171: 1008−1013
Sañudo-Wilhelmy SA, Kustka AB, Gobler CJ, Hutchins DA and others (2001) Phosphorus limitation of nitrogen fixa-tion by Trichodesmium in the central Atlantic Ocean. Nature 411: 66−69
Sarthou G, Vincent D, Christaki U, Obernosterer I, Timmer-mans KR, Brussaard CPD (2008) The fate of biogenic iron during a phytoplankton bloom induced by natural fertili-sation: Impact of copepod grazing. Deep-Sea Res II 55: 734−751
Schindler DW (1977) Evolution of phosphorus limitation in lakes. Science 195: 260−262
Sommer F (2003) A comparison of the impact of major meso-zooplankton taxa on marine, brackish and freshwater phyto plankton during summer. PhD thesis, Christian-Albrechts-Universität Kiel
Sommer U, Sommer F, Santer B, Jamieson C, Boersma M, Becker C, Hansen T (2001) Complementary impact of copepods and cladocerans on phytoplankton. Ecol Lett 4: 545−550
Sommer U, Sommer F, Feuchtmayr H, Hansen T (2004) The influence of mesozooplankton on phytoplankton nutrient limitation: A mesocosm study with northeast Atlantic plankton. Protist 155: 295−304
Steinberg DK, Goldthwait SA, Hansell DA (2002) Zooplank-ton vertical migration and the active transport of dis-solved organic and inorganic nitrogen in the Sargasso Sea. Deep-Sea Res I 49: 1445−1461
Stemberger RS, Miller EK (1998) A zooplankton-N: P-ratio indicator for lakes. Environ Monit Assess 51: 29−51 Sterner RW (1990) The ratio of nitrogen to phosphorus re
-supplied by herbivores: zooplankton and the algal com-petitive arena. Am Nat 136: 209−229
Sterner RW, Hessen DO (1994) Algal nutrient limitation and the nutrition of aquatic herbivores. Annu Rev Ecol Syst 25: 1−29
Sterner RW, Elser JJ, Hessen DO (1992) Stoichiometric rela-tionships among producers, consumers and nutrient cycling in pelagic ecosystems. Biogeochemistry 17: 49−67 Sterner RW, Elser JJ, Fee EJ, Guildford SJ, Chrzanowski TH (1997) The light: nutrient ratio in lakes: The balance of energy and materials affects ecosystem structure and process. Am Nat 150: 663−684
Sterner RW, Andersen T, Elser JJ, Hessen DO, Hood JM, McCauley E, Urabe J (2008) Scale-dependent carbon: nitrogen: phosphorus seston stoichiometry in marine and freshwaters. Limnol Oceanogr 53: 1169−1180
Tamminen T, Andersen T (2007) Seasonal phytoplankton nutrient limitation patterns as revealed by bioassays over Baltic Sea gradients of salinity and eutrophication. Mar Ecol Prog Ser 340: 121−138
Touratier F, Field JG, Moloney CL (2001) A stoichiometric model relating growth substrate quality (C: N: P ratios) to N: P ratios in the products of heterotrophic release and excretion. Ecol Modell 139: 265−291
Tyrrell T (1999) The relative influences of nitrogen and phosphorus on oceanic primary production. Nature 400: 525−531
Urabe J (1993) N-cycling and P-cycling coupled by grazers’ activities: Food quality and nutrient release by zooplank-ton. Ecology 74: 2337−2350
Walve J, Larsson U (1999) Carbon, nitrogen and phosphorus stoichiometry of crustacean zooplankton in the Baltic Sea: Implications for nutrient recycling. J Plankton Res 21: 2309−2321
Wang WX (2002) Interactions of trace metals and different marine food chains. Mar Ecol Prog Ser 243: 295−309 Wang WX, Dei RCH (2001) Biological uptake and
assimila-tion of iron by marine plankton: influences of macronu-trients. Mar Chem 74: 213−226
Weber TS, Deutsch C (2010) Ocean nutrient ratios governed by plankton biogeography. Nature 467: 550−554 Wu J, Sunda W, Boyle EA, Karl DM (2000) Phosphate
deple-tion in the western North Atlantic Ocean. Science 289: 759−762
Editorial responsibility: Graham Savidge, Portaferry, UK
Submitted: May 23, 2011; Accepted: November 15, 2011 Proofs received from author(s): March 1, 2012