HAL Id: hal-00302427
https://hal.archives-ouvertes.fr/hal-00302427
Submitted on 17 Jan 2007HAL is a multi-disciplinary open access
archive for the deposit and dissemination of sci-entific research documents, whether they are pub-lished or not. The documents may come from teaching and research institutions in France or abroad, or from public or private research centers.
L’archive ouverte pluridisciplinaire HAL, est destinée au dépôt et à la diffusion de documents scientifiques de niveau recherche, publiés ou non, émanant des établissements d’enseignement et de recherche français ou étrangers, des laboratoires publics ou privés.
Concentrations and fluxes of aerosol particles during the
LAPBIAT measurement campaign in Värriö field station
T. M. Ruuskanen, M. Kaasik, P. P. Aalto, U. Hõrrak, M. Vana, M.
Mårtensson, Y. J. Yoon, P. Keronen, G. Mordas, D. Ceburnis, et al.
To cite this version:
T. M. Ruuskanen, M. Kaasik, P. P. Aalto, U. Hõrrak, M. Vana, et al.. Concentrations and fluxes of aerosol particles during the LAPBIAT measurement campaign in Värriö field station. Atmospheric Chemistry and Physics Discussions, European Geosciences Union, 2007, 7 (1), pp.709-751. �hal-00302427�
ACPD
7, 709–751, 2007 Concentrations and fluxes of aerosols, LAPBIAT campaign T. M. Ruuskanen et al. Title Page Abstract Introduction Conclusions References Tables Figures ◭ ◮ ◭ ◮ Back CloseFull Screen / Esc
Printer-friendly Version
Interactive Discussion
EGU Atmos. Chem. Phys. Discuss., 7, 709–751, 2007
www.atmos-chem-phys-discuss.net/7/709/2007/ © Author(s) 2007. This work is licensed
under a Creative Commons License.
Atmospheric Chemistry and Physics Discussions
Concentrations and fluxes of aerosol
particles during the LAPBIAT
measurement campaign in V ¨arri ¨o field
station
T. M. Ruuskanen1, M. Kaasik2, P. P. Aalto1, U. H ˜orrak2, M. Vana1,2, M. M ˚artensson3, Y. J. Yoon4, P. Keronen1, G. Mordas1, D. Ceburnis4, E. D. Nilsson3, C. O’Dowd4, M. Noppel2, T. Alliksaar5, J. Ivask5, M. Sofiev6, M. Prank2, and M. Kulmala1
1
University of Helsinki, Dept. of Physical Sciences, P.O. Box 64, 00014 University of Helsinki, Finland
2
Institute of Environmental Physics, University of Tartu, Tartu, Estonia 3
Department of Applied Environmental Science, Stockholm University, Stockholm, Sweden 4
Department of Experimental Physics, National University of Ireland, Galway, Ireland 5
Institute of Geology, Tallinn University of Technology, Tallinn, Estonia 6
Air Quality Research, Finnish Meteorological Institute, Finland
Received: 21 November 2006 – Accepted: 8 January 2006 – Published: 17 January 2007 Correspondence to: T. M. Ruuskanen (taina.ruuskanen@helsinki.fi)
ACPD
7, 709–751, 2007 Concentrations and fluxes of aerosols, LAPBIAT campaign T. M. Ruuskanen et al. Title Page Abstract Introduction Conclusions References Tables Figures ◭ ◮ ◭ ◮ Back CloseFull Screen / Esc
Printer-friendly Version
Interactive Discussion Abstract
The LAPBIAT measurement campaign took place in the SMEAR I measurement station located in Eastern Lapland in the spring of 2003 between 26 April and 11 May. In this paper we describe the measurement campaign, concentrations and fluxes of aerosol particles, air ions and trace gases, paying special attention to an aerosol particle
for-5
mation event broken by a polluted air mass approaching from industrial areas of Kola Peninsula, Russia. Aerosol particle number flux measurements show strong downward fluxes during that time. Concentrations of coarse aerosol particles were high for 1–2 days before the nucleation event (i.e. 28–29 April), very low immediately before and during the observed aerosol particle formation event (30 April) and increased
moder-10
ately from the moment of sudden break of the event. In general particle deposition measurements based on snow samples show the same changes. Measurements of the mobility distribution of air ions showed elevated concentrations of intermediate air ions during the particle formation event. We estimated the growth rates in the nucle-ation mode size range. For particles<10 nm, the growth rate increases with size on
15
30 April. Dispersion modelling made with model SILAM support the conclusion that the nucleation event was interrupted by an outbreak of sulphate-rich air mass in the evening of 30 April that originated from the industry at Kola Peninsula, Russia. The re-sults of this campaign highlight the need for detailed research in atmospheric transport of air constituents for understanding the aerosol dynamics.
20
1 Introduction
Atmospheric aerosols have a large impact on the radiative balance and climate both directly, by scattering sun light back to space, and indirectly, by acting as cloud con-densation nuclei (CCN) and changing the albedo and life time of clouds (Charlson and Wigley, 1994). Estimating the impact of aerosols on climate is especially difficult since
25
ACPD
7, 709–751, 2007 Concentrations and fluxes of aerosols, LAPBIAT campaign T. M. Ruuskanen et al. Title Page Abstract Introduction Conclusions References Tables Figures ◭ ◮ ◭ ◮ Back CloseFull Screen / Esc
Printer-friendly Version
Interactive Discussion
EGU of aerosols and aerosol properties vary significantly in space and time. New aerosol
particle formation has been observed in different types of environments in free tropo-sphere (Clarke, 1992 and Schr ¨oder and Str ¨om, 1997), in the marine boundary layer (O’Dowd, 2002a), in Arctic areas (Pirjola et al., 1998), in urban areas (Kerminen and Wexler, 1996), in boreal forest (M ¨akel ¨a et al., 1997; Tunved et al., 2003) and in
rela-5
tion to air ion formation events (Vana et al., 2004). A recent overview (Kulmala et al., 2004a) summarise observations.
Formation of new aerosol particles is observed 60–120 times a year in southern (Kulmala et al., 2001 and Dal Maso et al., 2005) and 25–60 times in northern Finland (Komppula et al., 2003, 2006 and Vehkam ¨aki et al., 2004). It has been suggested
10
that formation and growth are two separate processes and involve different gas phase species taking part in them. Formation of new aerosol particles has been suggested to result from binary nucleation of H2SO4and H2O (Kulmala et al., 1998) or ternary nucle-ation of H2SO4, NH3and H2O (Korhonen et al., 1999). Modelling and experimental re-sults show that ion-induced nucleation can also be considered as possible mechanism
15
for particle generation (Laakso et al., 2004a, b). In many cases, sulphuric acid plays a role in new particle formation (Kulmala et al., 2006a). However some special cases, such as in deep convective clouds, atmospheric nucleation can occur without sulphuric acid (Kulmala et al., 2006b). Kulmala et al. (2000) suggested that nucleation occurs almost everywhere in the atmosphere during daytime but, as it results in aerosol
parti-20
cles smaller than the detectable size, we cannot observe it without subsequent growth. Growth of newly formed aerosol particles in boreal forest has been suggested to be due to heterogeneous nucleation and condensation from the emitted biogenic volatile or-ganic compounds (BVOC’s) or their oxidation products. Boreal forests are one possible source of BVOC’s that can be oxidized to less volatile species. For example terpenoids
25
are emitted from coniferous forests, especially in the spring and summer (Hakola et al., 2003). In the Northern hemisphere solar radiation is high in spring and there is a spring time maximum in the ozone concentration in unpolluted northern areas (Logan et al., 1985) that is also observed in Finnish Lapland (Ruuskanen et al., 2003) leading
ACPD
7, 709–751, 2007 Concentrations and fluxes of aerosols, LAPBIAT campaign T. M. Ruuskanen et al. Title Page Abstract Introduction Conclusions References Tables Figures ◭ ◮ ◭ ◮ Back CloseFull Screen / Esc
Printer-friendly Version
Interactive Discussion to effectively oxidizing conditions. Oxidation products of several terpenoids have been
identified from aerosols, of e.g. isoprene (Clayes et al., 2004, Kourtchev et al., 2005), monoterpenes (O’Dowd et al., 2002), and sesquiterpenes (Bonn and Mootgard, 2003). O’Dowd et al. (2002b) state that compounds, such as cis-pinonic acid and pinic acid, that are oxidation products of monoterpenes, participate in the growth of new aerosol
5
particles.
A lot of research has focused on characterising the aerosol particle formation events and the parameters that control observed new aerosol particle formation (Kulmala et al., 1998; M ¨akel ¨a et al., 2000; Buzorius et al., 2001 and Boy et al., 2002). Several field studies have concentrated on observations of the formation and growth of newly
10
formed aerosol particles in Southern Finland (Kulmala et al., 2001). Also involvement of air ions in new aerosol particle events has been studied (Laakso et al., 2004b). The understanding of aerosol particle formation events has increased, but the processes involved are still not fully understood. Chemical conditions are more confined in North-ern Finland. There are less anthropogenic sources and these are easy to identify,
15
share of local diffuse background sources is negligible and often well-defined plumes are formed. In fact, three different influencing source areas can be defined for Finnish Lapland: Kola Peninsula, continental Europe and marine. The effect can be seen in trace gas concentrations as well as aerosol number concentration (Ruuskanen et al., 2003) and scattering coefficient (Virkkula et al., 1997). Also a recent modelling study
20
(Komppula et al., 2006) has focussed on those effects.
LAPBIAT (Lapland Atmosphere-Biosphere facility) measurement campaign took place in the SMEAR I measurement station located in Eastern Lapland in the spring of 2003 between 26 April and 11 May. LAPBIAT is an EU programs and its goal is to enhance the international scientific co-operation at the Finnish Arctic research stations
25
involved in the program. During this LAPBIAT campaign the variation of the concen-tration of aged aerosols of anthropogenic origin as well as formation and growth of aerosol particles in sub-arctic boreal area was studied with versatile aerosol particle and air ion size distribution measurements supported by deposition studies based on
ACPD
7, 709–751, 2007 Concentrations and fluxes of aerosols, LAPBIAT campaign T. M. Ruuskanen et al. Title Page Abstract Introduction Conclusions References Tables Figures ◭ ◮ ◭ ◮ Back CloseFull Screen / Esc
Printer-friendly Version
Interactive Discussion
EGU aerosol fluxes and snow chemistry. Trace gases (SO2 and O3), aerosol particle
con-centration and meteorological parameters were continuously measured since 1992 in SMEAR I -station (Station for Measuring Forest Ecosystem – Atmosphere Relation) located in Northern Lapland. Several other measurements like NOx and aerosol size distribution, to name a few, were started later. The aim of this work is to study closely
5
two weeks during spring, when the aerosol particle formation events occur most fre-quently and to look at a specific aerosol particle formation event, which was interrupted by a pollution event, in detail.
2 Experimental
2.1 Location
10
The SMEAR I (Station for Measuring Forest Ecosystem – Atmosphere Relation) sta-tion (69◦46′N, 29◦35′E) (Hari et al., 1994) is located in V ¨arri ¨o nature park in eastern Lapland, less than ten kilometres from the border of Russia. The measurements were made from different heights of a measurement tower located on top of a hill 390 m above sea level (a.s.l.). The station is located below the alpine timberline (400 m a.s.l.)
15
but it is surrounded by the range of V ¨arri ¨o fjelds above the timberline that continue from north to south. Most of the trees in the surrounding areas are about 50-years-old Scots pines (Pinus Sylvestris L.) and the height of the trees is about eight metres and the mean diameter approximately eight centimetres. The distance from the nearest small road to the station is approximately eight kilometres and from the nearest major
20
road about 100 km. There are no towns or industry close by. Having practically no local pollution gives an opportunity to observe background concentrations and mid- to long-range transport of long-lived pollutants. The nearest major pollution sources are metallurgy factories of Montchegorsk located 150 km east and Nikel located 190 km north from the station. Since anthropogenic emissions come from well-defined sources
25
oppor-ACPD
7, 709–751, 2007 Concentrations and fluxes of aerosols, LAPBIAT campaign T. M. Ruuskanen et al. Title Page Abstract Introduction Conclusions References Tables Figures ◭ ◮ ◭ ◮ Back CloseFull Screen / Esc
Printer-friendly Version
Interactive Discussion tunity to study aerosol formation events, aerosol and air ion dynamics and atmospheric
chemistry in clean and polluted air masses.
2.2 Physical and chemical measurements from air
The continuous trace gas (SO2, NOx, O3), aerosol particle size distribution (DMPS, 8 nm–0.45µm) and number concentration of aerosol particles (CPC, 14 nm–3 µm)
5
alongside with meteorological measurements are described in more detail by Ruuska-nen et al. (2003) and Hari et al. (1994). Details of continuous measurements are in Table 1. More detail aerosol measurements were made during the measurement campaign. Positive and negative air ions were measured with Air Ion Spectrometer (AIS) from size range of 0.46 nm to 41 nm. Aerosol particles were also measured with
10
an Aerodynamic Particle Sizer (APS), Electrical Aerosol Spectrometer (EAS), a Pulse Height Analyser connected to a CPC (PHAUCPC) and different CPCs (e.g. LICPCs). Campaign measurements are summed up in Table 2. Backward trajectories (96 h) were calculated using FNL data on the HYSPLIT4 model for the levels of 500 and 1500 m.
Size segregated aerosol mass and inorganic composition was measured using a
15
Micro-Orifice Uniform Deposit Impactor (MOUDI). The MOUDI uses circular jets to separate particles aerodynamically onto ten impaction stages plus an inlet stage within a range of 0.056–18µm (flow rate 1.8 m3h−1, equivalent aerodynamic cut-off diame-ters at 50% efficiency: 0.056; 0.10; 0.18; 0.32; 0.56; 1.0; 1.8; 3.2; 5.6; 10; 18 µm). The instrument was located in ambient environment with only inlet protected from rain. The
20
inlet of the MOUDI was about 1 m above ground. The MOUDI sample was approxi-mately one week long in order to collect sufficient particulate matter to make accurate gravimetric analysis, owing to low particulate mass in remote arctic atmosphere. The MOUDI impactor was mounted with Al foils, which were preconditioned for 24 h at 35– 40% relative humidity and 20◦C and weighed with a Mettler Toledo micro-balance (1µg
25
sensitivity). After sampling, the Al foils were conditioned again for 24 h and weighed. Fortnightly samples were obtained over the LAPBIAT campaign. As the accumulation and coarse modes were clearly revealed, no inversion technique was used to
pro-ACPD
7, 709–751, 2007 Concentrations and fluxes of aerosols, LAPBIAT campaign T. M. Ruuskanen et al. Title Page Abstract Introduction Conclusions References Tables Figures ◭ ◮ ◭ ◮ Back CloseFull Screen / Esc
Printer-friendly Version
Interactive Discussion
EGU duce continuous spectrum. Inorganic ions (SO2−4 , NO−
3, NH +
4, Cl−, Na+, K+, Ca2+) were determined by ion chromatography (Dionex 2010i, negative ions), atomic emis-sion spectrometry (positive ions) and indophenol-spectrometry for the determination of NH+4. More details could be found in Sopauskiene and Jasineviciene (2006). Each im-pactor sample set included a blank Al foil, which was treated as real sample including
5
handling protocols. Blank values of chemical species were subtracted from samples. 2.3 Eddy covariance flux measurements
An eddy covariance (EC) flux measurement system from Stockholm University was operated in the SMEAR I measurement tower. The EC system consisted of an ultra-sonic anemometer (Gill, model R3) and a CPC (TSI, model 3762) with a lower cut at
10
11 nm diameter. The CPC pulses were counted by a pulse counter, and logged over two analogue voltage channels on the ultrasonic anemometer interface at 20 Hz to-gether with the vertical wind data. The vertical turbulent aerosol number flux<N‘w’>
was then calculated from the aerosol number (N) and the vertical wind (w). The ex-perimental set up and the data treatment was identical to that followed by M ˚artensson
15
et al. (2006), except that we used an improved pulse-analogue converter and did not correct for the limited response time of the CPC. The experimental set up is similar to that used in Hyyti ¨al ¨a (see e.g. Buzorius et al., 2001), except for a more modern anemometer version and a CPC model with larger sampling flow and hence smaller counting error. The aerosol was sampled through a 4.40 m long1/4inch stainless steel
20
tube at a flow of about 8 L min−1 (laminar) with the inlet just below the sonic head. The centre of the sonic head was at 16.40 m above the ground, which is to be considered the measurement height of the fluxes.
2.4 Deposition measurements from snow samples
Deposition measurements were based on the accumulation of chemical and particulate
25
ACPD
7, 709–751, 2007 Concentrations and fluxes of aerosols, LAPBIAT campaign T. M. Ruuskanen et al. Title Page Abstract Introduction Conclusions References Tables Figures ◭ ◮ ◭ ◮ Back CloseFull Screen / Esc
Printer-friendly Version
Interactive Discussion forest and open land and hills and valleys) was taken in the morning and early afternoon
of 27 April from the thin layer of fresh snow. The second series at same sites, plus one extra site, was taken in the morning of 1 May from the clearly distinguishable layer formed during the snowfall of 28–29 April. Thus, both washout and dry deposition during the snowfall up to the sampling time were caught in the same volume. One
5
additional sample close to the SMEAR I station was taken at the afternoon of 29 April, i.e. in the end of the intense snowfall.
The snow samples were melted in plastic bags and stored in plastic bottles for a few weeks until the analysis. Concentrations of anions and cations were measured us-ing ion chromatography. Number concentrations of spheroidal fly-ash particles (larger
10
than 5µm) were determined using a light microscope. Spheroidal fly-ash particles are
specific and chemically inert markers of high-temperature combustion of fossil fuels (Al-liksaar et al., 1998), thus originating from anthropogenic sources: energy production, metal processing and other industrial processes consuming fuels. The snow samples were filtered and particles larger than 5µm were counted.
15
3 Results
3.1 Local and synoptic weather
The campaign took place during typical Lapland late winter weather: alternating sunny and cloudy days, frost during nights and plus degrees during days (Fig. 1). A few days before the beginning of campaign, 20–21 April, heavy thawing occurred, which left a
20
20–30 cm thick hard snow cover on the ground. The next days until 27 April were frosty with minimum of nearly –10◦C at night and maximum temperatures of some 0◦C during midday. Winds at 10–1500 m heights blew permanently from Arctic Ocean, as seen from four day backward trajectories that were calculated using FNL data on the HYSPLIT4 model for several heights (not shown here). During this time, slight sporadic
25
ACPD
7, 709–751, 2007 Concentrations and fluxes of aerosols, LAPBIAT campaign T. M. Ruuskanen et al. Title Page Abstract Introduction Conclusions References Tables Figures ◭ ◮ ◭ ◮ Back CloseFull Screen / Esc
Printer-friendly Version
Interactive Discussion
EGU On 27–28 April a low pressure system passed over Northern Finland. The Arctic air
masses started dipping into southern Finland and later down to St. Petersburg region before arriving to SMEAR I station. At night of 28 April an intense snowfall begun and continued with short breaks until the evening of the next day.
After this last snowfall the daily temperatures got gradually warmer towards the end
5
of the campaign, night minimum was –3◦C and day maximum +9◦C (Fig. 1). On 3 May the wind direction changed to westerly and the Arctic air toured over Scandinavia and on 7–10 May the air arrived again mainly from the Arctic.
3.2 Conditions of the surface layer
Observed upward sensible heat fluxes were highest at daytime of 30 April, about
10
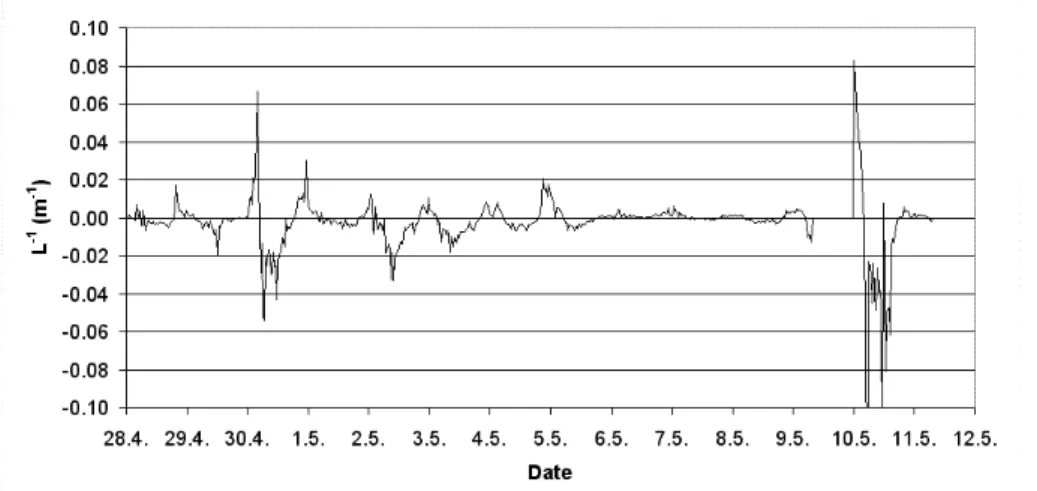
200 W m−2 and more than 100 W m−2 at 3–5, 8 and 10 May. Night-time fluxes were downward, usually up to 50 W m−2, only a few short-time fluctuations exceeded that value. The Monin-Obukhov length (Fig. 2) was under –100 m or over 100 m most of time, thus near-surface stratification was slightly stable at night and slightly unstable at daytime. Remarkable exclusions were 30 April and 10 May, when the stratification
15
changed from strongly stable to strongly unstable. Relatively strong instability occurred at daytime on 2 May and strong instability at night before 5 May.
3.3 Trace gas and aerosol concentrations
In general, concentrations of SO2 and NOx, that are mainly of anthropogenic origin, were below detection limit and 0.5 ppb, respectively (Fig. 3). High concentrations, over
20
4 ppb of SO2 and 2 ppb of NOx, were observed on 30 April and 1 May. Elevated SO2 and NOxconcentration of some 1 ppb were observed around 28–29 April and 10 May. In addition SO2 concentration was 5–10 ppb on 3 May and NOx concentration was elevated up to 2 ppb on 1 May and 6. Ozone concentration was around 40 ppb, except on 29–30 April when it increased up to 60–50 ppb.
25
ACPD
7, 709–751, 2007 Concentrations and fluxes of aerosols, LAPBIAT campaign T. M. Ruuskanen et al. Title Page Abstract Introduction Conclusions References Tables Figures ◭ ◮ ◭ ◮ Back CloseFull Screen / Esc
Printer-friendly Version
Interactive Discussion few hundred particles cm−3 before nucleation events to 10 000 particles cm−3 during
one of the three observed aerosol particle nucleation events (Fig. 3). In general, the aerosol particle concentrations were in the order of some thousands particles cm−3. The total aerosol particle concentrations of all used instruments followed each other, showing pretty consistent results even in the rapidly changing meteorological
condi-5
tions, e.g. in temperature and pressure, of Northern spring.
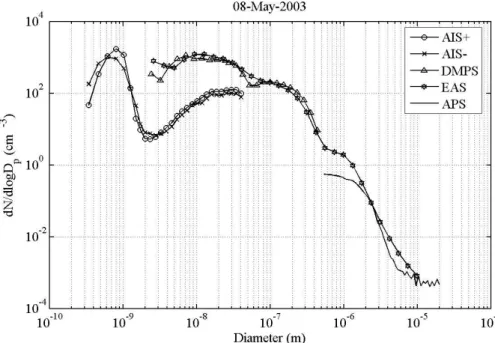
The aerosol particle and air ion size distributions measured using four different in-struments are shown in Fig. 4. Also different size distribution measurements agreed with each other at overlapping sizes. APS was calibrated using MOUDI impactor as part of the campaign objectives. A comparison exercise revealed that APS was
under-10
counting in submicron range and over counted in overµm size range (Fig. 4). In fact
APS model 3320 is not capable of reliably measuring aerosol concentration above 10
µm due to recirculation of particles inside instrument (Stein et al., 2002). The used
instruments, altogether, measured sizes from 0.4 nm to 20 000 nm. This is the widest size range measured so far at subartic conditions.
15
3.4 Coarse aerosol deposition by and to snow
Total snow-sample-based deposition fluxes of major ions and spheroidal particles were clearly higher during the second sample period of 28 April–1 May than during the first period of 22–27 April (Table 3). Consequently, their diurnal deposition was the even much smaller for the first than for the second period (Fig. 5). The diurnal
compar-20
isons show that deposition of chloride (Cl−) is the only strong exception, while ammo-nium (NH+4) does not show significant difference. Concentrations of sodium (Na+) and potassium (K+) in the snow water were close to the detection limit in all snow samples. Only one sample (No 5) represents the short intense snow accumulation period on 28–29 April. The sample shows that most of deposition (except Ca and spheroidal
25
particles) during 28 April–1 May may have occurred already during the first day. The deposition of large (presumably mineral) aerosol particles was calculated based
ACPD
7, 709–751, 2007 Concentrations and fluxes of aerosols, LAPBIAT campaign T. M. Ruuskanen et al. Title Page Abstract Introduction Conclusions References Tables Figures ◭ ◮ ◭ ◮ Back CloseFull Screen / Esc
Printer-friendly Version
Interactive Discussion
EGU on the coarse-particles measured by EAS. According to the lower size limit of detecting
the spheroidal particles in snow samples, the concentrations of aerosol particles in two and a half largest fractions of EAS spectra (5–10µm) were taken into account. In this
size range, gravitation is the dominant deposition mechanism. The gravitational set-tling velocities were calculated from Stokes’ law, assuming spherical shape of aerosol
5
particles and density of 2800 kg m−3 for particulate matter. These selected properties are rather typical for mineral matter, e.g. silicate-rich fly ash.
The first snow sampling period (22–27 April) was from a period before the beginning of the campaign and the start of EAS measurements. We can only compare the later snow samples with the measured aerosol fluxes. The later snow sampling period was
10
assumed to begin nearly at midnight right before 28 April, but EAS measurements are not available until early afternoon of the same day. Thus we used the average of the first 8 h as an approximation the aerosol particle size spectra for the previous night and forenoon hours, which count for about 30% of the accumulation time of snow sample from site no 6 and for about 15% for the other snow samples between 28
15
April–1 May. This way, we estimate the accumulated gravitational deposition from the EAS measurements was 7.5×10⁶ aerosol particles during 28-29 April and 9.7×10⁶ aerosol particles during 28 April–1 May. We estimated the mass deposition fluxes of aerosol particles from the same EAS data (Fig. 6) and obtained deposition values between 0 to 500 ng m−2s−1. Our results show that the spheroidal particles constitute
20
only a minor part (about 0.1%) of total number concentration of aerosol particles in coarse fractions. This is expected, since even oil-shale fly ash, that is characterized by spheroidal particles, contains about 2×10⁵ to 2×10⁶spheroidal particles per gram (Kaasik et al., 2005) which suggest that only 1% or less of aerosol particles are of this type.
25
3.5 Particle formation events
During the two-week campaign, three new aerosol particle formation events were observed. We will focus here on the event that we observed at SMEAR I station
ACPD
7, 709–751, 2007 Concentrations and fluxes of aerosols, LAPBIAT campaign T. M. Ruuskanen et al. Title Page Abstract Introduction Conclusions References Tables Figures ◭ ◮ ◭ ◮ Back CloseFull Screen / Esc
Printer-friendly Version
Interactive Discussion on 30 April, 2003. In the morning of that day, air masses arrived to V ¨arri ¨o from
the Arctic Ocean. At noon the situation changed and while higher altitude (above 1500 m a.s.l.) air masses continued to arrive straight from the Arctic the lower level (below 1500 m a.s.l.) air masses passed through Kola Peninsula. By the evening air masses of both levels had gone through Kola Peninsula on their way to V ¨arri ¨o (Fig. 7).
5
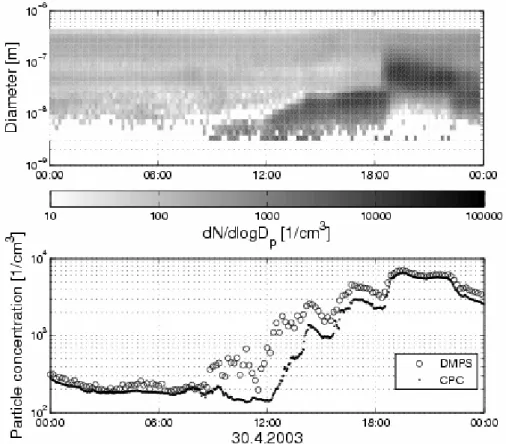
The aerosol particle formation event begun at noon and was interrupted around 06:30 p.m. by a sudden appearance of larger aerosol particles in the size range of 20– 200 nm as can be seen from aerosol particle size distributions measured with DMPS (Fig. 8) and EAS. The difference in number concentration between aerosol particle size distribution measured by DMPS and number concentration measured by CPC
10
TSI 3760 was largest between 09:00 to 12:00 a.m., which supports the suggestion that at that time there was aerosol particle formation and growth of smaller than the 14 nm diameter aerosol particles that can be observed with the aerosol particle num-ber concentration measurements. Small aerosol particles were also observed from the ultrafine aerosol particle measurements made with the PHA-UCPC on from around
15
09:00 a.m. until 02:00 p.m., but not before or later (Fig. 3). The number concentrations from aerosol particle size distribution measured by DMPS and number concentration measurements by CPC TSI 3760 evened up at 06:15 p.m. At the same time around 06:30 p.m. the size distribution maximum moved to clearly towards larger-sized aerosol particles and there was a notable step up in the aerosol particle number concentration.
20
The evolution of the charged fraction of aerosol particles, air ions in the size rage of 1.6–40 nm measured by AIS (Fig. 9), showed the same tendency as aerosol particles (Fig. 8). The generation of new particles followed by the intermediate ion (1.6–7.4 nm) measurements started at about 08:30 displaying the concentration maxima at 09:00 and 13:00 LST. The concentration of negative light intermediate ions (1.6–3.3 nm)
in-25
creases significantly during the nucleation burst, while the positive light intermediate ions stayed nearly at the same low background level. The concentrations of negative and positive intermediate ion in the size range of 3.3–7.4 nm were nearly equal. The ex-cess of the negatively charged fraction is probably a robust indicator of the ion-induced
ACPD
7, 709–751, 2007 Concentrations and fluxes of aerosols, LAPBIAT campaign T. M. Ruuskanen et al. Title Page Abstract Introduction Conclusions References Tables Figures ◭ ◮ ◭ ◮ Back CloseFull Screen / Esc
Printer-friendly Version
Interactive Discussion
EGU nucleation on negative small (cluster) ions. The diurnal variation in the concentration of
small (cluster) ions (diameter 0.46–1.6 nm) displayed a slight maximum around midday. A considerable decrease in the concentration of small ions as a result of the scaveng-ing of small ions by aerosol particles followed after a sudden increase in the number concentration and the mean diameter of the aerosol particles at 18:30.
5
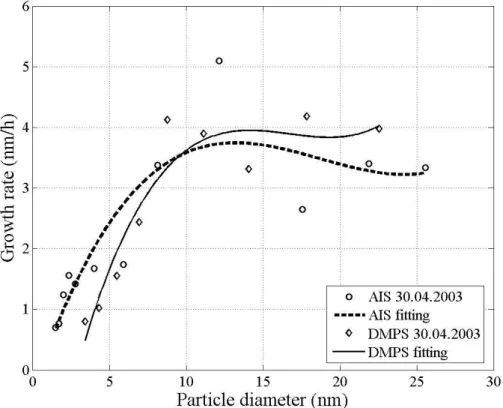
In Fig. 10 we present the growth rates as a function of size of aerosol particles measured by DMPS and charged aerosol particles (air ions) measured by AIS. We es-timated the growth rates as temporal changes of diameter corresponding to the maxi-mum number concentration in the measured size distribution. We fitted the data points with a polynomial of degree 3 that fits the data in a least square sense. The Fig. 10
10
shows the rather steep increase of growth rate with size at smaller diameters that levels out at diameter of about 10 nm.
3.6 Fine aerosol number fluxes
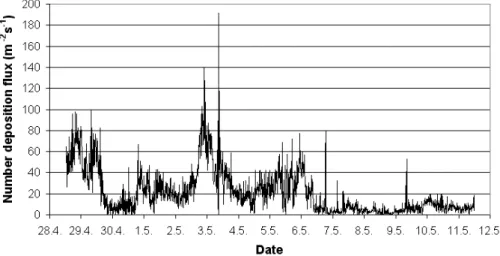
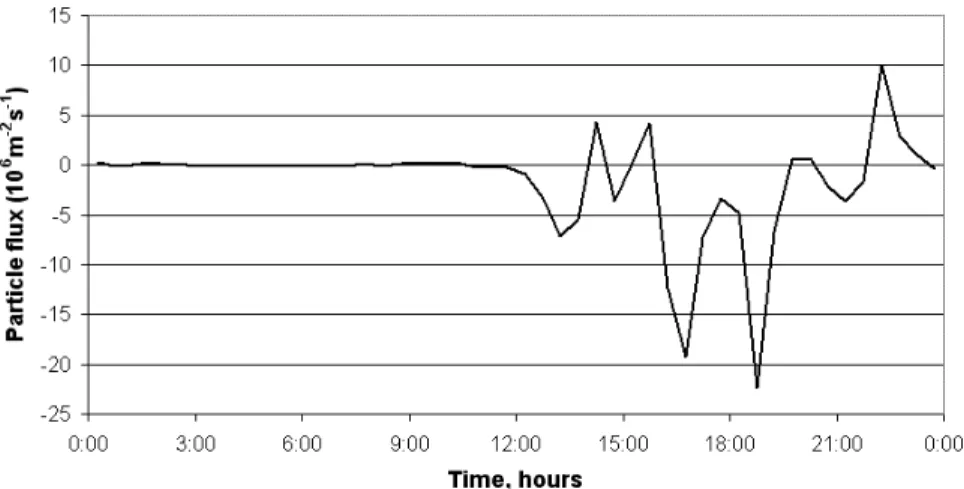
The turbulent aerosol number flux is shown in Fig. 11 (positive is upward net fluxes, negative is downward fluxes or deposition). Many combined factors are needed in
or-15
der to understand the changes between up and downward fluxes. Local emissions cannot be entirely excluded in order to explain the upward fluxes, but they can also be caused by non-stationary conditions when the eddy covariance method is not valid. What one must understand is that this is total aerosol number fluxes, dominated by the size range where both number concentrations and Brownian diffusion is the largest, at
20
diameters <100 nm. Therefore, the coarse mode fluxes estimated and discussed in
Sect. 3.4 have no connection to the measured fluxes. Periods of high concentrations of aerosol particles<100 nm diameter are interesting, though as they can explain large
deposition fluxes (for particle number concentration see Fig. 3). In Fig. 11 we can see several such periods, including the pollution episodes like 3 May, and the aerosol
for-25
mation events at 30 April, 5 May and 8 May. On all days when aerosol formation was observed, there were also large deposition fluxes, in agreement with previous obser-vations. However, during pollution episode (3 May), SO2 concentration was high and
ACPD
7, 709–751, 2007 Concentrations and fluxes of aerosols, LAPBIAT campaign T. M. Ruuskanen et al. Title Page Abstract Introduction Conclusions References Tables Figures ◭ ◮ ◭ ◮ Back CloseFull Screen / Esc
Printer-friendly Version
Interactive Discussion aerosol flux pretty small. When there is aerosol formation, the aerosol number flux
is downward indicating large deposition fluxes of small particles that recently formed above the surface layer/canopy (Nilsson et al., 2001). Considering example of the 24 h period from the midnight of 30 April to midnight of 1 May (Fig. 12), we see that the vertical aerosol flux is almost ideally zero until the aerosol formation event begins.
Af-5
ter 12:00 a.m. the aerosol flux fluctuated strongly, but was mainly towards the surface. Strongest downward flux appeared just at the moment of the outbreak of polluted air, but during the next hour the nearly-zero average flux was restored but strong fluctua-tions continued. The reoccurring variafluctua-tions in the vertical aerosol number flux may be due to presence of secondary circulations in the boundary layer, such as cloud streets
10
(Buzorius et al., 2001). These circulations have a period near the 30 min averaging period of the flux calculations, which cause these fluctuations.
3.7 Simulation of 30 April particle formation event
The rapid change from clean to polluted air mass during 30 April was simulated with a Lagrangian particle model SILAM (Finnish Meteorological Institute), for a detailed
15
description see Sofiev et al. (2005). The sulphate concentration in the air was used as an indicator of industrial pollution. EMEP data of industrial emissions from Central and Northern Europe, including Kola Peninsula were applied. We included SO2emissions, and calculated its conversion into sulphate within the SILAM model. Model results (Fig. 13) show only marginal concentrations of SO−24 (below 0.1 ppb) during the
nucle-20
ation event, but the SO−24 increases to the order of ppbs just after the breakdown of aerosol particle formation event. We also observed the same change in the measured concentrations of SO2and NOx. On 30 April, both measured concentrations were be-low the detection limit until they abruptly rose in the evening up to concentrations of over 4 ppb of SO2and 1 ppb of NOx(Fig. 3).
ACPD
7, 709–751, 2007 Concentrations and fluxes of aerosols, LAPBIAT campaign T. M. Ruuskanen et al. Title Page Abstract Introduction Conclusions References Tables Figures ◭ ◮ ◭ ◮ Back CloseFull Screen / Esc
Printer-friendly Version
Interactive Discussion
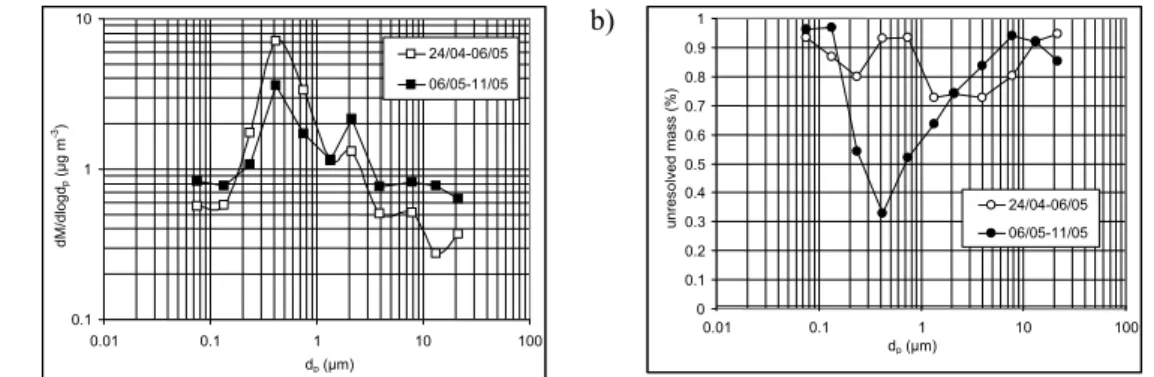
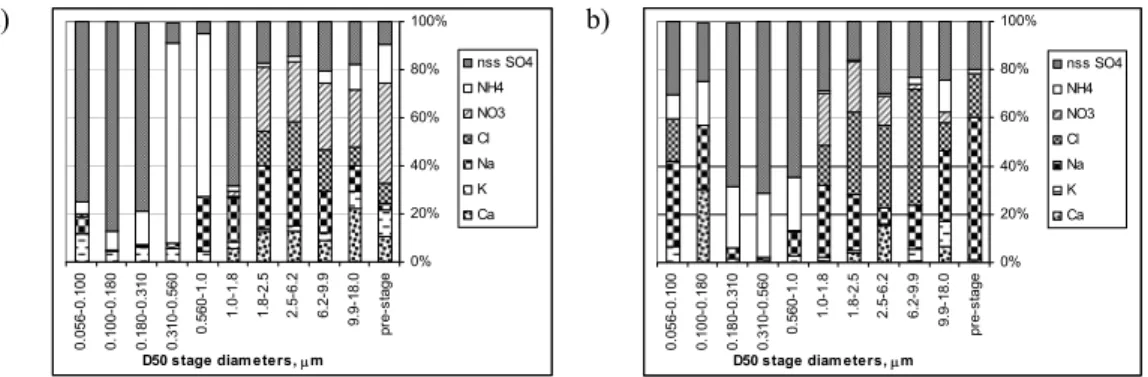
EGU 3.8 Aerosol mass and size-segregated inorganic composition
A size-segregated aerosol mass concentration along with an unresolved mass is pre-sented in Fig. 14. First week of the campaign was generally clean with only a brief pollution outbreak. The second week was generally polluted bringing aged air masses from east and west. Accumulation and coarse modes are clearly revealed and there
5
was little difference between two samples from aerosol mass point of view. The ac-cumulation mode was centred around 0.4µm, while coarse mode around 2 µm. One
can also see the upper shoulder of Aitken mode, since the concentration of the first stage did not follow a decreasing pattern. However, the unresolved mass (difference between gravimetric mass and sum of analyzed inorganic species) showed significant
10
difference between the samples, especially in the accumulation mode, where the un-resolved mass was relatively small during second week of the campaign. During first week of the campaign there was large unresolved mass across all the sizes. Figure 15 presents detailed contribution of each of inorganic species to the analyzed mass.
Most of the unresolved aerosol mass according to Fig. 14b can be attributed to
or-15
ganic matter, especially as long as accumulation mode is concerned. Hence, organic matter contributed very significantly to Aitken mode mass in both samples and accu-mulation mode mass only in first week sample. Figure 15a shows large contribution of sulphate to Aitken mode mass and large contribution of ammonium to accumulation mode. At the same time there was a very significant ion imbalance with a significant
20
lack of positive ions in Aitken mode and negative – in accumulation mode. In aged polluted second week sample ion balance was generally uniform across all the sizes with sulphate and ammonium dominating accumulation mode. Owing to significant dif-ferences in concentration, mode and ion balance it is likely that the first week sample was a mixture of nucleation process and pollution outbreak. Therefore, it is likely that
25
nucleation events involved sulphuric acid and organics, while during pollution outbreak accumulation mode was only enriched in ammonium, but not sulphate, thus confirming that pollution source was likely not very distant, only as far as Kola peninsula.
How-ACPD
7, 709–751, 2007 Concentrations and fluxes of aerosols, LAPBIAT campaign T. M. Ruuskanen et al. Title Page Abstract Introduction Conclusions References Tables Figures ◭ ◮ ◭ ◮ Back CloseFull Screen / Esc
Printer-friendly Version
Interactive Discussion ever, coarse size resolution of MOUDI impactor and lack of analyzed organics does
not allow firm conclusions. It is becoming obvious that a high resolution aerosol mass spectrometer capable of high resolution aerosol mass and chemical measurements is needed to advance a link between chemical composition and atmospheric processes.
4 Discussion
5
4.1 Coarse aerosol deposition
Looking at the aerosol particle deposition (snow-based deposition measurements) data (Table 3, Fig. 5), it is obvious that the air was much cleaner, regarding mineral matter and main anthropogenic pollutants, before 28 April than afterwards. The only excep-tion, chloride, is in agreement with the assumption of clean Arctic air mass: Cl in the
10
snow samples probably originated from the seawater droplets blown up from the open Arctic Ocean a few hundred kilometres to north and northwest from the SMEAR I sta-tion. Also, results from the SILAM model as well as the SO2and NOx measurements support these concepts.
Extremely large difference between the sample periods in deposition fluxes of nitrate
15
seem to be related to the outbreak of more polluted air mass together with the snowfall. On the other hand, the deposition fluxes based on the sample of 28–29 April suggest that nearly entire deposition of most species during 28 April to 1 May occurred in first one and a half days of that period. However, this is not the case for the fluxes of Ca and spheroidal particles (i.e. presumably mineral matter in coarse particles): nearly a
20
half of these species deposited after the evening of 29 April, possibly simultaneously with the outbreak of polluted air from Kola Peninsula.
The coarse aerosol particles (5–10µm) flux estimations based on the EAS
mea-surements (Fig. 6) result in total mass deposition of 25 mg m−2 for 28–29 April and 32 mg m−2 for a longer time 28 April–1 May. On the other hand, estimations based
25
ACPD
7, 709–751, 2007 Concentrations and fluxes of aerosols, LAPBIAT campaign T. M. Ruuskanen et al. Title Page Abstract Introduction Conclusions References Tables Figures ◭ ◮ ◭ ◮ Back CloseFull Screen / Esc
Printer-friendly Version
Interactive Discussion
EGU and nearly zero for the rest of the longer time, i.e. 30 April–1 May. This is in rather
good agreement regarding the numerous assumptions made in the aerosol particle flux estimations based on the EAS measurements, limited statistics and probably non-comprehensive set of analysed chemical species. Both estimations of aerosol particle flux indicated that major part of the aerosol particle mass was deposited at 28 April
5
and morning of 29 April. Then an outbreak of clean air mass followed, enabling the nucleation event at 30 April. Despite the notable number concentration of the newly formed particles, their mass concentration remained negligible. In the evening of 30 April and the following night some aerosol particle mass deposition occurred again from the industrially polluted air.
10
It is possible that nitrates and sulphates originated from the aged pollution in the form of fine aerosol, scavenged at the cloud level and washed out during the snowfall. A re-markable part of Ca (coupled with carbonate or other ions that were not analysed) and aerosol particles may have been carried by the air mass from industrial areas of Kola and dry deposited on the snow cover, as there was no snowfall during the aerosol
pol-15
lution event at 30 April. From our estimations that the wind velocity at 500 m height was about 10 m s−1 and velocity of gravitational fall for 5–10µm mineral aerosol particles was in order of 5 mm s−1, we noticed that this diameter aerosol particles descended about 0.5 mm per meter of passing air, equalling to only 70–100 m during the atmo-spheric transport from Monchegorsk or Nikel. Thus, as stack height plus initial rise
20
of buoyant plume for large industrial releases is typically a few hundreds of meters, spheroidal particles from these sources can easily reach V ¨arri ¨o and in dry weather a certain part of them pass well over that distance. However, cloud condensation pro-cesses can dramatically change the transportation distance.
Snow-based deposition measurements have been earlier successfully used to
mea-25
sure deposition loads, distinguish different periods of deposition and validate the air quality models in the conditions of Northern Europe (Kaasik et al., 2000 and Sofiev et al., 2003). However, this is the first time they were coupled with extensive aerosol par-ticle measurements. The results from this campaign suggest that coordinated aerosol
ACPD
7, 709–751, 2007 Concentrations and fluxes of aerosols, LAPBIAT campaign T. M. Ruuskanen et al. Title Page Abstract Introduction Conclusions References Tables Figures ◭ ◮ ◭ ◮ Back CloseFull Screen / Esc
Printer-friendly Version
Interactive Discussion and deposition measurements open new possibilities for interpreting the results.
4.2 Fine mode aerosol fluxes and formation
Our campaign results are consistent with the previous observation that aerosol particle formation and growth events occur typically during clear sky conditions (Vehkam ¨aki et al., 2004). Prior the formation event the condensation sink decreased, the same has
5
been observed by Vehkam ¨aki et al. (2004), in about half of formation events observed in V ¨arri ¨o. This was explained by Nilsson et al. (2001) as dilution caused by entrainment of clean air from above the mixed layer.
Higher ozone concentrations have also been observed during event days, which could be explained by photochemical reaction cycles (Seinfeld and Pandis, 1998). The
10
same could explain the observed lower NOx concentrations. In addition, biogenic ac-tivity could be higher on sunny days and emissions of biogenic VOCs of e.g. monoter-penes could be higher and once oxidized these compounds may contribute to the aerosol particle growth. These findings are similar than the recent observation made in Hyyti ¨al ¨a at SMEAR II station (Kulmala et al., 2004b and Lyubotseva et al., 2005).
15
The aerosol fluxes measured by eddy covariance method in the beginning of all three observed nucleation events (30 April, 5 May and 8 May) were downwards (clear peaks in Fig. 5), indicating that the main process of formation of new aerosol particles was going on above, not in the canopy layer or surface layer. This is in agreement with the conclusions of Nilsson et al. (2001) and Buzorius et al. (2001) for SMEAR II station
20
observations in Hyyti ¨al ¨a.
The particle growth rates were estimated for the observed nucleation events, fitting the concentration maximums for AIS, DMPS and EAS spectral fractions as described by Hirsikko et al. (2005). The basic concept of two linear sections fitting to the maxi-mums of different particle size intervals was found valid (Table 4). The event No 2, gives
25
too high growth rate, in comparison with others, and this is associated with change of air masses. Otherwise the observed growth rates are in agreement with those de-scribed elsewhere (Kulmala et al., 2004a, 2005 and Komppula et al., 2006).
ACPD
7, 709–751, 2007 Concentrations and fluxes of aerosols, LAPBIAT campaign T. M. Ruuskanen et al. Title Page Abstract Introduction Conclusions References Tables Figures ◭ ◮ ◭ ◮ Back CloseFull Screen / Esc
Printer-friendly Version
Interactive Discussion
EGU
5 Conclusions
The LAPBIAT measurement campaign took place in the SMEAR I measurement station located in Eastern Lapland in the spring of 2003 between 26 April and 11 May. LAP-BIAT (Lapland Atmosphere-Biosphere) facilitys’ goal is to enhance the international scientific co-operation at the Finnish Arctic research stations involved in the program.
5
In this paper we have described the measurement campaign, concentrations and fluxes of aerosol particles and air ions, paying special attention to an aerosol particle forma-tion event broken by a polluted air mass approaching from industrial areas of Kola Peninsula, Russia. Besides this we have also reported trace gas concentrations and used snow samples to verify deposition processes.
10
During the campaign three aerosol particle formation events were observed. They are typically related to clean Arctic air. During and just before the event, the con-centrations of pre-existing aerosols, larger than nucleation mode sizes were at their lowest concentration. As the Arctic air mass changed its route (like in April, 30) and passed trough industrial area in Kola Peninsula, the composition changed. As the route
15
changed, a strong anthropogenic influence was observed, and the observation of the new particle formation event was interrupted due to high coarse aerosol particle and inorganic trace gas concentrations.
This event was a good proof of dramatic influence of high pre-existing aerosol con-centrations to the new particle formation and their subsequent growth by condensation
20
(condensation growth). The rapid increase of existing aerosol concentration pre-vents further aerosol formation. Another proof was found in low aerosol concentrations before nucleation events. Both of those findings support recent theoretical findings (e.g. Kerminen and Kulmala, 2002 and Kulmala et al., 2006)
The strong downward aerosol (number concentration) fluxes during all three
ob-25
served nucleation events suggest that new aerosol particles are formed above and transported down into the canopy layer.
ACPD
7, 709–751, 2007 Concentrations and fluxes of aerosols, LAPBIAT campaign T. M. Ruuskanen et al. Title Page Abstract Introduction Conclusions References Tables Figures ◭ ◮ ◭ ◮ Back CloseFull Screen / Esc
Printer-friendly Version
Interactive Discussion carried out in an Arctic area. Chemical and microscopic analyses of snow provide
valu-able information on the pollution of air mass at the coarse end of the aerosol particle spectrum. Reciprocal verification of measurements from air and from snow is possi-ble and enhances the reliability of both measurements. Transport modelling based on atmospheric dynamics is also a useful tool for aerosol research, indicating the precise
5
locations of aerosol sources. Closer coupling of atmospheric and aerosol models is suggested for the future.
Acknowledgements. This work was supported by Nordic Centre of Excellence BACCI, by the
EU-project LAPBIAT, by the Swedish Research Council and by the Estonian Science Founda-tion, grants no. 4622, 5387 and 5002. Authors would like to thank D. Jasineviciene in Institute 10
of Physics, Lithuania for inorganic analysis of MOUDI samples.
References
Alliksaar, T., H ¨orstedt, P., and Renberg, I.: Characteristic fly-ash particles from oil-shale com-bustion found in lake sediments, Water, Air, Soil Pollut., 104, 149–160, 1998.
Bonn, B. and Mootgard, G. K.: Sesquiterpene Ozonolysis: Origin of Atmospheric New 15
Particle Formation from Biogenic Hydrocarbons, Geophys. Res. Lett., 30(11), 1585, doi:10.1027/2003GL017000, 2003.
Boy, M. and Kulmala, M.: Nucleation Events in the Continental Boundary Layer: Influences of Physical and Meteorological Parameters, Atmos. Chem. Phys., 2, 1–16, 2002,
http://www.atmos-chem-phys.net/2/1/2002/. 20
Buzorius, G., Rannik, ¨U., Nilsson, D., and Kulmala, M.: Vertical Fluxes and micrometeorology during aerosol particle formation events, Tellus B, 53, 394–405, 2001.
Charlson R. J. and Wigley, T. M. L.: Sulphate aerosol and climate change, Scientific American, 207, 48–57, 1994.
Claeys M., Wu Wang, Ion, A.C., Kourtchev, I., Gelencser, A., and Maenhaut, W.: Formation 25
of secondary organic aerosols from isoprene and its gas-phase oxidation products through reaction with hydrogen peroxide, Atmos. Environ., 38(25), 4093–4098, 2004.
Clarke, A. D.: Atmospheric Nuclei in the remote free troposphere, J. Atmos. Chem., 14, 479– 488, 1992.
ACPD
7, 709–751, 2007 Concentrations and fluxes of aerosols, LAPBIAT campaign T. M. Ruuskanen et al. Title Page Abstract Introduction Conclusions References Tables Figures ◭ ◮ ◭ ◮ Back CloseFull Screen / Esc
Printer-friendly Version
Interactive Discussion
EGU
Dal Maso, M., Kulmala, M., Riipinen, I., Wagner, R., Hussein, T, Aalto, P. P., and Lehtinen, K. E. J.: Formation and growth rates of fresh atmospheric aerosols: eight years of aerosol size distribution data from SMEARII, Hyyti ¨al ¨a, Finland, Boreal Env. Res., 10, 323–336, 2005. Hakola, H., Tarvainen, V., Laurila, T., Hiltunen, V., Hellen, H., and Keronen, P.: Seasonal
Vari-ation of VOC ConcentrVari-ations over a Boreal Forest, Atmos. Environ., 37(12), 1623–1634, 5
2003.
Hari, P., Kulmala, M., Pohja, T., Lahti, T., Siivola, E., Palva, L., Aalto, P., H ¨ameri, K., Vesala, T., Luoma, S., and Pulliainen, E.: Air pollution in Eastern Lapland: challenge for an environ-mental measurement station, Silva Fennica, 28, 29–39, 1994.
Hirsikko, A., Laakso, L., H ˜orrak, U., Aalto, P. P., Kerminen, V. M., and Kulmala, M.: Annual and 10
size dependent variations of growth rates and ion concentrations in boreal forest, Boreal Env. Res., 10, 375–369, 2005.
Kaasik, M., R ˜o ˜om, R., Røyset, O., Vadset, M., S ˜oukand, ¨U., T ˜ougu, K., and Kaasik, H.: Ele-mental and base anions deposition in the snow cover of north-eastern Estonia. The impact of industrial emissions, Water, Air, Soil Pollut., 121, 349–366, 2000.
15
Kaasik, M., Alliksaar, T., Ivask, J., and Loosaar, J.: Spheroidal fly ash particles from oil-shale-fired power plants in atmospheric precipitations. Possibilities of quantitative tracing, Oil Shale, 22, 547–562, 2005.
Kerminen, V.-M. and Wexler, A. S.: The occurrance of sulphuric acid-water nucleation in plumes: Urban Environment, Tellus B, 48, 65–82, 1996.
20
Kerminen, V.-M. and Kulmala, M.: Analytical formulae connecting the “real” and the “apparent” nucleation rate and the nuclei number concentration for atmospheric nucleation events, J. Aerosol Sci., 33, 609–622, 2002.
Komppula, M., Lihavainen, H., Hatakka, J., Paatero, J., Aalto, P., Kulmala, M., and Viisanen, Y.: Observations of new particle formation and size distributions at two different heights 25
and surroundings in subarctic area in northern Finland, J. Geophys. Res., 108(D9), 4295, doi:10.1029/2002JD002939, 2003.
Komppula, M., Sihto, S.-L., Korhonen, H., Lihavainen, H., Kerminen, V.-M., Kulmala, M., and Viisanen, Y.: New particle formation in air mass transported between two measurement sites in Northern Finland, Atmos. Chem. Phys., 6, 2811–2824, 2006,
30
http://www.atmos-chem-phys.net/6/2811/2006/.
Korhonen, P., Kulmala, M., Laaksonen, A., Viisanen, Y., McGraw, R., and Seinfeld, J. H.: Ternary nucleation of H2SO4, NH3, and H2O in the atmosphere, J. Geophys. Res., 104,
ACPD
7, 709–751, 2007 Concentrations and fluxes of aerosols, LAPBIAT campaign T. M. Ruuskanen et al. Title Page Abstract Introduction Conclusions References Tables Figures ◭ ◮ ◭ ◮ Back CloseFull Screen / Esc
Printer-friendly Version
Interactive Discussion
26 349–26 353, 1999.
Kourtchev, I., Ruuskanen, T., Maenhaut, W., Kulmala, M., and Claeys, M.: Observation of 2-methyltetrols and related photo-oxidation products of isoprene in boreal forest aerosols from Hyyti ¨al ¨a, Finland, Atmos. Chem. Phys., 5, 2761–2770, 2005,
http://www.atmos-chem-phys.net/5/2761/2005/. 5
Kulmala, M., Toivonen, A., M ¨akel ¨a, J., and Laaksonen, A.: Analysis of Nucleation Mode Parti-cles Observed in Boreal Forest, Tellus B, 50, 449–462, 1998.
Kulmala, M., Pirjola, L., and M ¨akel ¨a, J. M.: Stable Sulphate Clusters as a Source of New Atmospheric Particles, Nature, 404, 66–69, 2000.
Kulmala, M., H ¨ameri, K., Aalto, P. P., M ¨akel ¨a, J. M., Pirjola, L., Nilsson, D. E., Buzorius, G,, 10
Rannik, ¨U., Dal Maso, M., Seidl, W., Hoffman, T., Janson, R., Hansson, H.-C., Viisanen, Y., Laaksonen, A., and O’Dowd, C. D.: Overview of the international project on biogenic aerosol formation in the boreal forest (BIOFOR), Tellus B, 53, 324–343, 2001.
Kulmala, M., Vehkam ¨aki, H., Pet ¨aj ¨a, T., Dal Maso, M., Lauri, A., Kerminen, V.-M., Birmili, W., and McMurry, P. H.: Formation and growth rates of ultrafine atmospheric particles: A review 15
of observations, J. Aerosol Sci., 35, 143–176, 2004a.
Kulmala, M., Suni, T., Lehtinen, K. E. J., Dal Maso, M., Boy, M., Reissell, A., Rannik, ¨U., Aalto, P., Keronen, P., Hakola, H., B ¨ack, J., Hoffmann, T., Vesala, T., and Hari, P.: A new feedback mechanism linking forests, aerosols, and climate, Atmos. Chem. Phys., 4, 557–562, 2004b. Kulmala, M., Pet ¨aj ¨a, T., M ¨onkk ¨onen, P, Koponen, I. K., Dal Maso, M., Aalto, P. P., Lehtinen, 20
K. E. J., and Kerminen, V.-M.: On the growth of nucleation mode particles: source rates of condensable vapour in polluted and clean environments, Atmos. Chem. Phys., 5, 409–416, 2005,
http://www.atmos-chem-phys.net/5/409/2005/.
Kulmala, M., Lehtinen, K. E. J., and Laaksonen, A.: Cluster activation theory as an explana-25
tion of the linear dependence between formation rate of 3 nm particles and sulphuric acid concentration, Atmos. Chem. Phys., 6, 787–793, 2006a.
Kulmala, M., Reissell, A., Sipil ¨a, M., Bonn, B., Ruuskanen, T. M., Lehtinen, K. E. J., Kermi-nen, V.–M., and Str ¨om, J.: Deep convective clouds as aerosol production engines: Role of insoluble organics, J. Geophys. Res., 111, D17202, doi:10.1029/2005JD006963, 2006b. 30
Laakso, L., Anttila, T., Lehtinen, K. E. J., Aalto, P. P., Kulmala, M., H ˜orrak, U., Paatero, J., Hanke, M., and Arnold, F.: Kinetic nucleation and ions in boreal forest particle formation events, Atmos. Chem. Phys., 4, 2353–2366, 2004a.
ACPD
7, 709–751, 2007 Concentrations and fluxes of aerosols, LAPBIAT campaign T. M. Ruuskanen et al. Title Page Abstract Introduction Conclusions References Tables Figures ◭ ◮ ◭ ◮ Back CloseFull Screen / Esc
Printer-friendly Version
Interactive Discussion
EGU
Laakso, L., Pet ¨aj ¨a, T., Lehtinen, K. E. J., Kulmala, M., Paatero, J., H ˜orrak, U., Tammet, H., and Joutsensaari, J.: Ion production rate in a boreal forest based on ion, particle and radiation measurements, Atmos. Chem. Phys., 4, 1933–1943, 2004b.
Logan, J. A.: Tropospheric ozone: Seasonal behavior, trends and anthropogenic influence, J. Geophys. Res., 90, 10 463–10 482, 1985.
5
Lyubovtseva, Y. S., Sogacheva, L., Dal Maso, M., Bonn, B., Keronen, P., and Kulmala, M.: Seasonal variations of trace gases, meteorological parameters, and formation of aerosols in boreal forests, Boreal Env. Res., 10, 493–510, 2005.
M ¨akel ¨a, J. M., Aalto, P., Jokinen, V., Pohja, T., Nissinen, A., Palmroth, S., Markkanen, T., Seitsonen, K., Lihavainen, H., and Kulmala, M.: Observations of ultrafine aerosol particle 10
formation and growth in boreal forest, Geophys. Res. Lett., 24, 1219–1222, 1997.
M ¨akel ¨a, J. M., Dal Maso, M., Pirjola, L., Keronen, P., Laakso, L., Kulmala, M., and Laaksonen, A.: Characteristics of the Atmospheric Particle Fomation Events Observed at a Boreal Forest Site in Southern Finland, Bor. Env. Res., 5, 299–313, 2000.
M ˚artensson, E. M., Nilsson E. D., Buzorius G., and Johansson, C.: Eddy correlation measure-15
ments and parameterisation of particle emissions in an urban environment, Atmos. Chem. Phys., 769–785, 2006.
Nilsson, E. D., Rannik ¨U., Buzorius G., Kulmala M., and O’Dowd C.: Effects of the continen-tal boundary layer evolution, convection, turbulence and entrainment on aerosol formation, Tellus B, 53, 441–461, 2001.
20
O’Dowd, C. D., H ¨ameri, K., M ¨akel ¨a, J. M., Pirjola, L., Kulmala, M., Jennings, S. G., Berresheim, H., Hansson, H.-C., de Leeuw, G., Kunz, G. J., Allen, A. G., Hewitt, C. N., Jackson, A., Viisanen, Y., and Hoffmann, T.: A dedicated study of new particle formation and fate in the coastal environment (PARFORCE): overview of objectives and achievements, J. Geophys. Res., 107(D19), 8108, doi:10.1029/2001JD000555, 2002a.
25
O’Dowd, C., Aalto, P., H ¨ameri, K., Kulmala, M., and Hoffmann, T.: Atmospheric particles from organic vapours, Nature, 416, 497–1798, 2002b.
Pirjola, L., Laaksonen, A., Aalto, P., and Kulmala, M.: Sulphate Aerosol Formation in the Arctic Boundary Layer, J. Geophys. Res., 103, 8309–8322, 1998.
Ruuskanen, T. M., Reissell, A., Keronen, P., Aalto, P. P., Laakso, L., Gr ¨onholm, T., Hari, P., 30
and Kulmala, M.: Atmospheric trace gas and aerosol particle concentration measurements in Eastern Lapland, Finland 1992-2001, Boreal Env. Res., 8, 335–349, 2003.
ACPD
7, 709–751, 2007 Concentrations and fluxes of aerosols, LAPBIAT campaign T. M. Ruuskanen et al. Title Page Abstract Introduction Conclusions References Tables Figures ◭ ◮ ◭ ◮ Back CloseFull Screen / Esc
Printer-friendly Version
Interactive Discussion
midlatitude free troposphere and tropopause region, Atmos. Res., 44, 333–356, 1997. Seinfeld, J. H. and Pandis, S. N.: Atmospheric Chemistry and Physics, Wiley, N. Y., 1236–1237,
1998.
Sofiev, M., Siljamo, P., Valkama, I., Ivonen, M., and Kukkonen, J.: A dispersion modelling system SILAM and its evaluation against ETEX data, Atmos. Environ., 40, 674–685, 2005. 5
Sofiev, M., Kaasik, M., and Hongisto, M.: Distribution of alkaline particles over the Baltic Sea basin, Water, Air, Soil Pollut., 146, 211–223, 2003.
Sopauskiene, D. and Jasineviciene, D.: Changes in precipitation chemistry in Lithuania for 1981–2004, J. Environ. Monitoring, 8, 347–352, 2006.
Stein, S. W., Gabrio, B. J., Oberreit, D., Hairston, P., Myrdal, P.,B., and Beck, T. J.: An evaluation 10
of mass-weighted size distribution measurements with the Model 3320 aerodynamic particle sizer. Aerosol Sci. Technol., 36, 845–854, 2002
Tunved, T., Hansson, H.-C., Kulmala, M., Aalto, P., Viisanen, Y., Karlsson, H., Kristensson, A., Swietlicki, E., Dal Maso, M., Str ¨om, J., and Komppula, M.: One year boundary layer aerosol size distribution data from five Nordic background stations, Atmos. Chem. Phys., 3, 2183– 15
2205, 2003,
http://www.atmos-chem-phys.net/3/2183/2003/.
Vana, M., Kulmala, M., Dal Maso, M. H ˜orrak, U., and Tamm, E.: Comparative study of nu-cleation mode aerosol particles and intermediate air ions formation events at three sites, J. Geophys. Res., 109, D17201, doi:10.1029/2003JD004413, 2004.
20
Vehkam ¨aki, H., Dal Maso, M., Hussein, T., Flanagan, R., Hyv ¨arinen, A., Lauros, J., Merikanto, J., M ¨onkk ¨onen, P., Pihlatie, M., Salminen, K., Sogacheva, L., Thum, T., Ruuskanen, T., Keronen, P., Aalto, P. P., Hari, P., Lehtinen, K. E. J., Rannik, ¨U., and Kulmala, M.: Atmospheric Particle Formation Events At V ¨arri ¨o Measurement Station In Finnish Lapland 1998–2002, Atmos. Chem. Phys., 4, 2015–2023, 2004,
25
http://www.atmos-chem-phys.net/4/2015/2004/.
Virkkula, A., Hillamo, R. E., Kerminen, V.-M., and Stohl, A.: The influence of Kola Peninsula, continental European and marine sources on the number concentrations and scattering co-efficients of the atmospheric aerosol in Finnish Lapland, Boreal Env. Res., 2(4), 317–336, 1997.
ACPD
7, 709–751, 2007 Concentrations and fluxes of aerosols, LAPBIAT campaign T. M. Ruuskanen et al. Title Page Abstract Introduction Conclusions References Tables Figures ◭ ◮ ◭ ◮ Back CloseFull Screen / Esc
Printer-friendly Version
Interactive Discussion
EGU Table 1. The list of continuous measurements in SMEAR I station, during LAPBIAT campaign.
Quantity Measurement height Instrument/method Brand
temperature 15, 9, 6.6, 4.4, 2.2 m Pt-100 sensors shielded and ventilated wind speed 15, 9, 6.6, 2.2 m cup anemometer Vector Instruments
A 101 M/L
wind direction 15 m wind vane Vector Instruments W 200 P
RH 2 m dew point Vaisala HMI32 Humicap air pressure 2 m barometer Druck DPI 260
rain fall 1 m rain gauge Delta-T RG1 rain detection 15 m precipitation sensor Vaisala DPD 12A UV-A 15 m pyranometer Solar Light SL 501A UV-B 15 m pyranometer Solar Light SL 501A PAR
(range 400–700 nm)
15 m quantum sensor Li-Cor LI-190SB Global
(range 300–4800 nm)
15 m pyranometer Astrodata, Reemann TP 3 NOx 15, 9, 6.6, 2.2 m Chemiluminescence,
Molybdenum NO2 -to-NO converter
Thermo Environmental In-struments 42CTL
O3 15, 9, 6.6, 2,2 m UV light absorption Advanced Pollution Instru-mentation API 400 SO2 15, 9, 6.6, 2.2 m fluorescence Thermo Environmental
In-struments 43CTL aerosol particle
con-centration (14 nm–1µm)
15, 9, 6.6, 2.2 m condensation particle counter (CPC)
TSI 3760, detection limit 10−3particles cm−3
aerosol particle size distribution (10 nm– 500 nm)
2 m electrical mobility Differential Mobility Particle Sizer (DMPS) and CPC, TSI 3010
ACPD
7, 709–751, 2007 Concentrations and fluxes of aerosols, LAPBIAT campaign T. M. Ruuskanen et al. Title Page Abstract Introduction Conclusions References Tables Figures ◭ ◮ ◭ ◮ Back CloseFull Screen / Esc
Printer-friendly Version
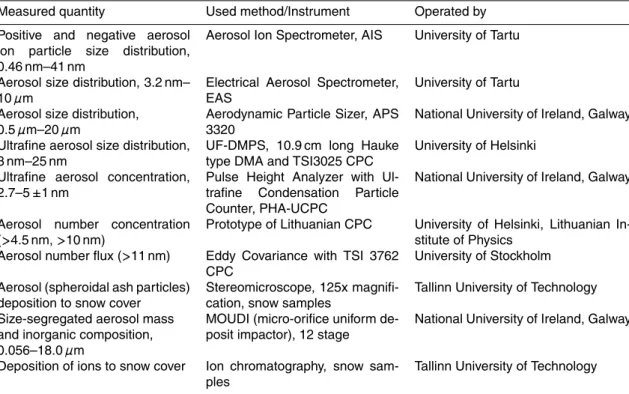
Interactive Discussion Table 2. The list of instruments used in measurements during the LAPBIAT measurement
campaign at SMEAR I station.
Measured quantity Used method/Instrument Operated by Positive and negative aerosol
ion particle size distribution, 0.46 nm–41 nm
Aerosol Ion Spectrometer, AIS University of Tartu
Aerosol size distribution, 3.2 nm– 10µm
Electrical Aerosol Spectrometer, EAS
University of Tartu Aerosol size distribution,
0.5µm–20 µm
Aerodynamic Particle Sizer, APS 3320
National University of Ireland, Galway Ultrafine aerosol size distribution,
3 nm–25 nm
UF-DMPS, 10.9 cm long Hauke type DMA and TSI3025 CPC
University of Helsinki Ultrafine aerosol concentration,
2.7–5 ±1 nm
Pulse Height Analyzer with Ul-trafine Condensation Particle Counter, PHA-UCPC
National University of Ireland, Galway
Aerosol number concentration (>4.5 nm, >10 nm)
Prototype of Lithuanian CPC University of Helsinki, Lithuanian In-stitute of Physics
Aerosol number flux (>11 nm) Eddy Covariance with TSI 3762 CPC
University of Stockholm Aerosol (spheroidal ash particles)
deposition to snow cover
Stereomicroscope, 125x magnifi-cation, snow samples
Tallinn University of Technology Size-segregated aerosol mass
and inorganic composition, 0.056–18.0µm
MOUDI (micro-orifice uniform de-posit impactor), 12 stage
National University of Ireland, Galway
Deposition of ions to snow cover Ion chromatography, snow sam-ples
ACPD
7, 709–751, 2007 Concentrations and fluxes of aerosols, LAPBIAT campaign T. M. Ruuskanen et al. Title Page Abstract Introduction Conclusions References Tables Figures ◭ ◮ ◭ ◮ Back CloseFull Screen / Esc
Printer-friendly Version
Interactive Discussion
EGU Table 3. Results of snow-based deposition measurements from 6 locations (Site: No 1 at 67
o45′04′′N, 29◦35′36′′E; No 2 at 67◦45′9′′N, 29◦32′56′′E; No 3 at 67◦45′12′′N, 29◦33′10′′E; No 4 at 67◦45′26′′N, 29◦36′10′′E; No 5 at 67◦45′26′′N, 29◦36′47′′E; No 6 at 67◦45′30′′N, 29◦36′9′′E). Deposition fluxes (mg m−2) Site No . Sample volume (ml) Sampling area (cm 2 ) Begin date End date Number of da ys W ater stor age (mm) Cl − NO− 3 SO2−4 Na + NH4+ K+ Ca2+ Mg2+ Spheroidal par ticles (m − 2 ) 1 335 1575 22 April 27 April 5.1 2.1 2.17 1.70 1.81 – 0.83 0.04 0.17 0.06 1159 1 290 525 28 April 1 May 3.4 5.5 0.77 21.04 2.87 0.11 0.33 – 0.55 – 5794 2 300 1575 22 April 27 April 5.2 1.9 1.98 1.01 1.85 – 0.86 0.02 0.13 0.08 2685 2 280 525 28 April –1 May 3.4 5.3 0.59 17.48 2.45 0.05 0.48 – 1.12 – 6900 3 240 1575 22 April 27 April 5.2 1.5 1.75 0.88 1.51 – 0.90 0.14 0.21 0.14 1839 3 230 525 28 April 1 May 3.4 4.4 0.57 14.55 3.02 0.18 0.48 0.09 1.23 0.04 4211 4 140 1575 22 April 27 April 5.3 0.9 0.99 0.94 0.84 – 0.53 0.11 0.41 0.09 529 4 350 525 28 April 1 May 3.4 6.7 0.73 18.90 3.93 0.07 0.60 – 2.13 – 2513 5 190 1575 22 April 27 April 5.4 1.2 1.76 1.98 1.41 – 0.98 0.05 0.25 0.16 2547 5 190 525 28 April 29 April 1.7 3.6 0.51 20.84 2.71 0.14 0.33 – 0.69 0.14 3618 5 310 525 28 April 1 May 3.5 5.9 0.89 17.52 2.95 0.24 0.30 – 1.30 0.12 6249 6 320 525 28 April 1 May 3.4 6.1 0.61 17.28 4.14 0.06 0.49 – 3.96 0.12 8087 Average 22 April 27 April 5.2 1.5 1.73 1.30 1.48 – 0.82 0.07 0.24 0.10 1752 28 April 1 May 3.4 5.7 0.69 17.79 3.23 0.12 0.45 0.09 1.72 0.09 5626 Standard 22 April 27 April 0.1 0.5 0.45 0.50 0.41 – 0.17 0.05 0.11 0.04 916 Deviation 28 April 1 May 0.0 0.8 0.13 2.13 0.66 0.07 0.11 – 1.21 0.04 1989
ACPD
7, 709–751, 2007 Concentrations and fluxes of aerosols, LAPBIAT campaign T. M. Ruuskanen et al. Title Page Abstract Introduction Conclusions References Tables Figures ◭ ◮ ◭ ◮ Back CloseFull Screen / Esc
Printer-friendly Version
Interactive Discussion Table 4. Particle growth rates during observed nucleation events at SMEAR I station.
Nucleation event Size interval Growth rate (nm h−1) of particles (nm)
AIS DMPS EAS
Event 1 (30 April) 3–77–20 2.03.3 2.23.7 1.73.3
Event 2 (5 May) 3–77–20 –15.6 –13.0 –14.2
ACPD
7, 709–751, 2007 Concentrations and fluxes of aerosols, LAPBIAT campaign T. M. Ruuskanen et al. Title Page Abstract Introduction Conclusions References Tables Figures ◭ ◮ ◭ ◮ Back CloseFull Screen / Esc
Printer-friendly Version
Interactive Discussion
EGU Fig. 1. Meteorological parameters measured at the SMEAR I station during the LAPBIAT
ACPD
7, 709–751, 2007 Concentrations and fluxes of aerosols, LAPBIAT campaign T. M. Ruuskanen et al. Title Page Abstract Introduction Conclusions References Tables Figures ◭ ◮ ◭ ◮ Back CloseFull Screen / Esc
Printer-friendly Version
Interactive Discussion Fig. 2. Reverse value of Monin-Obukhov length at the SMEAR I station during the LAPBIAT
ACPD
7, 709–751, 2007 Concentrations and fluxes of aerosols, LAPBIAT campaign T. M. Ruuskanen et al. Title Page Abstract Introduction Conclusions References Tables Figures ◭ ◮ ◭ ◮ Back CloseFull Screen / Esc
Printer-friendly Version
Interactive Discussion
EGU Fig. 3. Measured trace gas and aerosol number (for used aerosol measurement instruments
see Table 2) concentrations at the SMEAR I station during the LAPBIAT measurement cam-paign.
ACPD
7, 709–751, 2007 Concentrations and fluxes of aerosols, LAPBIAT campaign T. M. Ruuskanen et al. Title Page Abstract Introduction Conclusions References Tables Figures ◭ ◮ ◭ ◮ Back CloseFull Screen / Esc
Printer-friendly Version
Interactive Discussion Fig. 4. Comparison of size distribution measurements performed using 4 different instruments
at SMEAR I station. Air ion spectrometer measured only air ions all other measured total aerosol concentration.
ACPD
7, 709–751, 2007 Concentrations and fluxes of aerosols, LAPBIAT campaign T. M. Ruuskanen et al. Title Page Abstract Introduction Conclusions References Tables Figures ◭ ◮ ◭ ◮ Back CloseFull Screen / Esc
Printer-friendly Version
Interactive Discussion
EGU Fig. 5. Average deposition fluxes with error bars of inorganic compounds and spheroidal
par-ticles of two sampling periods during the LAPBIAT measurement campaign, in # m−2 per day for spheroidal particles and mg m−2 per day for other species. The fluxes are based on snow samples that were collected from several locations close to SMEAR I station.