SUPPLEMENTARY INFORMATION: Resonance Raman Optical
Activity Shows Unusual Structural Sensitivity for Systems in
Resonance with Multiple Excited States: Vitamin B
12Case
Ewa Machalska,1,2 Grzegorz Zajac,2 Anna Gruca,1,2, Fabio Zobi,3 Malgorzata Baranska,1,2 Agnieszka Kaczor,*1,2
1 Faculty of Chemistry, Jagiellonian University, Gronostajowa 2, Krakow 30-387, Poland 2 Jagiellonian Centre for Experimental Therapeutics (JCET), Jagiellonian University,
Bobrzynskiego 14, Krakow 30-348, Poland
3 Department of Chemistry, University of Fribourg, Chemin du Musée 9, 1700 Fribourg,
Switzerland
EXPERIMENTAL Materials
Cyanocobalamin (CNCbl) and hydroxocobalamin (OHCbl) chloride were purchased from Sigma-Aldrich. 1,4-diethynylbenzenecobalamin (HC≡C-Ph-C≡CCbl) and a cobalamin ring derivative (CNCbl-Br) were synthesized via reported procedures.1 Studied derivatives are
characterized chemically elsewhere.1,2
Spectroscopic measurements (UV-Vis/ECD, Raman/ROA)
Raman and ROA spectra of all compounds dissolved in distillated water (c=0.1 mg/mL) were measured using a ChiralRAMAN-2X spectrometer (BioTools Inc.) at a resolution of 7 cm-1 in
the range of 2500-250 cm-1 employing the excitation wavelength of 532 nm. The solutions were
measured in ROA quartz optical cells with anti-reflective coating. Laser power of 200 mW, integration time of 4.0424 s and 24 hour (CNCbl, OHCbl) or 72 hour (CNCbl-Br, HC≡C-Ph-C≡CCbl) acquisition time were used for ROA and Raman measurements of studied solutions. For CNCbl-Br and HC≡C-Ph-C≡CCbl a longer accumulation time was used, due to the insufficient S/N ratio after 24 h acquisition. Due to the limited stability of CNCbl-Br (24 h) and HC≡C-Ph-C≡CCbl (12 h) under laser irradiation, the final 72 hour spectra were averaged over three 24 h measurements (CNCbl-Br) and six 12 h (HC≡C-Ph-C≡CCbl) of freshly prepared samples. Before measurements, to remove physical impurities, all solutions were purified by using MilliporeTM Millex® syringe PTFE filters (pore size 0.45 μm). ROA and Raman spectra were corrected by subtracting the spectrum obtained for the solvent using OPUS software. Baseline of solvent-corrected spectra were then subtracted by asymmetric last squares smoothing method, and then, smoothed with the ten-point Savitzky–Golay procedure using
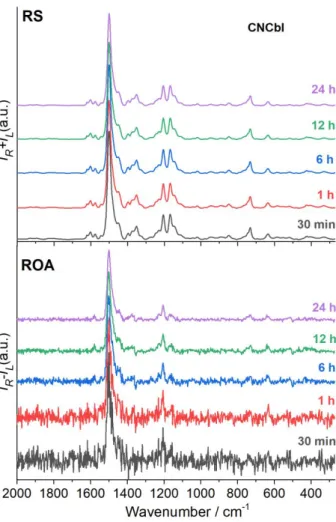
For cobalamins, 24 h-72 h acquisition time were used typically to obtain RROA spectra with a high S/N ratio. In fact, the most intense RROA bands of cobalamins can be recorded easily in 30 minutes (Figure S1).
Figure S1. Comparison of RROA spectra of CNCbl recorded in 30 min, 1 h, 6 h, 12 h and 24 h.
UV-Vis and ECD spectra were recorded in the 220-700 nm spectral range using quartz cells with a path length of 10 mm, a scanning speed of 100 nm/min, a bandwidth of 1 nm, 0.5 s response time by accumulation of a single scan on a Jasco J-815 spectrometer. The concentration of all samples was 0.1 mg/mL. Obtained spectra were solvent and baseline corrected using JASCO software.
Stability of cobalamins in RROA experiment
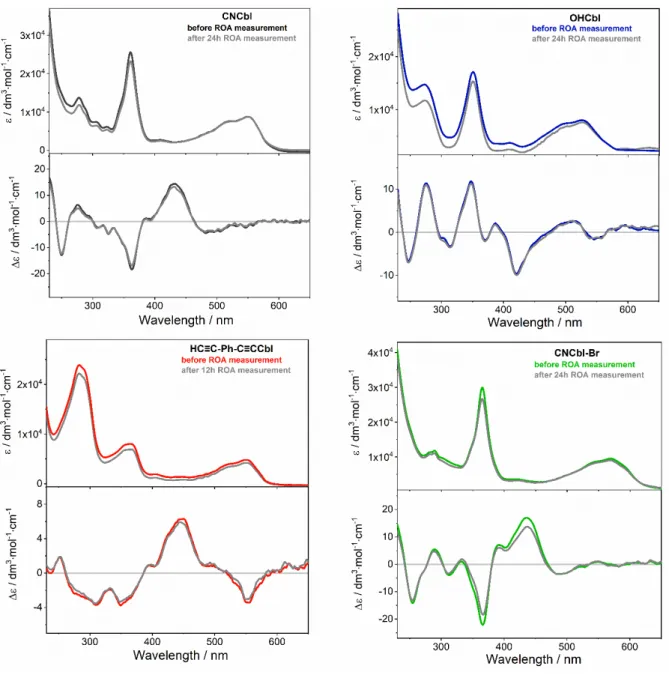
To prove that local heating and photochemical degradation do not occur, even after prolonged irradiation with the ROA laser, the ECD spectra were registered after RROA measurements (Figure S2). The ECD spectra registered after the ROA measurements are unchanged compared to the ECD spectra of the freshly prepared solutions of cobalamins proving that studied cobalamins are photostable in the conditions of the experiment.
Figure S2. The ECD spectra of studied cobalamins recorded before and after RROA experiments involving prolonged irradiation with the RROA laser.
Quantum-chemical calculations
Quantum chemical calculations of spectroscopic properties, mainly Raman and ROA spectra of one of the studied cobalamins (CNCbl) were carried out for qualitative rationalization of obtained experimental spectra. However, we considered only Raman/ROA calculation in pre-resonance conditions in use of standard frequency-dependent Raman calculations in Gaussian, despite the fact that using excited lines of very close energy to the calculated electronic transitions can lead to meaningless results. We used two DFT hybrid functionals: a common B3LYP functional, and its modification with long range correction: CAM-B3LYP, combined with 6-31G(d) basis set, as well as MDF10 pseudopotential and basis set for Co. Only the CAM-B3LYP functional showed satisfying agreement with all experimental spectra (UV-Vis/ECD,
DFT calculations were performed by means of Gaussian 09 E.01 package.3 Crystallographic
structure of cyanocobalamin4 was optimised at the CAM-B3LYP/6-31G(d) theory level for H,
C, O, N and P atoms, and using the MDF10 pseudopotential and basis set for Co atom (Figure S3). The solvent (water) was modelled using the CPCM model. The entire structure of CNCbl was preserved in the geometry optimization and spectroscopic calculations. The optimized geometry did not change significantly in respect to the X-ray structure, that was reflected in the small change of the corrin ring fold angle described as the angle between two planes: N21-C4-C5-C6-N22-C9-C10 and C10-C11-N23-C14-C15-C16-N24 from 14.0° in X-ray to 17.1° after CAM-B3LYP/MDF10/6-31G(d)/CPCM optimization Figure S4.
The optimised CNCbl structure (Figure S4 and Table S1) was then submitted to the TD-DFT calculations of vertical electronic absorption energies and intensities (oscillatory and rotatory strengths of first 100 singlet excited states) as well as frequency calculations at the same level of theory along with calculation of pre-resonance Raman and ROA intensities using the frequency-dependent CPHF procedure, at 470 nm of incident light wavelength (Table S2). The incident light wavelength (470 nm) used in the Raman/ROA calculations was downshifted in comparison to the experimental one (532 nm), due to the downshift of the theoretical energy transition of interest in respect to the experimental spectra. We studied also other incident light lines in the α/β spectral region, but the 470 nm resulted in the best agreement of the experimental and calculated spectra. Comparison of the theoretical Raman/ROA profiles, obtained using selected excitation lines are presented in Figure 3 (manuscript). UV-Vis/ECD and Raman/ROA curves were obtained by a convolution with the Gaussian functions of 0.1 eV and 6 cm-1 half
width at half maximum, respectively employing GaussView 6 software.5 Further analysis of
molecular orbitals involved in the electronic transitions was performed by means of GaussSum 3 software.6 Calculated Raman/ROA frequencies were multiplied by a single factor of 0.9446
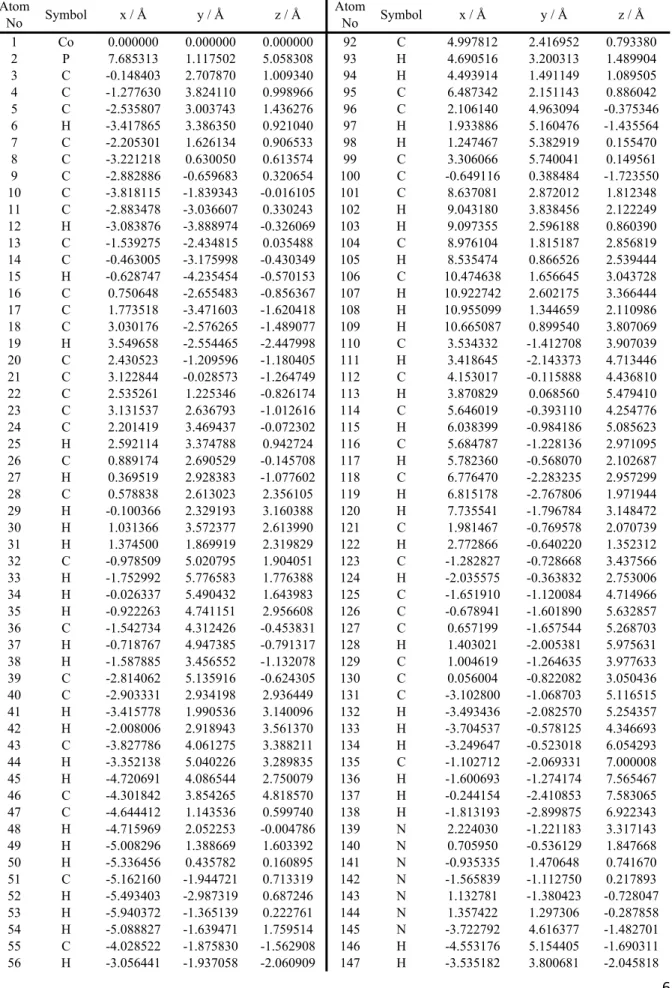
Figure S3. The structure of CNCbl, optimized at CAM-B3LYP/6-31G(d)/MDF10/6-31G(d)/PCM level.
Figure S4. Comparison of the X-ray structure (blue) and the optimized geometry of CNCbl (red) calculated at CAM-B3LYP/6-31G(d)/MDF10/6-31G(d)/PCM theory level (full color – corrin ring, transparent – all other atoms).
Table S1. The Cartesian coordinates of the optimized geometry of CNCbl at CAM-B3LYP/6-31G(d)/MDF10/PCM level. Atom No Symbol x / Å y / Å z / Å Atom No Symbol x / Å y / Å z / Å 1 Co 0.000000 0.000000 0.000000 92 C 4.997812 2.416952 0.793380 2 P 7.685313 1.117502 5.058308 93 H 4.690516 3.200313 1.489904 3 C -0.148403 2.707870 1.009340 94 H 4.493914 1.491149 1.089505 4 C -1.277630 3.824110 0.998966 95 C 6.487342 2.151143 0.886042 5 C -2.535807 3.003743 1.436276 96 C 2.106140 4.963094 -0.375346 6 H -3.417865 3.386350 0.921040 97 H 1.933886 5.160476 -1.435564 7 C -2.205301 1.626134 0.906533 98 H 1.247467 5.382919 0.155470 8 C -3.221218 0.630050 0.613574 99 C 3.306066 5.740041 0.149561 9 C -2.882886 -0.659683 0.320654 100 C -0.649116 0.388484 -1.723550 10 C -3.818115 -1.839343 -0.016105 101 C 8.637081 2.872012 1.812348 11 C -2.883478 -3.036607 0.330243 102 H 9.043180 3.838456 2.122249 12 H -3.083876 -3.888974 -0.326069 103 H 9.097355 2.596188 0.860390 13 C -1.539275 -2.434815 0.035488 104 C 8.976104 1.815187 2.856819 14 C -0.463005 -3.175998 -0.430349 105 H 8.535474 0.866526 2.539444 15 H -0.628747 -4.235454 -0.570153 106 C 10.474638 1.656645 3.043728 16 C 0.750648 -2.655483 -0.856367 107 H 10.922742 2.602175 3.366444 17 C 1.773518 -3.471603 -1.620418 108 H 10.955099 1.344659 2.110986 18 C 3.030176 -2.576265 -1.489077 109 H 10.665087 0.899540 3.807069 19 H 3.549658 -2.554465 -2.447998 110 C 3.534332 -1.412708 3.907039 20 C 2.430523 -1.209596 -1.180405 111 H 3.418645 -2.143373 4.713446 21 C 3.122844 -0.028573 -1.264749 112 C 4.153017 -0.115888 4.436810 22 C 2.535261 1.225346 -0.826174 113 H 3.870829 0.068560 5.479410 23 C 3.131537 2.636793 -1.012616 114 C 5.646019 -0.393110 4.254776 24 C 2.201419 3.469437 -0.072302 115 H 6.038399 -0.984186 5.085623 25 H 2.592114 3.374788 0.942724 116 C 5.684787 -1.228136 2.971095 26 C 0.889174 2.690529 -0.145708 117 H 5.782360 -0.568070 2.102687 27 H 0.369519 2.928383 -1.077602 118 C 6.776470 -2.283235 2.957299 28 C 0.578838 2.613023 2.356105 119 H 6.815178 -2.767806 1.971944 29 H -0.100366 2.329193 3.160388 120 H 7.735541 -1.796784 3.148472 30 H 1.031366 3.572377 2.613990 121 C 1.981467 -0.769578 2.070739 31 H 1.374500 1.869919 2.319829 122 H 2.772866 -0.640220 1.352312 32 C -0.978509 5.020795 1.904051 123 C -1.282827 -0.728668 3.437566 33 H -1.752992 5.776583 1.776388 124 H -2.035575 -0.363832 2.753006 34 H -0.026337 5.490432 1.643983 125 C -1.651910 -1.120084 4.714966 35 H -0.922263 4.741151 2.956608 126 C -0.678941 -1.601890 5.632857 36 C -1.542734 4.312426 -0.453831 127 C 0.657199 -1.657544 5.268703 37 H -0.718767 4.947385 -0.791317 128 H 1.403021 -2.005381 5.975631 38 H -1.587885 3.456552 -1.132078 129 C 1.004619 -1.264635 3.977633 39 C -2.814062 5.135916 -0.624305 130 C 0.056004 -0.822082 3.050436 40 C -2.903331 2.934198 2.936449 131 C -3.102800 -1.068703 5.116515 41 H -3.415778 1.990536 3.140096 132 H -3.493436 -2.082570 5.254357 42 H -2.008006 2.918943 3.561370 133 H -3.704537 -0.578125 4.346693 43 C -3.827786 4.061275 3.388211 134 H -3.249647 -0.523018 6.054293 44 H -3.352138 5.040226 3.289835 135 C -1.102712 -2.069331 7.000008 45 H -4.720691 4.086544 2.750079 136 H -1.600693 -1.274174 7.565467 46 C -4.301842 3.854265 4.818570 137 H -0.244154 -2.410853 7.583065 47 C -4.644412 1.143536 0.599740 138 H -1.813193 -2.899875 6.922343 48 H -4.715969 2.052253 -0.004786 139 N 2.224030 -1.221183 3.317143 49 H -5.008296 1.388669 1.603392 140 N 0.705950 -0.536129 1.847668 50 H -5.336456 0.435782 0.160895 141 N -0.935335 1.470648 0.741670 51 C -5.162160 -1.944721 0.713319 142 N -1.565839 -1.112750 0.217893 52 H -5.493403 -2.987319 0.687246 143 N 1.132781 -1.380423 -0.728047 53 H -5.940372 -1.365139 0.222761 144 N 1.357422 1.297306 -0.287858 54 H -5.088827 -1.639471 1.759514 145 N -3.722792 4.616377 -1.482701 55 C -4.028522 -1.875830 -1.562908 146 H -4.553176 5.154405 -1.690311 56 H -3.056441 -1.937058 -2.060909 147 H -3.535182 3.800681 -2.045818
57 H -4.576611 -2.793915 -1.794283 148 N -4.673679 4.978040 5.470799 58 C -4.842798 -0.730421 -2.145623 149 H -5.069853 4.899739 6.396651 59 C -2.983092 -3.499149 1.798523 150 H -4.659380 5.885892 5.031642 60 H -2.847656 -2.646358 2.467431 151 N -4.152640 0.197176 -2.838544 61 H -3.992093 -3.875664 1.975912 152 H -4.664848 0.987137 -3.207170 62 C -1.988300 -4.586807 2.184358 153 H -3.138458 0.214325 -2.900751 63 H -2.094477 -5.464359 1.534876 154 N -1.374135 -6.056177 4.011631 64 H -0.956175 -4.240160 2.061714 155 H -1.421342 -6.385435 4.965051 65 C -2.163112 -5.025783 3.631369 156 H -0.721810 -6.498610 3.382262 66 C 1.332792 -3.491280 -3.100314 157 N 6.636870 -3.440983 -2.308733 67 H 1.221938 -2.477988 -3.499491 158 H 7.023654 -3.407917 -3.241741 68 H 0.378916 -4.013140 -3.217565 159 H 7.171067 -3.033468 -1.556327 69 H 2.092405 -4.013058 -3.689517 160 N 7.210580 3.031878 1.605861 70 C 1.906315 -4.914213 -1.134472 161 H 6.724927 3.730371 2.147857 71 H 2.681993 -5.417740 -1.714562 162 N 3.736242 6.751559 -0.631618 72 H 0.971834 -5.458742 -1.294049 163 H 4.478210 7.349319 -0.294819 73 H 2.154675 -4.978874 -0.071913 164 H 3.284206 6.994504 -1.499995 74 C 4.048336 -2.942052 -0.383438 165 N -1.096352 0.578607 -2.780173 75 H 3.531887 -3.121661 0.564502 166 O 6.342048 0.823490 4.099777 76 H 4.677698 -2.065421 -0.211722 167 O 8.374619 2.230453 4.089684 77 C 4.978720 -4.139617 -0.669401 168 O 7.261217 1.828071 6.301880 78 H 5.806417 -4.104504 0.045792 169 O 8.482173 -0.151065 5.100498 79 H 4.461740 -5.086099 -0.521032 170 O -3.015672 6.190847 -0.031435 80 C 5.501911 -4.142666 -2.092564 171 O -4.357820 2.744293 5.338443 81 C 4.526039 -0.038069 -1.837527 172 O -6.064099 -0.670629 -2.002640 82 H 4.637179 0.702071 -2.632846 173 O -2.951790 -4.488547 4.403140 83 H 4.765233 -0.998931 -2.288075 174 O 4.895939 -4.703884 -3.003288 84 H 5.295226 0.168895 -1.087062 175 O 7.006234 1.196559 0.300741 85 C 2.941844 3.014966 -2.496762 176 O 3.823856 5.473446 1.230827 86 H 1.887702 3.023976 -2.789061 177 O 4.413482 -1.909407 2.921052 87 H 3.457884 2.309687 -3.151075 178 O 3.767109 0.956558 3.607506 88 H 3.359680 4.005452 -2.695292 179 H 4.521572 1.573893 3.619770 89 C 4.614730 2.817024 -0.638788 180 O 6.576838 -3.233295 3.985330 90 H 5.242308 2.276391 -1.344241 181 H 5.693686 -3.606759 3.836409 91 H 4.857786 3.874610 -0.782421
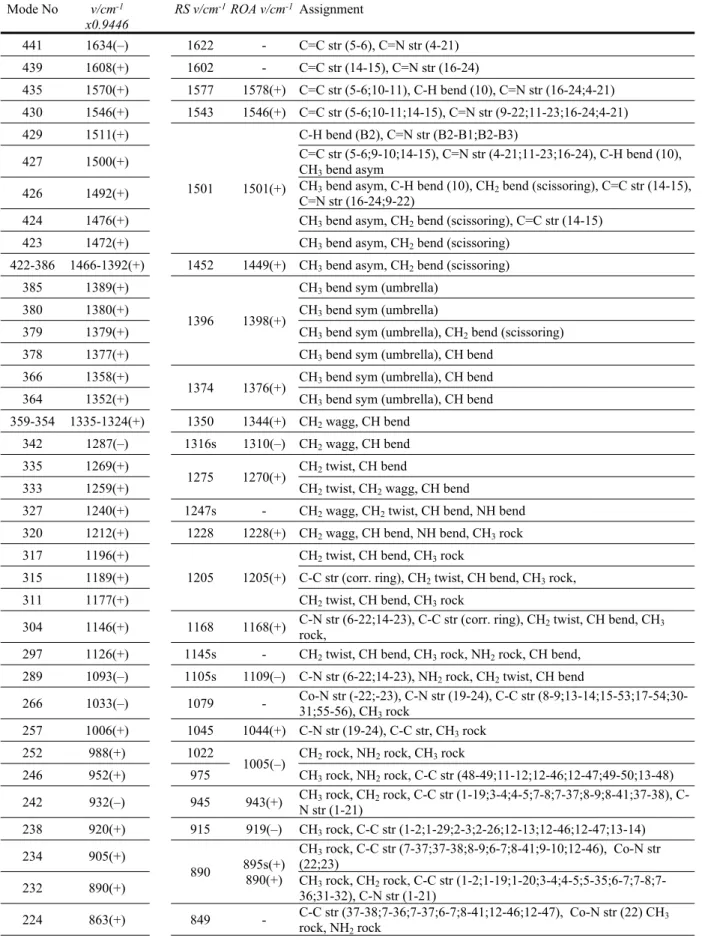
Table S2. Calculated and experimental frequencies of cyanocobalamin. Calculations Experimental Mode No ROA v/cm-1 x0.9446 RS v/cm -1ROA v/cm-1 Assignment 441 1634(–) 1622 - C=C str (5-6), C=N str (4-21) 439 1608(+) 1602 - C=C str (14-15), C=N str (16-24) 435 1570(+) 1577 1578(+) C=C str (5-6;10-11), C-H bend (10), C=N str (16-24;4-21) 430 1546(+) 1543 1546(+) C=C str (5-6;10-11;14-15), C=N str (9-22;11-23;16-24;4-21) 429 1511(+) C-H bend (B2), C=N str (B2-B1;B2-B3) 427 1500(+) C=C str (5-6;9-10;14-15), C=N str (4-21;11-23;16-24), C-H bend (10), CH 3 bend asym
426 1492(+) CH3 bend asym, C-H bend (10), CH2 bend (scissoring), C=C str (14-15),
C=N str (16-24;9-22)
424 1476(+) CH3 bend asym, CH2 bend (scissoring), C=C str (14-15)
423 1472(+)
1501 1501(+)
CH3 bend asym, CH2 bend (scissoring)
422-386 1466-1392(+) 1452 1449(+) CH3 bend asym, CH2 bend (scissoring)
385 1389(+) CH3 bend sym (umbrella)
380 1380(+) CH3 bend sym (umbrella)
379 1379(+) CH3 bend sym (umbrella), CH2 bend (scissoring)
378 1377(+)
1396 1398(+)
CH3 bend sym (umbrella), CH bend
366 1358(+) CH3 bend sym (umbrella), CH bend
364 1352(+) 1374 1376(+) CH3 bend sym (umbrella), CH bend
359-354 1335-1324(+) 1350 1344(+) CH2 wagg, CH bend
342 1287(–) 1316s 1310(–) CH2 wagg, CH bend
335 1269(+) CH2 twist, CH bend
333 1259(+) 1275 1270(+) CH2 twist, CH2 wagg, CH bend
327 1240(+) 1247s - CH2 wagg, CH2 twist, CH bend, NH bend
320 1212(+) 1228 1228(+) CH2 wagg, CH bend, NH bend, CH3 rock
317 1196(+) CH2 twist, CH bend, CH3 rock
315 1189(+) C-C str (corr. ring), CH2 twist, CH bend, CH3 rock,
311 1177(+)
1205 1205(+)
CH2 twist, CH bend, CH3 rock
304 1146(+) 1168 1168(+) C-N str (6-22;14-23), C-C str (corr. ring), CH2 twist, CH bend, CH3
rock,
297 1126(+) 1145s - CH2 twist, CH bend, CH3 rock, NH2 rock, CH bend,
289 1093(–) 1105s 1109(–) C-N str (6-22;14-23), NH2 rock, CH2 twist, CH bend
266 1033(–) 1079 - Co-N str (-22;-23), C-N str (19-24), C-C str (8-9;13-14;15-53;17-54;30-31;55-56), CH
3 rock
257 1006(+) 1045 1044(+) C-N str (19-24), C-C str, CH3 rock
252 988(+) 1022 CH2 rock, NH2 rock, CH3 rock
246 952(+) 975 1005(–) CH3 rock, NH2 rock, C-C str (48-49;11-12;12-46;12-47;49-50;13-48) 242 932(–) 945 943(+) CH3 rock, CH2 rock, C str (1-19;3-4;4-5;7-8;7-37;8-9;8-41;37-38), C-N str (1-21) 238 920(+) 915 919(–) CH3 rock, C-C str (1-2;1-29;2-3;2-26;12-13;12-46;12-47;13-14) 234 905(+) CH3 rock, C-C str (7-37;37-38;8-9;6-7;8-41;9-10;12-46), Co-N str (22;23) 232 890(+) 890 895s(+)890(+) CH 3 rock, CH2 rock, C-C str (1-2;1-19;1-20;3-4;4-5;5-35;6-7;7-8;7-36;31-32), C-N str (1-21) 224 863(+) 849 - C-C str (37-38;7-36;7-37;6-7;8-41;12-46;12-47), Co-N str (22) CH3 rock, NH2 rock
221 846(+) 837(+) C-C str (60-61;42-43;8-9;12-46;12-47;11-12;13-48;31-32;10-11;48-49), CH
3 rock, CH2 rock, NH2 rock
212 811(+) 817s 823(+) C-C str (49-50;48-49;13-48;12-47;12-13), C-N str (61-63), CH2 rock,
NH2 rock
211 800(+) 792 799(+) C-H bend out of plane (10)
205 767(+) 769s - CH3 rock,CH2 rock, C-C str (37-38;6-7;7-36;8-9), Co-N str (22)
203 749(+) CH3 rock,CH2 rock, corrin ring tors and bend
194 720(+) corrin ring tors and bend, benzimidazole C-C str 190 707(+)
732 732(+)
CH2 rock, NH2 twist, CCC bend, CC, CN tors
186 672(+) 696 695(–) CH2 rock, NH2 twist, corrin ring tors and bend , CCC bend, CC, CN tors
177 627(+) NH2 twist, corrin ring tors and bend
173 607(+) 636 635(+) NH2 twist, corrin ring bend
168 584(+) 584 585(+) NH2 twist
165 560(+) NH2 twist, corrin ring tors and bend
164 557(+) 557 558(+) corrin ring tors and bend, CCN, CNC bend, CC, CN tors 152 498(+) 518 518(+) corrin ring tors and bend, NH2 twist, CCC bend, CC, CN tors
148 482(–) Co-C≡N bend, C≡N twist, O-H bend (7R), benzimidazole ring breathing, Co-N bend (B3) 147 481(–) Co-C≡N bend, C≡N twist, O-H bend (7R), benzimidazole ring breathing, Co-N bend (B3) 146 479(–)
496 497(–)
Co-C≡N bend, C≡N twist, corrin ring tors and bend
144 468(+) Co-C≡N bend, corrin ring tors and bend, CCN, CNC bend, CC, CN tors 142 461(+) Co-C≡N bend, C≡N twist, corrin ring tors and bend, CCN, CNC bend, CC, CN tors, O-H bend (7R) 141 459(+)
427 429(+)
C≡N twist, corrin ring tors and bend, CCN, CNC bend, CC, CN tors, O-H bend (7R)
129 420(+) CCN, CNC bend, CC, CN tors, Co-N str (23;24)
125 402(+) 404 408(+) C≡N twist, Co-N str (22;23;24), CCN, CNC bend, CC, CN tors Abbreviations: str – stretching; bend – bending; sym – symmetric; asym – asymmetric; wagg – wagging; twist – twisting; rock – rocking; tors – torsion; s – shoulder, (+) and (–) – positive and negative ROA intensities, numbers in brackets denotes atoms involved in vibrations accordingly to the Scheme 1 numeration.
Detailed characteristics of ECD and UV-vis spectra of cobalamins
UV-Vis absorption spectra of cobalamin species can be categorized as so-called “unique” (i.e. MeCbl, AdoCbl) or “typical” (CNCbl)7,8 depending on the intensity and width of the α/ and
bands assigned mostly to the corrin-based * transitions along the long C5--C15 and short Co--C10 axis of the macrocycle, respectively.8,9 The OH-substituted cobalamin exhibits the
electronic spectrum in-between the “unique” and “typical”. In the case of non-alkylcobalamins, like CNCbl, the UV-Vis absorption spectrum is characterised by two major features. First is the / band with the more intense counterpart at 550 nm and less intense at 521 nm being the electronic origin and vibrational progression, respectively, of the electronic excitation from the orbital HOMO to the orbital LUMO of the corrin ring. The second feature is the band in the near-ultraviolet region arising from several excitations involving molecular orbitals with
The detailed assignment of the UV-Vis and ECD spectra is given elsewhere.7,8,10 Nevertheless,
in the light of further considerations it is important to underline here the differences in the electronic spectra of studied cobalamins. In particular, previous thorough analysis demonstrated that UV-Vis spectrum of CNCbl in the α/ range exhibited vibrational progression of a single electronic transition (at 550 nm, 521 nm, 481 nm, Figure S5: band a, a’, a” respectively), contrarily to alkylcobalamins that showed two bands due to two electronic transitions (at 525 and 495 nm).8
Figure S5. Comparison of experimental (black) and calculated (red) UV-Vis and ECD spectra of CNCbl, combined with calculated transition energies and their oscillatory and rotatory strengths (black vertical lines). Experimental and theoretical incident light wavelengths used in the Raman/ROA calculations are marked by green dotted lines.
Nevertheless, experimental ECD spectrum of CNCbl possessed two minima assigned to two distinct transitions at 550 (band a) and 507 nm (band b of null intensity in the UV-Vis absorption spectrum), and the minimum at 483 nm assigned to the vibrational progression (band a”).8
Experimental UV-Vis and ECD spectra of CNCbl correspond relatively well in the α/β spectral region with our simple theoretical TD-DFT model, apart from vibrational progression of the
first electronic state that is not taken into account in the vertical approximation calculations. Similarly to the experiment, two transitions (1 and 2) of the lowest energy (443 and 413 nm) have negative rotatory strengths, and the second one possess a rather weak UV-Vis intensity. Nevertheless, the energy of the transition 2 is underestimated in calculations and close to the nearby transition 3 (409 nm) with positive rotatory strength (Figure S5, Table S3). As it was mentioned, first electronic transition has mostly corrin ring * nature. However, molecular orbitals involved in the second (negative ECD) and third (positive ECD) electronic transitions of CNCbl are composed also by CN-π, DMB-π and Co 3d orbitals (Table S4, Figure S6). Experimental spectra below α/β region are also reproduced well by calculations, however ECD band assignment below 300 nm is not so straightforward as for UV-Vis (Figure S5). Predicted energies of electronic transitions are underestimated at the chosen theory level, however, in order to show relationship of incident light wavelength used to record experimental ROA/Raman spectra (vide infra), on position of the predicted electronic transitions, final theoretical electronic spectra were not shifted to fit the experimental results.
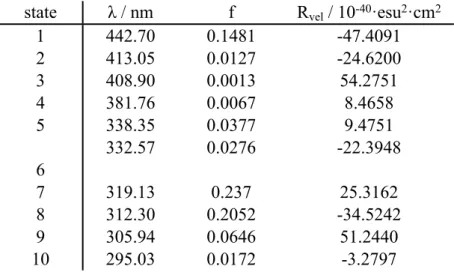
Table S3. Calculated energies (in nm), oscillator strengths (f) and rotatory strengths (Rvel) of
first 10 electronic transitions of CNCbl calculated at CAM-B3LYP/6-31G(d)/MDF10/6-31G(d)/PCM theory level.
state λ / nm f Rvel / 10-40·esu2·cm2
1 442.70 0.1481 -47.4091 2 413.05 0.0127 -24.6200 3 408.90 0.0013 54.2751 4 381.76 0.0067 8.4658 5 338.35 0.0377 9.4751 6 332.57 0.0276 -22.3948 7 319.13 0.237 25.3162 8 312.30 0.2052 -34.5242 9 305.94 0.0646 51.2440 10 295.03 0.0172 -3.2797
For OHCbl, the shape of ECD is considerably different in comparison to CNCbl, with two bands of the opposite sign exhibited in the α/ range (Figure 1, manuscript). That significant differences in ECD between CNCbl and OHCbl is caused by different character of studied ligands. CN– is a moderate σ-donor and strong π-acceptor, while OH– is a weak σ-donor and
strong π-donor that influences the electronic properties of the corrin ring. It is also reflected by the hipsochromic shift of the α/ and γ absorption bands of OHCbl compared to CNCbl that is associated with a well-known trend, where “typical” Cbl absorption spectra shift to higher energy with decreasing σ-donor strength of the upper axial ligand.8
These differences in the electronic absorption impact significantly on resonance conditions and have an impact on observed RROA spectra (vide infra). ECD spectra are very sensitive on the
macrocycle.7 Replacing of a CN group with a bulky HC≡CPhC≡C group has lower effect
on UV-Vis and ECD signals than replacement with OH (Figure 1, manuscript).
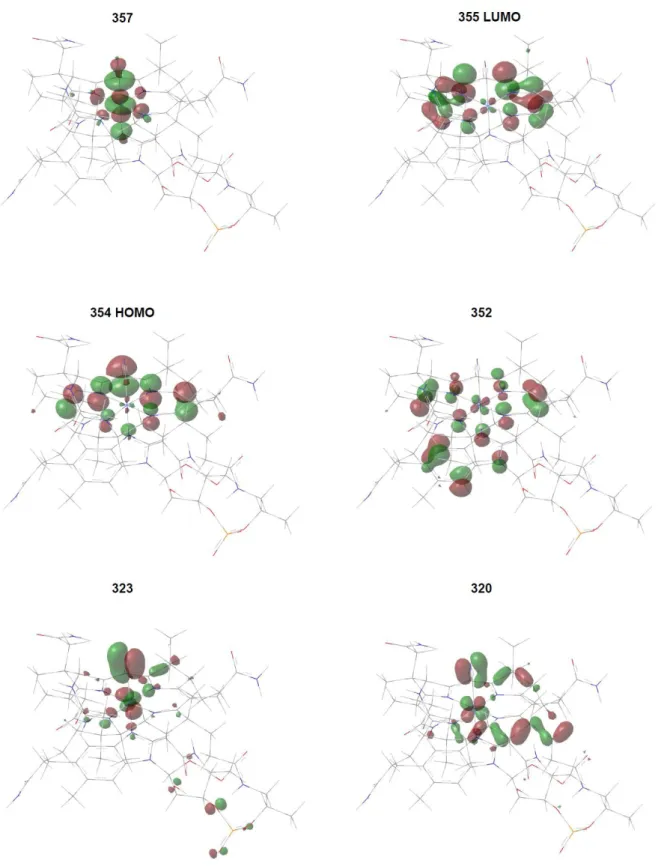
Table S4. Dominant molecular orbital (MO) excitations along with energies (in nm), oscillator strengths (f) and rotatory strengths (Rvel) of the first 3 electronic transitions of CNCbl calculated
at CAM-B3LYP/6-31G(d)/MDF10/6-31G(d)/PCM theory level.
state λ / nm f Rvel excitation % donor MO acceptor MO
1 442.70 0.1481 -47.4091 354→355 88 cor-π (HOMO) cor-π* (LUMO) 2 413.05 0.0127 -24.6200 320→357 352→357 11 11 cor-π/CN-π/Co 3dxy cor-π/DMB-π/Co 3dxz Co 3dz2/cor-π*/CN- π* Co 3dz2/cor-π*/CN- π* 3 408.90 0.0013 54.2751 323→357 12 cor-π/CN-π/Co 3dxz Co 3dz2/cor-π*/CN- π*
Figure S6. Molecular orbital contours, dominant in the first 3 electronic states of CNCbl calculated at CAM-B3LYP/6-31G(d)/MDF10/6-31G(d)/PCM theory level, convoluted in the GaussView 6 software.
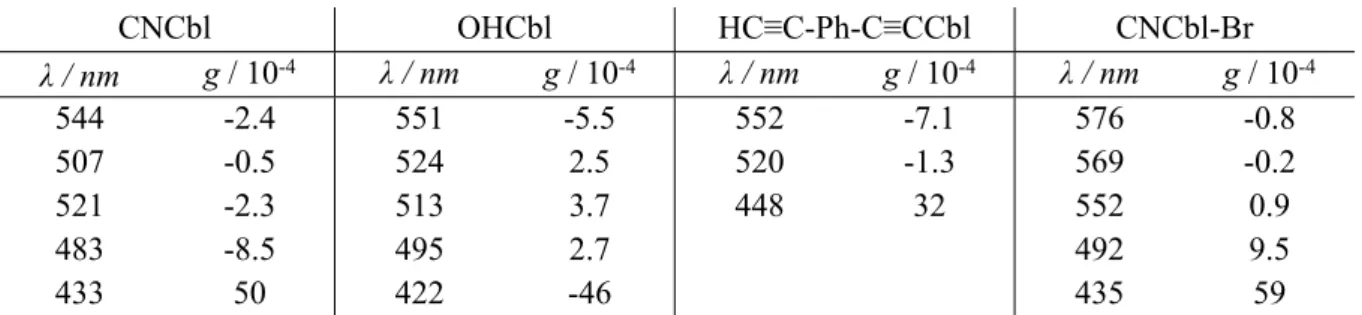
g-factor values for obtained ECD and UV-vis spectra are given in Table S5.
Table S5. Dissymmetry factor (g-factor, ECD/UV-vis) values, plotted for selected transitions, obtained from CNCbl, OHCbl, HC≡C-Ph-C≡CCbl and CNCbl-Br experimental spectra.
CNCbl OHCbl HC≡C-Ph-C≡CCbl CNCbl-Br λ / nm g / 10-4 λ / nm g / 10-4 λ / nm g / 10-4 λ / nm g / 10-4 544 -2.4 551 -5.5 552 -7.1 576 -0.8 507 -0.5 524 2.5 520 -1.3 569 -0.2 521 -2.3 513 3.7 448 32 552 0.9 483 -8.5 495 2.7 492 9.5 433 50 422 -46 435 59
Detailed characteristics of RR and RROA spectra of cobalamins
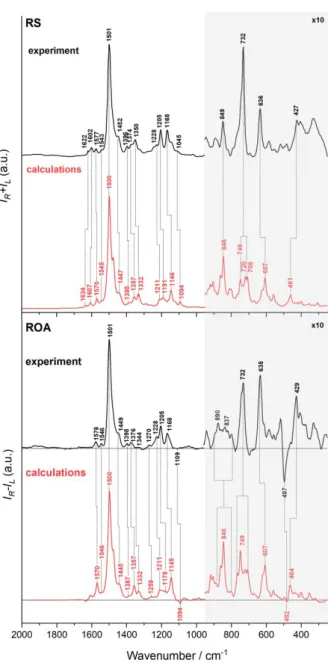
Calculated Raman and ROA spectra (Figure S7; Raman/ROA band assignment given in Table S2) are in good agreement with experimental results. Computed pre-resonance ROA and Raman spectra (470 nm excitation line), similarly to the experimental resonance spectra, show one dominant in intensity band at around 1500 cm-1, and other low intensity transitions with
similar to experiment relative intensities, except the spectral region below 1000 cm-1, where
computed intensities are visibly lower. Calculated ROA signals, in agreement with the experimental ones, are predominantly of the positive sign, i.e. opposite in sign to the ECD in the region of ROA excitation line, due to the close proximity of electronic transitions with the negative rotatory strengths (Figure S7).
Figure S7. Comparison of experimental (black) and calculated (red) Raman and ROA spectra of CNCbl. Calculated frequencies were multiplied by a factor of 0.9446 to fit to the experimental ones.
Interestingly, calculations of the pre-resonance ROA spectra results also in signals of the negative intensity, in particular bands at 1094 and 482 cm-1 (in experimental spectrum at 1109
and 497 cm-1, respectively), confirming that obtained ROA spectra of cobalamins are, indeed,
bisignate. We calculated the preresonance Raman/ROA spectra also using other excitation lines (Figure 3, manuscript). The closer the excitation line is to the first electronic state (443 nm, negative ECD), that more monosignate (positive) ROA is. For 400 nm and 420 nm lines we do see bisignate ROA spectra due to close proximity of two electronic transitions (2 and 3) with opposite in sign rotatory strengths; while for the ROA spectra calculated at 650 nm excitation line, CNCbl is rather in the far from resonance conditions, that gives also bisignate ROA spectrum. Moreover, we do observe selective ROA intensity enhancement of vibrations specific
character, but they possess opposite in sign ECD. Theoretical ROA, calculated at 420 nm line (close to the 2nd transition) and 400 nm line (close to the 3rd transition), are in some part of the
spectra opposite in sign to each other, and, additionally, ROA intensity of vibrations due to Co-CN, and CN are more enhanced than the others.
CID values for obtained ROA and Raman spectra are given in Table S6.
Table S6. CID (ROA/Raman) values, plotted for selected transitions from CNCbl, OHCbl, HC≡C-Ph-C≡CCbl and CNCbl-Br experimental spectra.
CNCbl OHCbl HC≡C-Ph-C≡CCbl CNCbl-Br
v / cm-1 CID / 10-4 v / cm-1 CID / 10-4 v / cm-1 CID / 10-4 v / cm-1 CID / 10-4
1578 4.1 1578 4.0 1545 5.7 1561 1.3 1501 4.3 1501 4.5 1501 3.8 1522 3.3 1452 3.2 1447 3.1 1447 3.6 1476 4.6 1376 1.9 1367 7.2 1376 2.2 1392 10 1310 -3.3 1355 5.9 1354 -2.6 1364 20 1205 3.6 1203 2.2 1207 4.1 1336 -4.3 1168 2.4 1168 3.2 1168 1.6 1203 3.2 732 2.2 735 1.3 730 3.0 1161 2.2 636 5.7 637 4.6 636 3.7 1108 4.3 497 -40 516 3.5 486 6.0 815 7.4 427 6.1 493 -14 455 -11 728 2.6 431 1.4 392 8.5 639 16 395 -1.9 520 9.6 500 -46 468 82 396 4.0 References
(1) Prieto, L.; Rossier, J.; Derszniak, K.; Dybas, J.; Oetterli, R. M.; Kottelat, E.; Chlopicki, S.; Zelder, F.; Zobi, F. Modified Biovectors for the Tuneable Activation of
Anti-Platelet Carbon Monoxide Release. Chem. Commun. 2017, 53 (51), 6840–6843.
(2) Rossier, J.; Nasiri Sovari, S.; Pavic, A.; Vojnovic, S.; Stringer, T.; Bättig, S.; Smith, S. G.; Nikodinovic-Runic, J.; Zobi, F. Antiplasmodial Activity and In Vivo
Bio-Distribution of Chloroquine Molecules Released with a 4-(4-Ethynylphenyl)-Triazole Moiety from Organometallo-Cobalamins. Molecules 2019, 24 (12).
(3) Frisch, M. J.; Trucks, G. W.; Schlegel, H. B.; Scuseria, G. E.; Robb, M. A.;
Cheeseman, J. R.; Scalmani, G.; Barone, V.; Petersson, G. A.; Nakatsuji, H.; Li, X.; Caricato, M.; Marenich, A.; Bloino, J.; Janesko, B. G.; Gomperts, R.; Mennucci, B.; Hratchian, H. P.; Ortiz, J. V.; Izmaylov, A. F.; Sonnenberg, J. L.; Williams-Young, D.; Ding, F.; Lipparini, F.; Egidi, F.; Goings, J.; Peng, B.; Petrone, A.; Henderson, T.; Ranasinghe, D.; Zakrzewski, V. G.; Gao, J.; Rega, N.; Zheng, G.; Liang, W.; Hada, M.;
Ehara, M.; Toyota, K.; Fukuda, R.; J. Hasegawa; Ishida, M.; Nakajima, T.; Honda, Y.; Kitao, O.; Nakai, H.; Vreven, T.; Throssell, K.; J. A. Montgomery, J.; Peralta, J. E.; Ogliaro, F.; Bearpark, M.; Heyd, J. J.; Brothers, E.; Kudin, K. N.; Staroverov, V. N.; Keith, T.; Kobayashi, R.; Normand, J.; Raghavachari, K.; Rendell, A.; Burant, J. C.; Iyengar, S. S.; Tomasi, J.; Cossi, M.; Millam, J. M.; Klene, M.; Adamo, C.; Cammi, R.; Ochterski, J. W.; Martin, R. L.; Morokuma, K.; Farkas, O.; Foresman, J. B.; Fox, D. J. Gaussian 09, Revision E.01; Gaussian, Inc: Wallingford CT, 2016.
(4) Prieto, L.; Neuburger, M.; Spingler, B.; Zelder, F. Inorganic Cyanide as Protecting Group in the Stereospecific Reconstitution of Vitamin B12 from an Artificial Green
Secocorrinoid. Org. Lett. 2016, 18 (20), 5292–5295.
(5) Dennington, R.; Keith, T. A.; Millam, J. M. GaussView, Version 6.1. Semichem Inc: Shawnee Mission, KS 2016.
(6) O’boyle, N. M.; Tenderholt, A. L.; Langner, K. M. Cclib: A Library for Package-Independent Computational Chemistry Algorithms. J. Comput. Chem. 2008, 29 (5), 839–845.
(7) Brunold, T. C. Combined Spectroscopic/computational Studies of Metal Centers in Proteins and Cofactors: Application to Coenzyme B12. Chimia (Aarau). 2004, 58 (4),
186–193.
(8) Stich, T. A.; Brooks, A. J.; Buan, N. R.; Brunold, T. C. Spectroscopic and
Computational Studies of Co3+-Corrinoids: Spectral and Electronic Properties of the
B12 Cofactors and Biologically Relevant Precursors. J. Am. Chem. Soc. 2003, 125 (19),
5897–5914.
(9) Salama, S.; Spiro, T. G. Visible and Near‐ultraviolet Resonance Raman Spectra of Photolabile Vitamin B12 Derivatives with a Rapid‐flow Technique. J. Raman
Spectrosc. 1977, 6 (2), 57–60.
(10) Park, K.; Brunold, T. C. Combined Spectroscopic and Computational Analysis of the Vibrational Properties of Vitamin B12 in Its Co3+, Co2+, and Co1+ Oxidation States. J.
Phys. Chem. B 2013, 117 (18), 5397–5410.
(11) Reig, A. J.; Conrad, K. S.; Brunold, T. C. Combined Spectroscopic/computational Studies of Vitamin B12 Precursors: Geometric and Electronic Structures of