HAL Id: hal-00295693
https://hal.archives-ouvertes.fr/hal-00295693
Submitted on 20 Jul 2005
HAL is a multi-disciplinary open access
archive for the deposit and dissemination of
sci-entific research documents, whether they are
pub-lished or not. The documents may come from
teaching and research institutions in France or
abroad, or from public or private research centers.
L’archive ouverte pluridisciplinaire HAL, est
destinée au dépôt et à la diffusion de documents
scientifiques de niveau recherche, publiés ou non,
émanant des établissements d’enseignement et de
recherche français ou étrangers, des laboratoires
publics ou privés.
particle formation and growth: a comparison between
boundary layers in Northern and Central Europe
V. Fiedler, M. Dal Maso, M. Boy, H. Aufmhoff, J. Hoffmann, T. Schuck, W.
Birmili, M. Hanke, J. Uecker, F. Arnold, et al.
To cite this version:
V. Fiedler, M. Dal Maso, M. Boy, H. Aufmhoff, J. Hoffmann, et al.. The contribution of sulphuric acid
to atmospheric particle formation and growth: a comparison between boundary layers in Northern
and Central Europe. Atmospheric Chemistry and Physics, European Geosciences Union, 2005, 5 (7),
pp.1773-1785. �hal-00295693�
www.atmos-chem-phys.org/acp/5/1773/ SRef-ID: 1680-7324/acp/2005-5-1773 European Geosciences Union
Chemistry
and Physics
The contribution of sulphuric acid to atmospheric particle
formation and growth: a comparison between boundary layers in
Northern and Central Europe
V. Fiedler1,2, M. Dal Maso2, M. Boy2, H. Aufmhoff1, J. Hoffmann1, T. Schuck1, W. Birmili3, M. Hanke1, J. Uecker1, F. Arnold1, and M. Kulmala2
1Max-Planck Inst. for Nuclear Physics, (MPIK), Atmospheric Physics Div., P.O. Box 103980, 69029 Heidelberg, Germany 2University of Helsinki, Dept. Physical Sciences, P. O. Box 64, FIN-00014 Univ. of Helsinki, Finland
3Leibniz Institute for Tropospheric Research, Permoserstr. 15, D-04318 Leipzig, Germany
Received: 6 December 2004 – Published in Atmos. Chem. Phys. Discuss.: 3 February 2005 Revised: 6 June 2005 – Accepted: 16 June 2005 – Published: 20 July 2005
Abstract. Atmospheric gaseous sulphuric acid was mea-sured and its influence on particle formation and growth was investigated building on aerosol data. The measure-ments were part of the EU-project QUEST and took place at two different measurement sites in Northern and Central Europe (Hyyti¨al¨a, Finland, March–April 2003 and Heidel-berg, Germany, March–April 2004). From a comprehensive data set including sulphuric acid, particle number size distri-butions and meteorological data, particle growth rates, par-ticle formation rates and source rates of condensable vapors were inferred. Growth rates were determined in two differ-ent ways, from particle size distributions as well as from a so-called timeshift analysis. Moreover, correlations between sulphuric acid and particle number concentration between 3 and 6 nm were examined and the influence of air masses of different origin was investigated. Measured maximum con-centrations of sulphuric acid were in the range from 1×10⁶ to 16×106cm−3. The gaseous sulphuric acid lifetime with respect to condensation on aerosol particles ranged from 2 to 33 min in Hyyti¨al¨a and from 0.5 to 8 min in Heidelberg. Most calculated values (growth rates, formation rates, va-por source rates) were considerably higher in Central Eu-rope (Heidelberg), due to the more polluted air and higher preexistent aerosol concentrations. Close correlations be-tween H2SO4and nucleation mode particles (size range: 3–
6 nm) were found on most days at both sites. The percentage contribution of sulphuric acid to particle growth was below 10% at both places and to initial growth below 20%. An air mass analysis indicated that at Heidelberg new particles were formed predominantly in air advected from southwesterly di-rections.
Correspondence to: V. Fiedler
(verena.fiedler@mpi-hd.mpg.de)
1 Introduction
Aerosol particles are an important component of the Earth’s atmosphere and influence human life in many different ways. In a global view they may have an impact on climate due to their major role in atmospheric chemistry and their ability to interact with the solar and terrestrial radiation fields (Ra-manathan et al., 2001; Harshvardhan et al., 2002; Garrett et al., 2002).
Also humans can be directly affected, as aerosols may cause harm through inhalation (Stieb et al., 2002; Wichmann et al., 2000; Kim et al., 2000). In order to understand, pre-dict and finally prevent those effects a detailed investigation of the sources and formation mechanisms of aerosol particles is needed.
In recent years sulphuric acid has been found to be a main player in atmospheric new particle formation and in subse-quent particle growth (Boy et al., 2005; Kulmala, 2003; Kul-mala et al., 2004a; Menon and Saxena, 1998; Weber et al., 1999; Birmili et al., 2003). Sulphuric acid can participate in binary, ternary and ion induced nucleation (Korhonen et al., 1999; Yue and Chan, 1979; Arnold, 1982). Therefore it is important to measure gaseous sulphuric acid and aerosol rel-evant parameters simultaneously in order to quantify the con-tribution of sulphuric acid to particle formation and growth.
The aim of the QUEST-project (Quantification of Aerosol Nucleation in the European Boundary Layer) was the qual-itative and quantqual-itative analysis of particle formation and growth in three different European regions. The first cam-paign (QUEST 1) took place in Mace Head (Ireland, coastal atlantic region) in spring 2002, the second (QUEST 2) in Hyyti¨al¨a (Finland, continental boreal forest area) in spring 2003 and the third in San Pietro Capofiume (Italy, QUEST 3a) and Heidelberg (Germany, QUEST 3b) in spring 2004.
Both San Pietro Capofiume and Heidelberg are highly pol-luted continental sites. These sites were selected in order to examine particle formation events in coastal regions, in clean continental air and in more anthropogenically influ-enced continental air.
During the campaign in Hyyti¨al¨a (17 March to 13 April 2003) and during the Heidelberg-campaign (27 February to the 4 April 2004) we have measured gaseous sulphuric acid concentrations and particle number size distributions contin-uously on 21 and 38 days, respectively. From these data par-ticle growth rates, parpar-ticle formation rates and source rates of condensable vapors were inferred and compared for both measurement sites.
2 Materials and methods/experiment 2.1 Measurement sites
2.1.1 SMEAR II, Hyyti¨al¨a
During QUEST 2 data were collected at the Station for Mea-suring Forest Ecosystem-Atmosphere Relations (SMEAR II) in Hyyti¨al¨a, Finland. The station is located in Southern Fin-land (61◦510N, 24◦170E, 181 m asl), with extended areas of Scots Pine (Pinus sylvestris) dominated forests. The condi-tions at the site are typical for a remote location. However, measurements were occasionally affected by pollution from the station buildings (0.5 km away) and the city of Tampere (60 km away), both located in a west-south-west direction (215–265◦). In this work, measurements of gaseous H2SO4,
temperature, solar radiation, humidity, wind-direction, par-ticle number concentration and size distribution (3–500 nm) have been evaluated. A more detailed description of SMEAR II and its instrumentation is available in Kulmala et al. (2001) and http://www.honeybee.helsinki.fi/smear/.
2.1.2 Heidelberg
Data were collected at the MPI-K Heidelberg (Max Planck Institute for Nuclear Physics, http://www.mpi-hd.mpg.de), Germany (49◦230N, 08◦410E, 350 m a.s.l.) about 4 km east-wards of Heidelberg on a hill 200 m above the city within deciduous forest area (beech, maple, chestnut, birch, oak). A farmhouse and a rehabilitation centre are located at a distance of about 0.5 km. To the east of the measurement site, Heidel-berg is surrounded by forested hills (Odenwald) with a maxi-mum altitude of 626 m a.s.l. To the west, Heidelberg borders on the Rhine valley where several large cities with various industrial complexes and power stations are settled (popu-lation of around 7 million within a radius of 80 km). This region is considered to be one of the most polluted areas in Germany. During QUEST 3b measurements of H2SO4, solar
radiation, temperature, humidity, wind direction/speed and particle number size distributions were carried out. Particle
number size distributions (size range 3–900 nm) were mea-sured using a flow-regulated twin Differential Mobility Par-ticle Sizer (DMPS) (see, e.g., Birmili et al., 1999). Ambient aerosol was conducted from outdoors into the DMPS system, and classified in a sheath air stream at RH <5%. The addi-tional meteorological data were measured using a standard weather station (WM 918 by Huger Electronics) with wind measurements on the roof of one of the MPI-K buildings. 2.2 Measurements of gaseous sulphuric acid
Gaseous sulphuric acid was measured at both sites by a chemical ionization mass spectrometer (CIMS) built by the MPI-K Heidelberg (Reiner and Arnold, 1993, 1994; Hanke et al., 2002). The principle of this measurement method is to convert the hardly detectable trace gas into more easily de-tectable product ions through a highly efficient ion-molecule reaction (IMR). The main components of this CIMS appara-tus used in QUEST 2 and 3 are an ion trap mass spectrome-ter, a flow reactor, the ion source and a H2SO4-source used
for calibration. In the ion source reagent ions of the type NO−3(HNO3)n are produced and subsequently introduced
into the flow reactor. The atmospheric air (ambient atmo-spheric pressure), that should be analyzed, is passed through the flow reactor. There the ions undergo an IMR of the type NO−3(HNO3)n+H2SO4 →HSO−4(HNO3)m+(n−m)HNO3
with the trace gas. The rate coefficients of these reactions are close to the ion-molecule collision rate coefficients (around 2×10⁻⁹cm3s−1). Using the mass spectrometer the abun-dance ratio of product and reagent ions is measured. From this ion abundance ratio the H2SO4-concentration in the flow
reactor can be determined, which is typically about 50% of the ambient atmospheric sulphuric acid concentration due to H2SO4-losses to the walls of the sampling line and the flow
reactor. In order to quantify these losses the H2SO4-source
is used for calibrations (production of OH-radicals that lead in reaction with SO2to a certain amount of H2SO4).
More-over, the H2SO4-background signal of the CIMS-instrument
is determined. This affects the H2SO4-detection limit.
During QUEST 2 and 3b this detection limit was as low as about 1×10⁵molecules cm−3corresponding to an atmo-spheric mole fraction of 4×10⁻¹⁵ or 4 ppq. The time-resolution of the H2SO4-measurements was better than 10 s
but usually H2SO4-concentrations were integrated over 100 s
to reduce the statistical error. The absolute uncertainty of the measured H2SO4-concentration is plus or minus 30%,
mainly due to uncertainties of the calibration setup (uncer-tainties of the OH-production, OH losses prior to reaction with SO2etc.). A paper addressing in more detail the CIMS
apparatus is in preparation (Aufmhoff et al., in preparation, 20051).
1Aufmhoff, H., Fiedler, V., Hanke, M. and Arnold, F.:
Atmo-spheric measurements of gaseous sulphuric acid: Deployment of an Ion Trap CIMS-instrument, in preparation, 2005.
2.3 Theory
2.3.1 Condensation sink
The aerosol condensation sink (CS) determines how rapidly molecules will condense onto pre-existing aerosols (Kulmala et al., 2001) and can be calculated from
CS=4π D ∞ Z 0 rβM(r)n(r)dr=4π D X i βMriNi, (1)
with D being the diffusion coefficient of sulphuric acid, βM
the transitional correction factor typically calculated using the expression by Fuchs and Sutugin (1971), Ni and ri are
the number concentration and the radius of the particles in the i’th size class measured with a DMPS system at dry rela-tive humidity. In our case the condensation sink values were calculated over the measured size range at both stations, so from 3 to 500 nm in Hyyti¨al¨a and from 3 to 900 nm in Heidel-berg. The different upper limits of the measured size ranges do not affect a comparison of the CS at the two stations very much, as the concentration of particles above 500 nm was al-ways quite low in Heidelberg (usually below 200 cm−3, see Fig. 3).
2.3.2 Growth rates
Growth rates were calculated in two different ways. The first method was to obtain a growth rate for the entire particle for-mation event by tracking the temporal evolution of the nucle-ation mode from initial sizes of 3 nm up to 25 nm. The point in time of the highest concentration was determined for each size class separately by fitting a lognormal distribution to the temporal evolution of the particle number size distribution of that size class. From these values a growth rate GR1 in nm h−1was calculated (see e.g. M¨akel¨a et al., 2000).
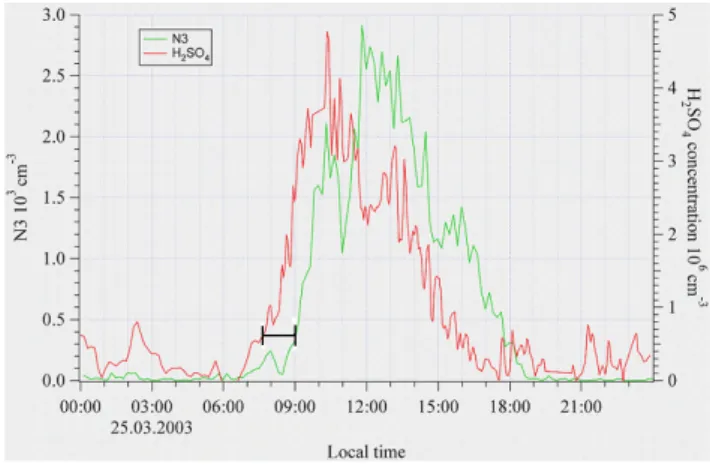
Secondly, we used a so-called timeshift analysis, which compared the shape of two curves – sulphuric acid and the particle number concentration between 3 and 6 nm (N3 hereafter). A similar analysis has been used by Weber et al. (1997) and Harrison et al. (2000). In Fig. 1 the number concentration of the smallest detectable particles N3 and the sulphuric acid concentration are plotted versus time for one example day in Hyyti¨al¨a. The shape of the N3 curve usu-ally follows the sulphuric acid curve with a certain time lag. The time lag is thought to be the result of a H2SO4-driven
formation of 1 nm particles (widely used assumption for the approximate critical cluster size) and the detection of 3 nm particles in the DMPS. Hence the time lag reflects the time required for condensational and coagulational growth. Con-sequently, this time lag allows to estimate a growth rate for the initial particle growth from 1 nm to 3 nm (GR2 hereafter).
Fig. 1. Sulphuric acid concentration (H2SO4)and particle concen-tration between 3 and 6 nm (N3) versus time for one example day in Hyyti¨al¨a. The graph shows the similarity of the shape of the two curves. The time lag, marked by a black bar, indicates the time re-quired for the initial growth from 1 nm to 3 nm. This time interval was chosen for the calculations of growth rate 2, a growth rate for the initial growth.
2.3.3 Particle formation rates
The particle formation rate J3 was determined from the total concentration of particles with diameters smaller than 25 nm (N3−25).
dN3−25
dt =J3 − CoagSc · N3−25−GRout·N3−25 (2)
with CoagSc being the coagulational scavenging coefficient and GRout a coefficient that accounts for growth out of the
25 nm range. Coagulational scavenging causes about 30% loss of fresh particles while growth to diameters bigger than 25 nm can be neglected (Kerminen et al., 2001). There-fore a lower limit for the formation rate 1 concentration/1t in cm−3s−1 was calculated for a time interval between the times when the particle concentration started to increase and when it ceased to increase near its maximum value (Kulmala et al., 2004b). This calculation builds on the assumption that particles are formed in-situ in the air mass under observa-tion and is, particularly, not valid when a different air parcel is transported to the measurement site vertically or horizon-tally.
2.3.4 Condensable vapor concentration and source rates The condensable vapor concentration Cvap is a property for
the expected amount of vapor that is necessary to initiate par-ticle formation and to maintain a certain growth rate.
If the growth rate of the particles is known and with the assumption of binary nucleation of sulphuric acid and water, Cvap can be integrated following Kulmala (1988).
Notably, Cvap is a linear function of the particle growth
Cvap=1.37×107cm−3×GRwhere GR is given in nm h−1.
The factor 1.37×10⁷is mainly dependent on the product of mass and diffusion coefficient of the condensing vapor. In principle one can say, the lower the mass, the higher the dif-fusion coefficient, so their product remains rather constant (Kulmala et al., 2001). Using this we can estimate a source rate Q of the vapor. According to Kulmala (2001) we get for the condensable vapor concentration
dC
dt =Q −CS · C (3)
with C=Cvap−Csat urat ion. Kulmala et al. (1998) showed,
that Csat urat ion ≈ 3 · 106, which is more than one order of
magnitude smaller than Cvap, which means that Csat urat ion
can be neglected.
Now if we assume steady state
dCvap
dt =0 (4)
we get
Q =CS · Cvap (5)
as a value for the source rate of the condensable vapor.
3 Measured data
A total number of 19 particle formation events in Hyyti¨al¨a and 10 in Heidelberg were observed, of which 8 in Hyyti¨al¨a (3 in Heidelberg) were classified class 1, 6 (3) class 2 and 5 (4) class 3. The classification uses the following criteria: class 1 means a clear formation of new 3 nm particles and their following extended growth, class 2 means clear forma-tion but the growth is less pronounced and class 3 means that there is some formation but no or only very poor growth is visible (M¨akel¨a et al., 2000 and Boy and Kulmala, 2002).
The concentration of preexistent background aerosol (mainly particles between 10 and 300 nm) was always slightly higher in Heidelberg than in Hyyti¨al¨a, but at both sites new particle formation was preceded by a strong de-cline of the background particle concentration on most event days. In those cases the total particle number concentration was below 7000 cm−3in Hyyti¨al¨a and below 10 000 cm−3in Heidelberg whereas it reached usually around 15 000 cm−3 at both places during daytime.
Since the Heidelberg measurement site was located on the western slope of a hilly area, number size distributions usu-ally indicated that relatively clean air prevailed during night-times, whereas more polluted air arrived from the Rhine val-ley in the morning when the boundary layer developed, and enveloped the measurement site. Yet this feature did not ex-ist on 7 of the 10 event days and was less pronounced on the other 3 event days.
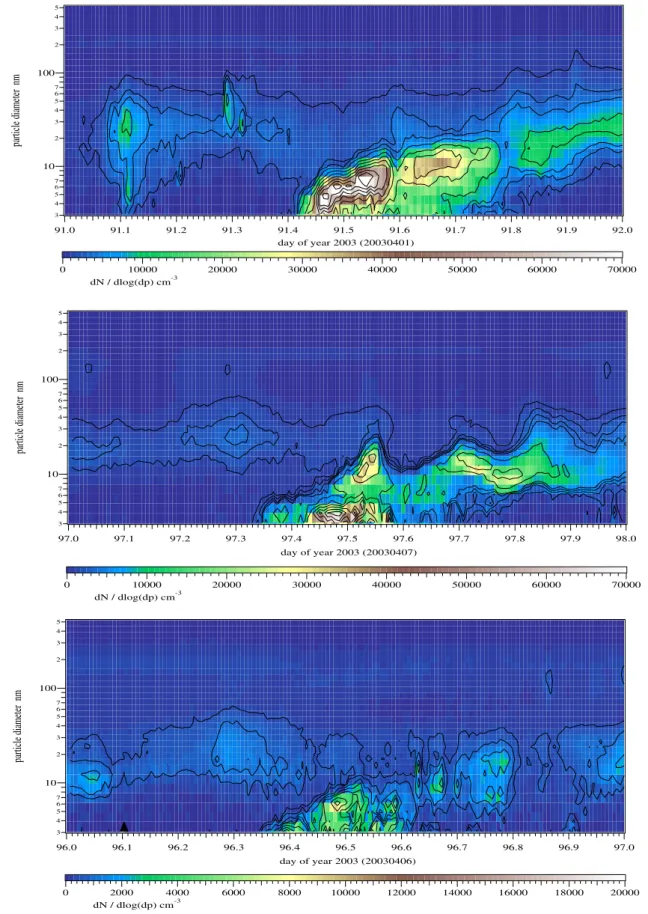
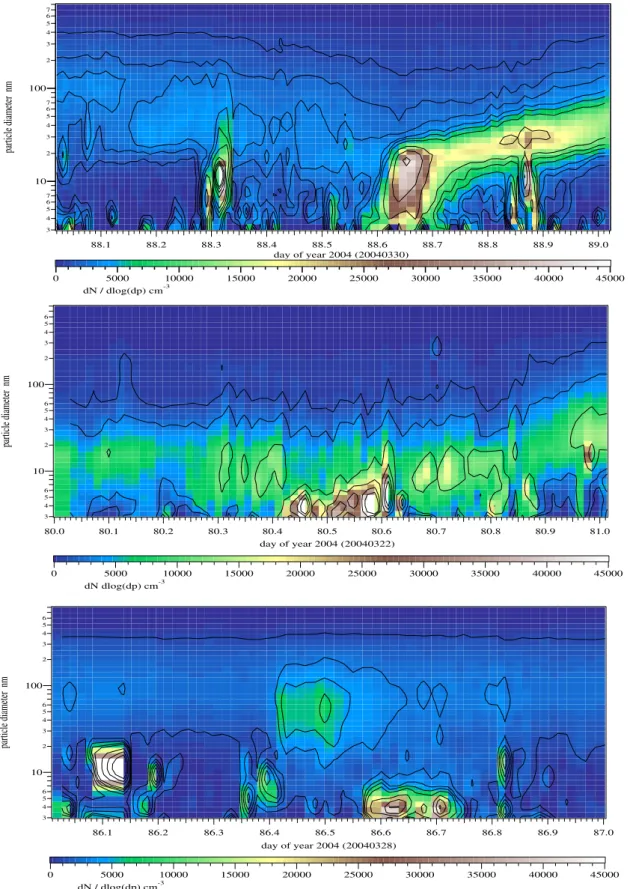
In Figs. 2 and 3 some DMPS plots are shown as examples for class 1, class 2 and class 3 events at both places. A parti-cle formation event in the early morning or late evening, that
occurred sometimes in Heidelberg (see first panel in figure 3) was definitely not caused by sulphuric acid, as the H2SO4
concentration was very low at those times.
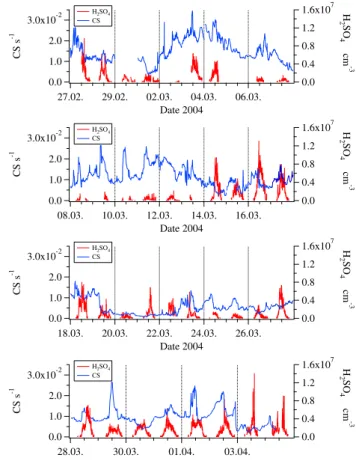
Figures 4 and 5 show the measured sulphuric acid concen-trations and the condensation sink in Hyyti¨al¨a and Heidel-berg, respectively. The concentrations of sulphuric acid were in the same range (1×10⁶–16×106cm−3), but the mean was slightly higher in Heidelberg (3.46×106cm−3)compared to Hyyti¨al¨a (3.04×106cm−3). The values of the condensation sink ranged from 0.002 to 0.035 s−1in Heidelberg and from 0.0005 to 0.007 s−1 in Hyyti¨al¨a. The corresponding life-time CS−1is consequently 2 to 33 min in Hyyti¨al¨a and 0.5 to 8 min in Heidelberg. Moreover, the variation was much higher in Heidelberg, especially during daytime. These high CS values are indicative of the higher degree of pollution (primary particle emissions, secondary aerosol formation) in Central Europe. Furthermore the variations in Heidelberg re-flect the influence of nearby anthropogenic sources, particu-larly localized industry, traffic and households.
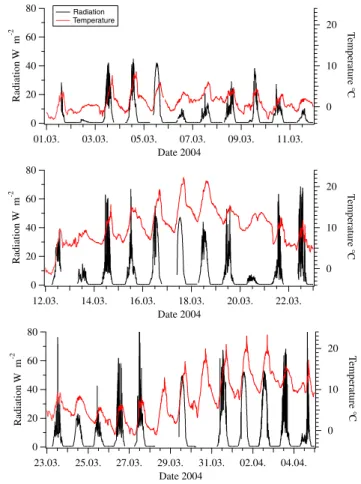
In Figs. 6 and 7 solar radiation and temperature during both campaigns are shown. In Hyyti¨al¨a specifically UV-B radiation (wavelength λ<320 nm) was measured by use of a UV-B sensor; in Heidelberg a Lux sensor (ELV, Multimeter-Interface) was used, with a sensitivity maximum between 500 and 600 nm wavelength. This accounts for the diver-gence of absolute radiation values (up to 40 times higher) in Heidelberg. UV-B radiation with wavelengths smaller than 310 nm is responsible for the formation of O(1D) via the photolysis of ozone, so this is the most interesting wave-length section with regard to sulphuric acid formation. Nev-ertheless, the diurnal variation of the UV-B radiation follows the visible light, with exception of early morning and late evening, when due to the longer way through the atmosphere especially short wavelengths are filtered out of the solar spec-trum. These data were not used for calculations in this paper, but will be of interest for future model calculations on nucle-ation.
During QUEST 2, 16 of the 19 event days were completely sunny whereas the days during QUEST 3b were often cloudy or rainy especially in the beginning of March. On those days very low values of sulphuric acid were measured. Five of the ten event days in Heidelberg were sunny. The mean tem-perature was about 10◦C in Heidelberg and about 2◦C in Hyyti¨al¨a.
4 Results and discussion
Table 1 gives an overview of measured and inferred data on event days derived directly from DMPS plots. Table 2 gives the same inferred data taking GR2 as input values. Overall the mean values for all calculated quantities were higher in Heidelberg compared to Hyyti¨al¨a. For most values like CS and H2SO4we would expect this due to the more polluted air
3 4 5 6 7 10 2 3 4 5 6 7 100 2 3 4 5 particle diameter nm 92.0 91.9 91.8 91.7 91.6 91.5 91.4 91.3 91.2 91.1 91.0 day of year 2003 (20030401) 70000 60000 50000 40000 30000 20000 10000 0 dN / dlog(dp) cm-3 3 4 5 6 7 10 2 3 4 5 6 7 100 2 3 4 5 particle diameter nm 98.0 97.9 97.8 97.7 97.6 97.5 97.4 97.3 97.2 97.1 97.0 day of year 2003 (20030407) 70000 60000 50000 40000 30000 20000 10000 0 dN / dlog(dp) cm-3 3 4 5 6 7 10 2 3 4 5 6 7 100 2 3 4 5 particle diameter nm 97.0 96.9 96.8 96.7 96.6 96.5 96.4 96.3 96.2 96.1 96.0 day of year 2003 (20030406) 20000 18000 16000 14000 12000 10000 8000 6000 4000 2000 0 dN / dlog(dp) cm-3
Fig. 2. Hyyti¨al¨a: Examples for class 1, class 2 and class 3 events as DMPS plots. Particle diameter is plotted versus time, particle number concentration as color code. During new particle formation the particle concentration reached a maximum of 70 000 cm−3for class 1 and class 2 events, a maximum of 20 000 cm−3for class 3. The background particle concentration was usually below 7000 cm−3.
3 4 5 6 7 10 2 3 4 5 6 7 100 2 3 4 5 6 7 particle diameter nm 89.0 88.9 88.8 88.7 88.6 88.5 88.4 88.3 88.2 88.1 day of year 2004 (20040330) 45000 40000 35000 30000 25000 20000 15000 10000 5000 0 dN / dlog(dp) cm-3 3 4 5 6 10 2 3 4 5 6 100 2 3 4 5 6 particle diameter nm 81.0 80.9 80.8 80.7 80.6 80.5 80.4 80.3 80.2 80.1 80.0 day of year 2004 (20040322) 45000 40000 35000 30000 25000 20000 15000 10000 5000 0 dN dlog(dp) cm-3 3 4 5 6 10 2 3 4 5 6 100 2 3 4 5 6 particle diameter nm 87.0 86.9 86.8 86.7 86.6 86.5 86.4 86.3 86.2 86.1 day of year 2004 (20040328) 45000 40000 35000 30000 25000 20000 15000 10000 5000 0 dN / dlog(dp) cm-3
Fig. 3. Heidelberg: Examples for class 1, 2 and class 3 events. During new particle formation the particle concentration reached a maximum of 45 000 cm−3. The background concentration was usually below 10 000 cm−3. In the third panel the high concentrations around 86.1 were not real but caused by an instrument error.
Table 1. For Hyyti¨al¨a and Heidelberg, respectively: Growth Rate 1 (GR1) for the growth starting at 3 nm, formation rate (J3), condensable vapor concentration (Cvap), mean sulphuric acid concentration during event (H2SO4), mean condensation sink (CS mean), source rate (Q),
percentage of H2SO4of the condensable vapor. All calculations basing on GR1. The correlation coefficient r from the correlation analysis
for H2SO4and N3 and the air mass direction are also added.
Date Starting time class GR 1 J3 Cvap H2SO4 CS mean Q Perc. H2SO4 r Direction
(nm h−1) (cm−3s−1) (e8 cm−3) (e6 cm−3) (e-3 s−1) (e5 cm−3s−1) %
Hyyti¨al¨a 18 March 2003 12:00 2 1,60 0.27 0.22 2.10 1.00 0.22 9.50 0.56 19 March 2003 12:00 3 3.00 0.23 0.41 0.60 0.90 0.37 1.50 0.44 N/NW 20 March 2003 10:00 1 1.70 0.46 0.23 2.20 0.80 0.18 9.60 0.69 N/NW 21 March 2003 10:00 1 3.10 1.11 0.42 3.70 1.90 0.80 8.80 0.61 W/SW 23 March 2003 10:00 3 4.20 0.28 0.58 2.00 3.00 1.74 3.40 0.69 24 March 2003 10:00 2 3.10 0.32 0.42 1.40 0.60 0.25 3.30 0.63 N/NW 25 March 2003 10:00 1 2.60 0.49 0.36 2.60 1.10 0.40 7.20 0.77 N/NW 26 March 2003 10:00 2 3.90 1.00 0.53 4.40 2.90 1.54 8.30 0.82 W/SW 27 March 2003 13:30 3 3.00 0.10 0.41 3.40 4.10 1.68 8.30 0.59 W/SW 28 March 2003 10:00 1 3.30 0.45 0.45 1.80 1.70 0.77 4.00 0.54 29 March 2003 10:30 2 6.00 1.72 0.82 2.30 2.30 1.89 2.80 0.69 W/SW 31 March 2003 13:00 3 4.10 1.01 0.56 2.60 1.00 0.56 4.60 0.24 N/NW 1 April 2003 10:00 1 2.30 2.13 0.32 3.20 1.80 0.58 10.00 0.77 2 April 2003 10:00 1 5.10 1.22 0.70 3.80 3.30 2.31 5.40 0.66 W/SW 3 April 2003 10:00 2 12.20 2.45 1.67 7.60 3.60 6.01 4.60 0.82 W/SW 4 April 2003 10:00 1 4.90 6.97 0.67 3.20 1.40 0.94 4.80 0.39 6 April 2003 09:00 3 1.80 0.14 0.25 1.70 0.80 0.20 6.80 0.81 N/NW 7 April 2003 08:00 2 9.00 1.12 1.23 5.30 1.20 1.48 4.30 0.89 N/NW 8 April 2003 09:00 1 6.20 1.16 0.85 3.90 1.90 1.62 4.60 0.80 mean 4.27 1.19 0.58 3.04 1.86 1.24 5.88 0.65 median 3.30 1.00 0.45 2.60 1.70 0.80 4.80 0.69 Table 1. Continued.
Date Starting time class GR 1 J3 Cvap H2SO4 CS mean Q Perc. H2SO4 r Direction
(nm h−1) (cm−3s−1) (e8 cm−3) (e6 cm−3) (e-3 s−1) (e5 cm−3s−1) %
Heidelberg 14 March 2004 12:00 1 14.20 2.42 1.95 2.70 4.08 7.96 1.40 0.66 SW 15 March 2004 12:00 3 22.90 3.82 3.14 2.60 5.14 16.14 0.80 0.04 SW 16 March 2004 12:00 1 5.70 1.30 0.78 6.30 7.14 5.57 8.10 0.31 SE 18 March 2004 12:00 2 8.10 5.95 1.11 4.40 11.27 12.51 4.00 0.60 SW 21 March 2004 12:00 2 7.80 0.65 1.07 2.40 1.64 1.75 2.20 0.79 W 22 March 2004 10:00 2 2.10 0.65 0.29 2.40 1.88 0.55 8.30 0.79 W 28 March 2004 14:00 3 6.70 1.42 0.92 4.20 9.68 8.91 4.60 0.79 NE 30 March 2004 14:00 1 13.39 3.33 1.84 2.20 4.28 7.88 1.20 0.35 NE 2 April 2004 12:00 3 3.30 4.63 0.45 3.20 11.63 5.23 7.10 0.31 3 April 2004 12:00 3 5.70 2.50 0.78 4.20 4.14 3.23 5.40 0.69 mean 8.99 2.67 1.23 3.46 6.09 6.97 4.31 0.53 median 7.25 2.46 1.00 2.95 4.71 6.73 4.30 0.63
In detail GR1 ranges from 1.6 to 12.2 nm h−1in Hyyti¨al¨a and from 2.1 to 22.9 nm h−1in Heidelberg with mean val-ues of 4.27 and 8.99 nm h−1, respectively. Furthermore the growth rate in Heidelberg showed a stronger variabil-ity. From the timeshift calculations we obtained on each day a smaller growth rate for the Hyyti¨al¨a data with a mean
value of 1.11 nm h−1(Table 2). This is consistent with the result by Kulmala (2004a), who found that the growth is al-ways smaller for the first nanometers of growth than for later growth. For Heidelberg this relation could not be observed so clearly and GR2 (mean 7.67 nm h−1)was sometimes higher than GR1 (mean of 8.99 nm h−1). Figures 8 and 9 show both
1.6 1.2 0.8 0.4 0.0 H 2SO 4 10 7 # cm -3 25.03. 27.03. 29.03. 31.03. Date 2003 6 4 2 0 CS 10 -3 s -1 1.6 1.2 0.8 0.4 0.0 H 2SO 4 10 7 # cm -3 01.04. 03.04. 05.04. 07.04. Date 2003 6 4 2 0 CS 10 -3 s -1 1.6 1.2 0.8 0.4 0.0 H 2SO 4 10 7 # cm -3 18.03. 20.03. 22.03. 24.03. Date 2003 6 4 2 0 CS 10 -3 s -1 H2SO4 CS
Fig. 4. Hyyti¨al¨a: Condensation sink (CS) and sulphuric acid (H2SO4)versus time as an overview of the measured data.
growth rates in comparison. Possible reasons for the nearly equal growth rates GR1 and GR2 in Heidelberg could be, that the condensable vapors, here especially the ones with very low saturation vapor pressures, are probably different in re-gions influenced mainly by anthropogenic pollution sources compared to regions with mainly natural sources. So it might be that those organic compounds of urban origin condense easier on small one nanometer aerosol particles than the nat-ural ones and that consequently those different gases cause different growth rates in the beginning (GR2). A second reason could be that in Heidelberg local point sources with high amounts of small particles increase the aerosol concen-tration. In these cases the used timeshift analysis would be inadequate and would overestimate the growth rates GR2.
The formation rates J3 of particles above 3 nm in diame-ter were quite similar in Hyyti¨al¨a and Heidelberg with mean values of 1.2 and 2.7 cm−3s−1and they were usually highest on class 1 event days. This result that the highest forma-tion rates in Hyyti¨al¨a are visible on clear event days is in agreement with results published by Boy et al. (2003). With a low background particle concentration a high amount of condensable vapors is available for new particle formation. Importantly, this has to be seen in the light of the mean
pre-3.0x10⁻² 2.0 1.0 0.0 CS s -1 27.02. 29.02. 02.03. 04.03. 06.03. Date 2004 1.6x10⁷ 1.2 0.8 0.4 0.0 H 2SO 4 # cm -3 H2SO4 CS 3.0x10⁻² 2.0 1.0 0.0 CS s -1 08.03. 10.03. 12.03. 14.03. 16.03. Date 2004 1.6x10⁷ 1.2 0.8 0.4 0.0 H 2SO 4 # cm -3 H2SO4 CS 3.0x10⁻² 2.0 1.0 0.0 CS s -1 18.03. 20.03. 22.03. 24.03. 26.03. Date 2004 1.6x10⁷ 1.2 0.8 0.4 0.0 H 2SO 4 # cm -3 H2SO4 CS 3.0x10⁻² 2.0 1.0 0.0 CS s -1 28.03. 30.03. 01.04. 03.04. Date 2004 1.6x10⁷ 1.2 0.8 0.4 0.0 H 2SO 4 # cm -3 H2SO4 CS
Fig. 5. Heidelberg: Condensation sink (CS) and sulphuric acid (H2SO4)versus time.
existent particle concentration of each day separately. The CS was significantly lower before events than the mean CS of the corresponding day, but the day mean could be finally high, also partly caused by the new particle formation.
From the growth rates a condensable vapor concentration
Cvap was determined according to Sect. 2.3.4. Afterwards
Cvap was compared to the measured sulphuric acid
concen-tration in order to quantify the contribution of sulphuric acid to the formation and growth rates. In case of GR1, we used the mean value of the sulphuric acid concentration during a time interval beginning with the starting time of the forma-tion event and ending in the evening. In case of GR2, a dif-ferent H2SO4-concentration was used because the timeshift
analysis is just applied on the first rise of the H2SO4-curve,
as explained above. Consequently, the mean sulphuric acid concentration during the timeshift interval was used.
Both Cvap and the percentage of sulphuric acid to the
growth rates were determined for GR1 and GR2. The re-sults can be seen in Tables 1 and 2. The percentage contribu-tion of sulphuric acid to the particle growth in Hyyti¨al¨a was higher for GR2 (mean 17.6%) than for GR1 (mean 5.9%). So it seems that in Hyyti¨al¨a sulphuric acid plays a bigger role in formation and the first nanometers of growth (diameter
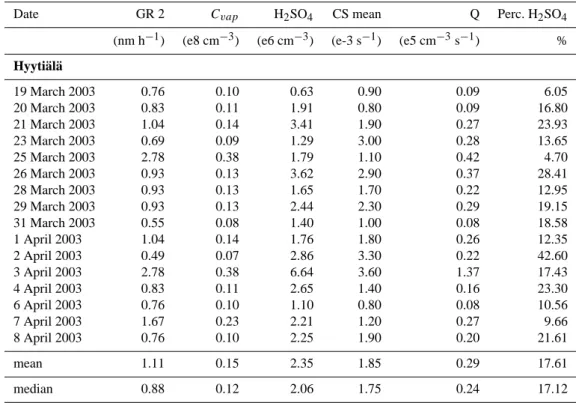
Table 2. For Hyyti¨al¨a and Heidelberg, respectively, basing on the timeshift analysis: Growth Rate 2 (GR2), condensable vapor concen-tration (Cvap), mean sulphuric acid concentration during timeshift interval (H2SO4), mean condensation sink (CS mean), source rate (Q),
percentage of H2SO4of the condensable vapor.
Date GR 2 Cvap H2SO4 CS mean Q Perc. H2SO4
(nm h−1) (e8 cm−3) (e6 cm−3) (e-3 s−1) (e5 cm−3s−1) % Hyyti¨al¨a 19 March 2003 0.76 0.10 0.63 0.90 0.09 6.05 20 March 2003 0.83 0.11 1.91 0.80 0.09 16.80 21 March 2003 1.04 0.14 3.41 1.90 0.27 23.93 23 March 2003 0.69 0.09 1.29 3.00 0.28 13.65 25 March 2003 2.78 0.38 1.79 1.10 0.42 4.70 26 March 2003 0.93 0.13 3.62 2.90 0.37 28.41 28 March 2003 0.93 0.13 1.65 1.70 0.22 12.95 29 March 2003 0.93 0.13 2.44 2.30 0.29 19.15 31 March 2003 0.55 0.08 1.40 1.00 0.08 18.58 1 April 2003 1.04 0.14 1.76 1.80 0.26 12.35 2 April 2003 0.49 0.07 2.86 3.30 0.22 42.60 3 April 2003 2.78 0.38 6.64 3.60 1.37 17.43 4 April 2003 0.83 0.11 2.65 1.40 0.16 23.30 6 April 2003 0.76 0.10 1.10 0.80 0.08 10.56 7 April 2003 1.67 0.23 2.21 1.20 0.27 9.66 8 April 2003 0.76 0.10 2.25 1.90 0.20 21.61 mean 1.11 0.15 2.35 1.85 0.29 17.61 median 0.88 0.12 2.06 1.75 0.24 17.12 Table 2. Continued.
Date GR 2 Cvap H2SO4 CS mean Q Perc. H2SO4
(nm h−1) (e8 cm−3) (e6 cm−3) (e-3 s−1) (e5 cm−3s−1) % Heidelberg 14 March 2004 2.67 0.37 3.88 4.08 1.49 10.61 15 March 2004 4.00 0.55 1.18 5.14 2.82 2.15 16 March 2004 1.33 0.18 4.78 7.14 1.30 26.23 18 March 2004 8.00 1.10 4.88 11.27 12.35 4.45 21 March 2004 11.76 1.61 1.59 1.64 2.64 0.99 22 March 2004 4.00 0.55 2.08 1.88 1.03 3.80 28 March 2004 4.76 0.65 4.47 9.68 6.31 6.85 30 March 2004 11.76 1.61 2.27 4.28 6.90 1.41 2 April 2004 16.67 2.28 3.43 11.63 26.56 1.50 3 April 2004 11.76 1.61 7.09 4.14 6.67 4.40 mean 7.67 1.05 3.57 6.09 6.81 6.24 median 6.38 0.87 3.66 4.71 4.56 4.10
smaller than 3 nm) than in later growth. In Heidelberg this behavior could not be seen so clearly, but both percentages were about the same (mean 4.3% for GR1 and 6.2% for GR2). Here again high concentrations of anthropogenic
con-densable trace gases could be responsible. They might partly substitute sulphuric acid in its important role specifically in aerosol formation and initial growth. Furthermore the per-centage contribution calculated from GR1 was almost the
2.0 1.6 1.2 0.8 0.4 0.0 UV_B W m -2 19.03. 21.03. 23.03. 25.03. Date 2003 -12 -8 -4 0 4 8 T emperature °C UV_B Temperature 2.0 1.6 1.2 0.8 0.4 0.0 UV_B W m -2 25.03. 27.03. 29.03. 31.03. Date 2003 -12 -8 -4 0 4 8 T emperature °C UV_B Temperature 2.0 1.6 1.2 0.8 0.4 0.0 UV_B W m -2 02.04. 04.04. 06.04. 08.04. Date 2003 -12 -8 -4 0 4 8 T emperature °C UV_B Temperature
Fig. 6. Hyyti¨al¨a: UV-B radiation and temperature versus time as overview on which days the weather conditions for production of sulphuric acid were favorable.
same at both measurement sites (5.9 and 4.3%), which means that sulphuric acid seems to contribute to particle growth in about the same percentage, independent from the two station locations. At Heidelberg the percentage contribution calcu-lated from GR2 was smaller than at Hyyti¨al¨a.
Subsequently the source rate Q was calculated from the condensable vapor concentration and the mean condensa-tion sink according to Eq. (5). Q depends only on these two parameters and consequently it was higher in Heidelberg than in Hyyti¨al¨a. Again the more polluted air in Heidelberg should be the reason for the higher source rates of sulphuric acid. Interestingly, the increased source and sink terms of H2SO4in Heidelberg air seem to balance so that
concentra-tions comparable to Hyyti¨al¨a are observed.
The next point analyzed was the correlation between sul-phuric acid and the smallest detectable particles between 3 and 6 nm (N3). As mentioned above we would expect a simi-lar shape of the two curves H2SO4versus time and N3 versus
time with a certain time lag due to the fact that sulphuric acid is the most important factor involved in new particle forma-tion. More precisely, if sulphuric acid was the only substance responsible for new particle formation, both curves should
80 60 40 20 0 Radiation W m -2 01.03. 03.03. 05.03. 07.03. 09.03. 11.03. Date 2004 20 10 0 T emperature °C Radiation Temperature 80 60 40 20 0 Radiation W m -2 12.03. 14.03. 16.03. 18.03. 20.03. 22.03. Date 2004 20 10 0 T emperature °C 80 60 40 20 0 Radiation W m -2 23.03. 25.03. 27.03. 29.03. 31.03. 02.04. 04.04. Date 2004 20 10 0 T emperature °C
Fig. 7. Heidelberg: Total solar radiation and temperature versus time.
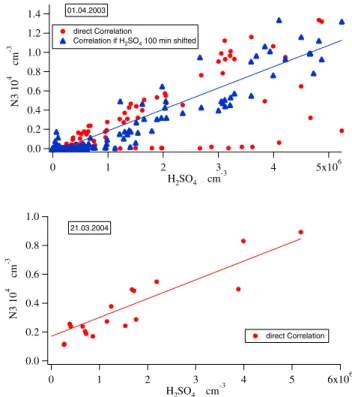
have exactly the same shape. Consequently, the correlation between those two curves indicates the relation between sul-phuric acid and newly formed aerosols. Figure 10 gives one example of these analyses for Hyyti¨al¨a and Heidelberg, re-spectively. In these graphs N3 is plotted versus H2SO4. On
many days a direct correlation was found as in the Heidel-berg example, on many other days the correlation required a certain timeshift as in the Hyyti¨al¨a example (this timeshift is the same as used in the timeshift analyses of the growth rates). There were also days where no correlation was found, especially in Heidelberg. In Table 1 the corresponding linear correlation coefficients can be found.
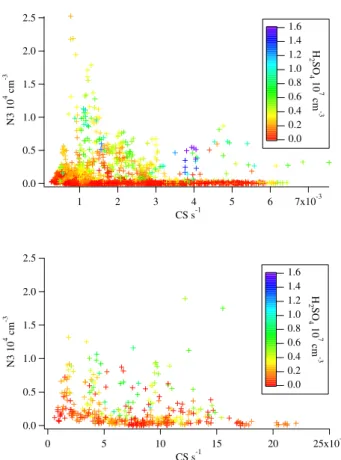
Figure 11 shows the particle number concentration be-tween 3 and 6 nm plotted versus the condensation sink at both measurement sites and the sulphuric acid concentration as color code. In Hyyti¨al¨a the concentration of small par-ticles is highest at low CS values and decreases steeply for high CS values. Or with high CS values at least high concen-trations of sulphuric acid are needed in order to get a signif-icant amount of new small particles. Yet at Heidelberg high N3 values occur even with high CS and low sulphuric acid values. This could be explained once more by local and tem-porarily high emission of particles and/or high amounts of
Hyytiälä 0,00 2,00 4,00 6,00 8,00 10,00 12,00 14,00 18.0 3.03 20.0 3.03 22.0 3.03 24.0 3.03 26.0 3.03 28.0 3.03 30.0 3.03 01.0 4.03 03.0 4.03 05.0 4.03 07.0 4.03 Date G row th r a te ( n m h -1) GR 1 [nm h-1] GR 2 [nm h-1]
Fig. 8. Hyyti¨al¨a: Comparison Growth Rate 1 (GR1), growth start-ing at 3 nm, and Growth Rate 2 (GR2), initial growth from 1 nm to 3 nm. The initial growth was usually slower than later growth (GR2<GR1). Heidelber g 0,00 5,00 10,00 15,00 20,00 25,00 14.0 3.04 16.0 3.04 18.0 3.04 20.0 3.04 22.0 3.04 24.0 3.04 26.0 3.04 28.0 3.04 30.0 3.04 01.0 4.04 03.0 4.04 Date G rowt h r a te (nm h -1) GR 1 [nm h-1] GR 2 [nm h-1]
Fig. 9. Heidelberg: Comparison Growth Rate 1 (GR1), growth starting at 3 nm, and Growth Rate 2 (GR2), initial growth from 1 nm to 3 nm.
condensable vapors by anthropogenic sources. During these periods sulphuric acid may contribute only partly to the con-centration of the N3 aerosols, which would explain the bad correlations.
Finally air mass trajectories on event days were investi-gated. The air mass direction on event days is also added to Table 1. For Hyyti¨al¨a data it has been already found out that on event days with less polluted air, originating from polar or Atlantic regions, CS is 2.64 times, sulphuric acid 1.46 times and growth rates are 1.45 times lower than on days with pol-luted air masses originating over industrial areas (Boy et al., 2005). Moreover events occur more likely on days with clean air masses. 1.4 1.2 1.0 0.8 0.6 0.4 0.2 0.0 N3 10 4 # cm -3 5x10⁶ 4 3 2 1 0 H2SO4 # cm-3 01.04.2003 direct Correlation
Correlation if H2SO4 100 min shifted
1.0 0.8 0.6 0.4 0.2 0.0 N3 10 4 # cm -3 6x10⁶ 5 4 3 2 1 0 H2SO4 # cm-3 21.03.2004 direct Correlation
Fig. 10. Examples for good correlations between sulphuric acid concentration (H2SO4)and particle number concentration between
3 and 6 nm (N3). First panel Hyyti¨al¨a: good correlation after a timeshift of 100 min, second panel Heidelberg.
Table 3. Comparison of Condensation Sink, Sulphuric acid con-centration and Growth Rate on polluted days in Heidelberg and Hyyti¨al¨a.
Hyyti¨al¨a Heidelberg CS (e-3 s−1) 2.90 6.09 H2SO4(e6 cm−3) 3.31 3.46
GR (nm h−1) 3.20 8.99
For Heidelberg it was practically impossible to get days with clear, non polluted air because of its central European location. Nevertheless, events were preferably found on days with air masses advected from South-West or West, originat-ing over the Mediterranean Sea or the Atlantic. No events oc-curred on days with air masses originating over the North Sea and Baltic Sea, which approach Heidelberg from the North and North-West. Those northern air masses passed the indus-trial areas around Mannheim/Ludwigshafen and are probably more polluted than the ones from South-West, which corre-sponds to the Hyyti¨al¨a result that events preferably occur on less polluted days.
Table 3 compiles mean values of condensation sink, sul-phuric acid concentration and growth rate on polluted days
1784 V. Fiedler et al.: The contribution of sulphuric acid to atmospheric particle formation and growth 2.5 2.0 1.5 1.0 0.5 0.0 N3 10 4 cm -3 7x10⁻³ 6 5 4 3 2 1 CS s-1 1.6 1.4 1.2 1.0 0.8 0.6 0.4 0.2 0.0 H 2SO 4 10 7 cm -3 2.5 2.0 1.5 1.0 0.5 0.0 N3 10 4 cm -3 25x10-3 20 15 10 5 0 CS s-1 1.6 1.4 1.2 1.0 0.8 0.6 0.4 0.2 0.0 H 2SO 4 10 7 cm -3
Fig. 11. Particle number concentration between 3 and 6 nm (N3) versus condensation sink (CS), sulphuric acid concentration as color code. First panel Hyyti¨al¨a: It can be seen that N3 is high either if
CS is low or with higher CS the H2SO4concentration needs to be
high. Second panel Heidelberg: High N3 values can be found even with high CS and low H2SO4.
Fig. 11. Particle number concentration between 3 and 6 nm (N3) versus condensation sink (CS), sulphuric acid concentration as color code. First panel Hyyti¨al¨a: It can be seen that N3 is high either if CS is low or with higher CS the H2SO4concentration needs to be
high. Second panel Heidelberg: High N3 values can be found even with high CS and low H2SO4.
in Finland and Germany. The mean values for Hyyti¨al¨a are taken from Boy et al. (2005). CS and GR1 are 2 to 3 times higher in Heidelberg compared to Hyyti¨al¨a; a fact which was pointed out already earlier and reflects the much higher an-thropogenic influence in Central Europe compared to North-ern Europe. Since the sulphuric acid concentrations are quite similar at both sites we come a third time to the conclusion that other vapors than H2SO4seem to play a very important
role in new particle formation.
5 Conclusions and perspectives
In this work measurements of atmospheric gaseous sulphuric acid and aerosol particles carried out in Hyyti¨al¨a, Finland, and Heidelberg, Germany, were compared.
First of all higher measured condensation sink and growth rate values were found in Heidelberg compared to Hyyti¨al¨a which reflects the higher degree of pollution in Germany. Nevertheless, the measured sulphuric acid concentrations were about the same at both measurement sites. This also
concerns the percentage contribution of sulphuric acid to new particle formation and growth at both sites (5.9 and 4.3%, re-spectively) in case of GR1 (a total growth rate for the whole event), which suggests that sulphuric acid contributes to par-ticle growth in about the same percentage at both station lo-cations.
GR2, calculated with the timeshift analysis, allowed to de-termine a growth rate specifically for the initial growth from 1 nm up to a size of 3 nm. The values were in average smaller than GR1 in Hyyti¨al¨a, which was already earlier pointed out by Kulmala (Kulmala et al., 2004a), so the growth seems to be initially slower compared to later. Moreover, the percent-age contribution of sulphuric acid to particle growth was for Hyyti¨al¨a higher in the beginning (17.6% for GR2 and 5.9% for GR1), which means that sulphuric acid seems to play a bigger role in the first two nanometers of growth from 1 nm up to 3 nm in diameter than in later growth. In Heidelberg both growth rates and the percentages calculated from them were about the same. The stronger initial growth and the lower sulphuric acid contribution in Heidelberg compared to Hyyti¨al¨a may both be explained by the influence of other condensable trace gases, here especially compounds with low saturation vapor pressure and anthropogenic origin, that might substitute sulphuric acid in its important role in new particle formation and especially initial growth or simply by the fact that the timeshift analysis gives inadequate results if the correlation between H2SO4 and N3 is not very
pro-nounced. A correlation analysis between sulphuric acid and the particles between 3 and 6 nm gave exactly this result, i.e. the correlation in Hyyti¨al¨a was quite clear in contrast to Hei-delberg. Generally the results in Heidelberg were less clear; most probable temporarily and locally high amounts of other condensable trace gases from anthropogenic sources mask the influence of sulphuric acid.
In future experiments it would be desirable to identify the nature of those other substances. In recent years already condensable organic trace gases (VOC) have been taken into account for this role, but the analysis of such organics is quite difficult because of the wide range of different substances, often different substances with the same molecular mass. Therefore further analyses are needed.
Edited by: A. Laaksonen
References
Aalto, P., H¨ameri, K., Becker, E., Weber, R., Salm, J., M¨akel¨a, J. M., Hoell, C., O’Dowd, C. D., Karlsson, H., Hansson, H.-C., V¨akev¨a, M., Koponen, I. K., Buzorius, G., and Kulmala, M.: Physical characterization of aerosol particles during nucleation events, Tellus, 53 B, 344–358, 2001.
Arnold, F.: Ion nucleation – a potential source for stratospheric aerosols, Nature, 299, 134–137, 1982.
Birmili, W., Stratmann, F., and Wiedensohler, A.: Design of a DMA-based size spectrometer for a large particle size range and stable operation, J. Aer. Sci., 30, 549–553, 1999.
Birmili, W., Berresheim, H., Plass-D¨ulmer, C., Elste, T., Gilge, S., Wiedensohler, A., and Uhrner, U.: The Hohenpeissenberg aerosol formation experiment (HAFEX): A long-term study in-cluding size-resolved aerosol, H2SO4, OH, and monoterpenes
measurements, Atmos. Chem. Phys., 3, 361–376, 2003, SRef-ID: 1680-7324/acp/2003-3-361.
Boy, M. and Kulmala, M.: Nucleation events in the continental boundary layer: Influence of physical and meteorological param-eters, Atmos. Chem. Phys., 2, 1–16, 2002,
SRef-ID: 1680-7324/acp/2002-2-1.
Boy, M., Rannik, ¨U., Lehtinen, K. E. J., Tarvainen, V., Hakola, H., and Kulmala, M.: Nucleation events in the continental PBL – long term statistical analyses of aerosol relevant characteristics, J. Geophys. Res., 108 (D21), 4667–4680, 2003.
Boy, M., Kulmala, M., Ruuskanen, T. M., Pihlatie, M., Reissell, A., Aalto, P. P., Keronen, P., Hellen, H., Hakola, H., Jansson, R., Hanke, M., and Arnold, F.: Sulphuric acid closure and contribu-tion to nucleacontribu-tion mode particle growth, Atmos. Chem. Phys., 5, 863–878, 2005,
SRef-ID: 1680-7324/acp/2005-5-863.
Fuchs, N. A. and Sutugin, A. G.: Highly dispersed aerosol, in: Top-ics in current aerosol research, edited by: Hidy, G. M. and Brock, J. R., Pergamon, New York, 1971.
Garrett, T. J., Radke, L. F., and Hobbs, P. V.: Aerosol Effects on Cloud Emissivity and Surface Longwave Heating in the Arctic, J. Atmos. Sci., 59, 769–778, 2002.
Hanke, M., Uecker, J., Reiner, T., and Arnold, F.: Atmospheric peroxy radicals: ROXMAS, a new mass-spectrometric method-ology for speciated measurements of HO2 and Sigma RO2 and first results, International Journal of Mass Spectrometry, 213(2– 3), 91–99, 2002.
Harshvardhan, Schwarz, S. E., Benkovitz, C. M., and Guo, G.: Aerosol Influence on Cloud Microphysics Examined by Satel-lite Measurements and Chemical Transport Modelling, J. Atmos. Sci., 59, 714–725, 2002.
Harrison, R. M., Grenfell, J. L., Savage, N., Allen, A., Clemitshaw, K. C., Penkett, S., Hewitt, C. N., and Davison, B.: Observations of new particle production in the atmosphere of a moderately polluted site in eastern England, J. Geophys. Res., D105, 17 819– 17 832, 2000.
Kerminen, V.-M., Pirjola, L. and Kulmala, M.: How significantly does coagulational scavenging limit atmospheric particle produc-tion, J. Geophys. Res., 106, 24 119–24 125, 2001.
Kim, C. S. and Jaques, P. A.: Respiratory dose of inhaled ultrafine particles in healthy adults, Phil. Trans. R. Soc. Lond. A., 358, 2693–2705, 2000.
Korhonen, P., Kulmala, M., Laaksonen, A., Viisanen, Y., McGraw, R., and Seinfeld, J. H.: Ternary nucleation of H2SO4, NH3and
H2O in the atmosphere, J. Geophys. Res., 104, 26 349–26 353,
1999.
Kulmala, M.: Nucleation as an aerosol physical problem, PhD the-sis, University of Helsinki, 1988.
Kulmala, M., Toivonen, A., M¨akel¨a, J. M. and Laaksonen, A.: Analysis of the growth of nucleation mode particles observed in Boreal forest, Tellus B, 50, 449–462, 1998.
Kulmala, M., Dal Maso, M., M¨akel¨a, J. M., Pirjola, L., V¨akev¨a, M., Aalto, P., Miikkulainen, P., H¨ameri, K., and O’Dowd, C.: On the formation, growth and composition of nucleation mode particles, Tellus B, 53, 479–490, 2001.
Kulmala, M.: How particles nucleate and grow, Science, 307 (5647), 1000–1001, 2003.
Kulmala, M., Laakso, L., Lehtinen, K. E. J., Riipinen, I., Dal Maso, M., Anttila, T., Kerminen, V.-M., H˜orrak, U., Vana, M., and Tam-met, H.: Initial Steps of Aerosol Growth, Atmos. Chem. Phys., 4, 2553–2560, 2004a,
SRef-ID: 1680-7324/acp/2004-4-2553.
Kulmala, M., Vehkam¨aki, H., Pet¨aj¨a, T., Dal Maso, M., Lauri, A., Kerminen, V.-M., Birmili, W., and McMurry, P. H.: Formation and growth rates of ultrafine atmospheric particles: A review of observations, J. Aerosol Sci., 35, 2, 143–176, 2004b.
M¨akel¨a, J. M., Dal Maso, M., Laaksonen, A., Kulmala, M., Pirjola, L., Keronen, P., and Laakso, L.: Characteristics of the aerosol particle formation events observed at a boreal forest site in south-ern Finland, Boreal Environment Research, 5, 299–313, 2000. Menon, S. and Saxena, V. K.: Role of sulfates in regional
cloud-climate interactions, Atmos. Res., 47–48, 299–315, 1998. Ramanathan, V., Crutzen, P. J., Kiehl, J. T., and Rosenfeld, D.:
Aerosol, climate, and the hydrological cycle, Science, 294, 2119–2124, 2001.
Reiner, T. and Arnold, F.: Laboratory flow reactor measurements of the reaction SO3+ H2O + M → H2SO4+ M: Implications for gaseous H2SO4and aerosol formation in the plume of a jet
aircraft, Geophys. Res. Lett., 20, 2659–2662, 1993.
Reiner, T. and Arnold, F.: Laboratory investigations of gaseous sul-phuric acid formation via SO3 + H2O + M → H2SO4 + M:
Measurements of the rate constant and product identification, J. Chem. Phys., 101, 7399–7407, 1994.
Stieb, D. M., Judek, S., and Burnett, R. T.: Meta-analysis of time-series studies of air pollution and mortality: Effects of gases and particles and their influence of cause of death, age and season, J. Air & Manage. Assoc., 52, 470–484, 2002.
Weber, R. J., Marti, J. J., McMurry, P. H., Eisele, F. L., Tanner, D. J., and Jefferson, A.: Measurements of new particle formation and ultrafine particle growth rates at a clean continental site, J. Geophys. Res., D102, 4375–4385, 1997.
Weber, R. J., McMurry, P. H., Mauldin, L., Tanner, D., Eisele, F., Clarke, A. D., and Kapustin, V. N.: New Particle Formation in the Remote Troposphere: A Comparison of Observation at Vari-ous Sites, Geophys. Res. Lett., 26, 307–310, 1999.
Wichmann, H.-H. and Peters, A.: Epidemiological evidence of the effects of ultrafine particle exposure, Phil. Trans. R. Soc. Lond. A., 358, 2751–2769, 2000.
Yue, G. and Chan, L.: Theory of formation of aerosols of volatile binary solutions through the ion-induced nucleation process, J. Colloid Interface Sci., 68, 501–507, 1979.