HAL Id: hal-02457775
https://hal-amu.archives-ouvertes.fr/hal-02457775
Submitted on 28 Jan 2020
HAL is a multi-disciplinary open access
archive for the deposit and dissemination of
sci-entific research documents, whether they are
pub-lished or not. The documents may come from
teaching and research institutions in France or
abroad, or from public or private research centers.
L’archive ouverte pluridisciplinaire HAL, est
destinée au dépôt et à la diffusion de documents
scientifiques de niveau recherche, publiés ou non,
émanant des établissements d’enseignement et de
recherche français ou étrangers, des laboratoires
publics ou privés.
Distributed under a Creative Commons Attribution| 4.0 International License
Explained by Somatodendritic Excitability in Rat
Substantia Nigra Dopaminergic Neurons
Estelle Moubarak, Dominique Engel, Martial Dufour, Mónica Tapia, Fabien
Tell, Jean-Marc Goaillard
To cite this version:
Estelle Moubarak, Dominique Engel, Martial Dufour, Mónica Tapia, Fabien Tell, et al..
Robust-ness to Axon Initial Segment Variation Is Explained by Somatodendritic Excitability in Rat
Sub-stantia Nigra Dopaminergic Neurons.
Journal of Neuroscience, Society for Neuroscience, 2019,
�10.1523/JNEUROSCI.2781-18.2019�. �hal-02457775�
Cellular/Molecular
Robustness to Axon Initial Segment Variation Is Explained
by Somatodendritic Excitability in Rat Substantia Nigra
Dopaminergic Neurons
X
Estelle Moubarak,
1X
Dominique Engel,
2Martial A. Dufour,
1X
Mo´nica Tapia,
1X
Fabien Tell,
1*
and
X
Jean-Marc Goaillard
1*
1Unite´ Mixte de Recherche_S 1072, Aix Marseille Universite´, Institut National de la Sante´ et de la Recherche Me´dicale, Faculte´ de Me´decine Secteur Nord, 13015 Marseille, France, and2Laboratory of Neurophysiology, GIGA-Neurosciences, Universite´ de Lie`ge, 4000 Lie`ge 1, Belgium
In many neuronal types, axon initial segment (AIS) geometry critically influences neuronal excitability. Interestingly, the axon of rat SNc
dopaminergic (DA) neurons displays a highly variable location and most often arises from an axon-bearing dendrite (ABD). We
com-bined current-clamp somatic and dendritic recordings, outside-out recordings of dendritic sodium and potassium currents,
morpho-logical reconstructions and multicompartment modeling on male and female rat SNc DA neurons to determine cell-to-cell variations in
AIS and ABD geometry, and their influence on neuronal output (spontaneous pacemaking frequency, action potential [AP] shape). Both
AIS and ABD geometries were found to be highly variable from neuron to neuron. Surprisingly, we found that AP shape and pacemaking
frequency were independent of AIS geometry. Modeling realistic morphological and biophysical variations helped us clarify this result: in
SNc DA neurons, the complexity of the ABD combined with its excitability predominantly define pacemaking frequency and AP shape,
such that large variations in AIS geometry negligibly affect neuronal output and are tolerated.
Key words: action potential; axon initial segment; modeling; robustness; sodium channels; variability
Introduction
In mammalian neurons, it is currently accepted that the action
potential (AP) is initiated in the axon initial segment (AIS), a
subcellular compartment comprising a particularly high density
of voltage-gated sodium channels (
Coombs et al., 1957
;
Kole et
al., 2008
;
Debanne et al., 2011
;
Kole and Stuart, 2012
), due to the
presence of the AIS-specific anchoring protein ankyrinG (
Ras-band, 2010
). Some neurons even express different subtypes of
sodium channels in the proximal and distal parts of the AIS
(Nav1.1/Nav1.2 and Nav1.6, respectively) (
Van Wart et al., 2007
;
Lorincz and Nusser, 2008
;
Hu et al., 2009
), and experimental and
theoretical studies demonstrated that the AP can be initiated
spe-cifically in the distal (
Palmer and Stuart, 2006
;
Kole et al., 2008
;
Hu et al., 2009
) or the proximal part of the AIS (
Meeks and
Mennerick, 2007
). Consistent with the specific localization of the
channels responsible for AP initiation, it has been demonstrated
that changes in AIS geometry (length or distance from soma) can
modulate neuronal excitability, firing frequency or AP properties
in several neuronal types (
Kuba et al., 2006
,
2014
;
Grubb and
Burrone, 2010
;
Wefelmeyer et al., 2015
;
Lezmy et al., 2017
).
Received Oct. 29, 2018; revised March 27, 2019; accepted March 27, 2019.
Author contributions: E.M., D.E., M.A.D., M.T., and F.T. performed research; E.M., D.E., M.A.D., M.T., F.T., and J.-M.G. analyzed data; E.M., D.E., F.T., and J.-M.G. wrote the paper; F.T. and J.-M.G. designed research.
This work was supported by the French Ministry of Research doctoral fellowship to E.M., French National Research Agency ANR JCJC Grant ROBUSTEX to J.-M.G., Fondation France Parkinson doctoral fellowship to M.A.D., European Research Council (Consolidator Grant 616827 CanaloHmics to J.-M.G., supporting M.T.), and the Belgian FRS-FNRS U.N002.13 and T.N0015.13 to D.E. We thank Dr. Michael Seagar for helpful comments on the manuscript; Dr. Vincent Seutin for helpful discussions on the subject; and the GIGA-Imaging (Lie`ge) and the CMI imaging (Marseille) facilities for help with the acquisition of confocal images.
The authors declare no competing financial interests. *F.T. and J.-M.G. contributed equally to this work.
Correspondence should be addressed to Jean-Marc Goaillard at jean-marc.goaillard@univ-amu.fr. https://doi.org/10.1523/JNEUROSCI.2781-18.2019
Copyright © 2019 the authors
Significance Statement
In many neuronal types, axon initial segment (AIS) geometry critically influences neuronal excitability. In the current study, we
describe large cell-to-cell variations in AIS length or distance from the soma in rat substantia nigra pars compacta dopaminergic
neurons. Using neuronal reconstruction and electrophysiological recordings, we show that this morphological variability does not
seem to affect their electrophysiological output, as neither action potential properties nor pacemaking frequency is correlated
with AIS morphology. Realistic multicompartment modeling suggests that this robustness to AIS variation is mainly explained by
the complexity and excitability of the somatodendritic compartment.
However, these links between AIS geometry and neuronal
ex-citability have been determined on neuronal types that are driven
by dense temporally and spatially ordered synaptic inputs. The
question arises then whether the constraints on AIS geometry are
similar in spontaneously active neuronal types, where the main
driving force for activity comes from the intrinsic conductances
expressed by the neuron, and not from synaptic inputs. The
mid-brain dopaminergic (DA) neurons of the SNc are spontaneously
active in the absence of synaptic inputs (
Grace and Onn, 1989
),
generating a regular tonic (also known as pacemaker) activity
relying on many distinct voltage- and calcium-gated ion channels
(
Liss and Roeper, 2008
;
Gantz et al., 2018
). These neurons are also
known to project a long and highly ramified axon to the dorsal
striatum where they release dopamine (
Prensa and Parent, 2001
;
Matsuda et al., 2009
). Interestingly, while in most mammalian
neurons the axon emerges from the soma (
Kole and Brette,
2018
), the axon of DA neurons often arises from a primary or
secondary dendrite, at distances from the soma as large as 200
m
in the adult rat (
Grace and Bunney, 1983
;
Ha¨usser et al., 1995
;
Gentet and Williams, 2007
;
Blythe et al., 2009
;
Meza et al., 2018
).
Despite these surprisingly large cell-to-cell variations in axon
lo-cation (and thus potentially of the AIS), only one recent study
performed in mouse SNc neurons was dedicated to studying the
link between AIS geometry and excitability in these cells (
Meza et
al., 2018
).
We investigated the link between AIS geometry and
excitabil-ity (spontaneous firing and AP shape) using a combination of
current-clamp and voltage-clamp electrophysiological
record-ings, morphological reconstructions, and computational
model-ing on rat SNc DA neurons. In contrast with the previously cited
studies (
Kuba et al., 2006
;
Grubb and Burrone, 2010
;
Meza et al.,
2018
), cell-to-cell variations in AIS geometry did not seem to
significantly influence the excitability of DA neurons, as neither
the level of spontaneous firing nor AP properties showed
corre-lations with AIS length or soma-AIS distance. Dendritic
voltage-clamp recordings confirmed the presence of a significant density
of sodium channels in the dendrites, and neuronal
reconstruc-tions revealed an unexpected morphological complexity of the
axon-bearing dendrite. Multicompartment computational
mod-eling then suggested that the presence of somatodendritic sodium
channels associated with the morphological complexity of the
dendritic compartment is sufficient to explain the lack of
depen-dence between AIS geometry and excitability in these neurons.
Our results suggest that the peculiar morphological and
biophys-ical profile of the dendritic arborization in these neurons
mini-mizes the influence of the AIS on excitability, such that its precise
geometry ceases to represent a significant constraint for this cell
type.
Materials and Methods
Acute midbrain slice preparation. Acute slices were prepared from
P16-P22 (mean⫽ 19, n ⫽ 141) Wistar rats of either sex. All experiments were performed according to the European (Council Directive 86/609/EEC) and institutional guidelines for the care and use of laboratory animals (French National Research Council; protocol 1210, Commission d’Ethique Animale, University of Lie`ge; Comite´ de´ontologique, Bel-gium). Rats were anesthetized with isoflurane (CSP) in an oxygenated chamber (TEM SEGA) and decapitated. The brain was immersed briefly in oxygenated ice-cold low-calcium aCSF containing the following (in mM): 125 NaCl, 25 NaHCO3, 2.5 KCl, 1.25 NaH2PO4, 0.5 CaCl2, 4 MgCl2, 25D-glucose; or 87 NaCl, 25 NaHCO3, 2.5 KCl, 1.25 NaH2PO4, 0.5 CaCl2, 7 MgCl2, 10D-glucose, 75 sucrose; pH 7.4, oxygenated with 95% O2/5% CO2gas. The cortices were removed and then coronal mid-brain slices (250 or 300m) were cut on a vibratome (VT 1200 or 1200S,
Leica Microsystems) in oxygenated ice-cold low-calcium aCSF. Follow-ing 20 –30 min incubation in 32°C oxygenated low calcium aCSF, the slices were incubated for at least 30 min in oxygenated aCSF (125 NaCl, 25 NaHCO3, 2.5 KCl, 1.25 NaH2PO4, 2 CaCl2, 2 MgCl2, and 25 glucose, pH 7.4, oxygenated with 95% O25% CO2gas) at room temperature before electrophysiological recordings.
Drugs. For current-clamp recordings, picrotoxin (100M, Sigma-Aldrich) and kynurenate (2 mM, Sigma-Aldrich) were bath-applied via continuous perfusion in aCSF to block inhibitory and excitatory synaptic activity, respectively. TTX citrate (1M, Tocris Bioscience or Abcam) was bath-applied to verify the TTX sensitivity of voltage-gated sodium currents and to isolate potassium currents. In addition, cadmium chlo-ride (200M, Sigma-Aldrich) was bath applied to block voltage-gated calcium channels during potassium current recordings.
Electrophysiology recordings and analysis. All recordings (141 cells from
64 rats) were performed on midbrain slices continuously superfused with oxygenated aCSF. Picrotoxin and kynurenate were systematically present for all recordings to prevent contamination of the intrinsic activity by spontaneous glutamatergic and GABAergic synaptic activity. Patch pi-pettes (1.8 – 4 mOhm for somatic recordings, 5–13 mOhm for dendritic or outside-out recordings) were pulled from borosilicate glass (GC150TF-10, Harvard Apparatus) on a DMZ Universal Puller (Zeitz Instruments) or a P-97 horizontal puller (Sutter Instruments). For most recordings, patch solutions contained the following (in mM): 20 KCl, 10 HEPES, 10 EGTA, 2 MgCl2, 2 Na-ATP, and 120 K-gluconate, pH 7.4, 290 –300 mOsm. A different solution composed of the following (in mM): 120 Cs gluconate, 20 CsCl, 2 MgCl2, 2 Na2ATP, 10 HEPES, and 10 EGTA, pH 7.3,⬃300 mOsm was used to record Na⫹currents in outside-out patches. Neurobiotin (0.05%; Vector Labs) or biocytin (0.1%– 0.2%, Invitrogen) was included in the intracellular solution to allow morpho-logical reconstruction and identification of dopaminergic neurons using
post hoc TH immunolabeling (Amendola et al., 2012). Whole-cell record-ings were made from SNc dopaminergic neurons visualized using infra-red differential interference contrast videomicroscopy (QImaging Retiga camera; Olympus BX51WI microscope or Newvicon tube in NC-70 Dage-MTI, Carl Zeiss FS microscope) and identified as previously de-scribed (Amendola et al., 2012), subsequently dendrites were visualized with a 2⫻-4⫻ changer (Dodt, Luigs Neumann). Whole-cell current-clamp recordings with a series resistance⬍10 mOhm (soma) or ⬍25 mOhm (dendrites) were included in the study. Capacitive currents and liquid junction potential (13.2 mV) were compensated online, and offset potentials were measured after removing the pipette from the neuron. Bridge balance (100%, 10s) was used in current-clamp to compensate series resistance. For voltage-clamp recordings, a series resistance com-pensation of 60% (10s) was used. Recordings with offset values ⬎1 mV were discarded from the analysis. Recordings were acquired at 50 kHz and were filtered with a low-pass filter (Bessel characteristic between 2.9 and 5 kHz cutoff frequency).
The interspike interval (ISI) and ISI coefficient of variation (CVISI) were calculated from a minimum of 40 s of stable current-clamp record-ing (with no injected current) within the first 5 min of obtainrecord-ing the whole-cell configuration. APs generated during this period of spontane-ous activity were then averaged and the AP threshold, AP amplitude, and the duration of the AP at half of the maximal height of the AP (AP half-width) were measured. AP threshold was measured on the d2v/dt2 versus V phase plane plot. To record voltage-gated Na⫹ current in outside-out patches, a pulse sequence comprised of a 100 ms prepulse to ⫺120 mV, and a 30 ms test pulse to 0 mV was generated. The holding potential before and after the pulse sequence was⫺90 mV. For the re-cordings of voltage-gated K⫹current in outside-out patches, a pulse sequence comprised of a 150 ms prepulse to⫺40 mV followed by a 100 ms test pulse at 40 mV was applied. The potential was briefly brought to ⫺40 mV for 10 ms before returning to the holding potential of ⫺80 mV. For all out recordings, voltage protocols were applied to outside-out patches once every 10 s. Leak and capacitive currents were subtracted online using a P over⫺4 or P over ⫺8 correction procedure. Current recordings are averages of 2–100 sweeps. The patch area was estimated using the following equation: a⫽ 12.6 (1/Rp⫹ 0.018), where a is the area (m2) and R
1995). Outside-out recordings were obtained from 29 neurons for so-dium currents and 25 neurons for potassium currents. For soso-dium cur-rents, multiple outside-out recordings (one somatic, one dendritic) were obtained from 2 neurons. After the outside-out recordings, a somatic whole-cell patch-clamp recording was performed to inject the neurobio-tin necessary for post hoc reconstruction, which could be achieved in 20 neurons (22 outside-out recordings) and 14 neurons (14 outside-out recordings) for sodium and potassium currents, respectively. The range, average, and SD of sodium and potassium conductance values were cal-culated from the whole sample of recordings (n⫽ 29; n ⫽ 25), while only the measurements with post hoc reconstruction (n⫽ 22; n ⫽ 14) were used to analyze the somatodendritic distribution of conductance values.
Electrophysiology data acquisition and analysis. Data were acquired
with an EPC 10/USB patch-clamp amplifier (HEKA Elektronik) and patchmaster software (HEKA Elektronik) or an Axopatch 200B amplifi-ers (Molecular Devices) connected to a PC via a Digidata 1440A interface (Molecular Devices) and pClamp 10.4 software (Molecular Devices). Analysis was conducted using FitMaster version 2x30 (HEKA Elek-tronik), Mathematica 9 (Wolfram Research), Stimfit 0.13 (Christoph Schmidt-Hieber, Institut Pasteur, Paris), Excel (Microsoft), and Anacon-da/Spyder (Python 3.4).
Immunohistochemistry and morphological reconstruction. Acute
slices containing Neurobiotin or biocytin tracer-filled cells were fixed 30 min in 4% PFA at 4°C and immunolabeled with anti-TH (chicken polyclonal, Abcam, 1:1000), anti-AnkyrinG (mouse monoclonal IgG2b, NeuroMab, 1:250 or mouse monoclonal, Invitrogen, 1:100), goat anti-mouse IgG2b AlexaFluor-488 (Invitrogen; 1:1000 2g/ml), and goat anti-chicken AlexaFluor-633 (Invitrogen; 1:3000; 1.66 ng/ ml) or donkey anti-mouse AlexaFluor-647 (Invitrogen; 1:250). Streptavidin AlexaFluor-594 (Invitrogen; 1:12,000; 1.66 ng/ml) or Fluorescein Avidin DCS (Lab Consult; 1l/ml) were used to reveal neurobiotin and biocytin labeling, respectively. Slices were mounted in ProLong Antifade (Invitrogen) or Faramount mounting medium (Dako). Immunolabeling was viewed on an LSM 780 (Carl Zeiss) or an FV1000 (Olympus) confocal microscope, and images were captured us-ing ZEN software (Carl Zeiss). Images were analyzed with Fiji/ImageJ software (Schindelin et al., 2012;Schneider et al., 2012;Rueden et al., 2017) and in particular neurons were reconstructed using the Simple Neurite Tracer plugin (Longair et al., 2011). Dendrite lengths were ex-tracted directly from the paths traced through the stack images of the neurons. Soma volumes were estimated by using the “fill out path” method on Simple Neurite Tracer. For the diameters of the primary dendrites, auxiliary dendrites (aDs), axon, and AIS, the fluorescence his-tograms of branch sections were obtained and fitted with a Gaussian curve model. Diameters were then estimated as 3⫻ SD of the Gaussian distribution.
Multicompartment modeling. Simulations were performed using
NEURON 7.5 software (Carnevale and Hines, 2006). Neuronal
mop-hologies included a simplified dopaminergic neuron based on average measurements and the realistic morphologies from the 37 fully recon-structed dopaminergic neurons. The simplified model consists of a cy-lindrical soma (20⫻ 20) attached to three non–axon-bearing (nABD) tapering dendrites (500m long, tapering from 3 to 0.5 m), an axon-bearing dendrite (ABD) dendrite (x⫻ y), three aDs (500m long, ta-pering from 2 to 0.5m) and an axon subdivided into three compartments (axonstart, AIS, axon). Details of the morphology of the average model are provided inFigure 7.
For each compartment, membrane voltage was obtained as the time integral of a first-order differential equation as follows:
dV dt ⫽ ⫺
1
Cm⫻
冘
关 gi⫻共V ⫺ Erev兲兴 ⫺ Iaxialwhere V is the membrane potential, Cmthe membrane capacitance, giare ionic conductances, and Erevtheir respective reversal potentials. The axial flow of current (I axial) between adjacent compartments is calculated by the NEURON simulation package (Hines and Carnevale, 1997). Cyto-plasmic resistivity, specific membrane capacitance, and specific mem-brane resistance were set to 150 Ohm䡠cm, 0.75F/cm2, and 100,000 Ohm⫻ cm2, respectively, with the reversal potential for the leak con-ductance set at ⫺50 mV. Active conductances followed activation-inactivation Hodgkin-Huxley kinetics (Table 1).
Parameters for IA, ICaL, IKCa, and IHwere based on previous published values for SNc DA neurons (Wilson and Callaway, 2000;Amendola et al., 2012;Engel and Seutin, 2015). Fast sodium and potassium currents were derived from Migliore and Schild models, respectively (Schild et al., 1993;Migliore et al., 2008). The SK current is solely activated by an increase in calcium concentration. Therefore, intracellular calcium up-take was modeled as a simple decaying model according toDestexhe et al. (1993). Conductance values were set according to our own measure-ments or published values (Table 1). Consistent with the literature (Zhou et al., 1998;Kole et al., 2008;Hu et al., 2009;Gonza´lez-Cabrera et al., 2017), gNaand gKDRdensities are higher in the AIS than in the rest of the neuron so that AP always initiates in the AIS. According toGentet and Williams (2007), IAdensity and inactivation kinetics were higher and depolarized, respectively, in the soma compared with the dendritic arbor. Initializing potential was set at⫺70 mV, and analysis was performed after pacemaking frequency reached a steady state (8 spikes). Each simulation run had a 6000 ms duration with a dt of 0.01 ms. Spatial discretization followed the “d_lambda rule” (Hines and Carnevale, 2001) and adjusted within and between runs when com-partment lengths were altered. All dendritic comcom-partments and the axon-start compartment contained all currents, whereas AIS and axon only contained fast sodium and potassium currents (gNa, gKDR). Unless otherwise stated, all currents but the fast sodium and potas-Table 1. Equations governing the voltage dependence and kinetics of currents in the model
Current general equations (except for ISK):I共V,t兲 ⫽ gmax⫻ ma共V,t兲 ⫻ hb共V,t兲 ⫻ 共V ⫺ Erev兲
m⬁共V兲 ⫽ 1
冉
1⫹ exp冋冉
⫺共V ⫺ Vm兲 km冊册冊
h⬁共V兲 ⫽ 1冉
1⫹ exp冋冉
⫺共V ⫺ Vh兲 kh冊册冊
dt⫽ 10s dm共V,t兲/dt ⫽关m⬁共V兲 ⫺ m共V,t兲兴 m dh共V,t兲/dt ⫽关h⬁共V兲 ⫺ h共V,t兲兴 h Current Vm(mV) km(mV) a Vh(mV) kh(mV) b Erev(mV)Specific equations (mand
hare expressed in ms)
gmax(pS/m2)
Soma ABD nABD aD Ax-st AIS Axon
INa ⫺28 8 3 ⫺50 ⫺10 1 60 m⫽ 0.01 ⫹共0.33/共1 ⫹ 共共V ⫹ 20兲/30兲2兲兲 h⫽ 0.7 ⫹共16/共1 ⫹ 共共V ⫹ 50兲/8兲2兲兲 25–200 25–200 25–200 25–200 25–200 1000 – 8000 400 IKDR ⫺30 9 4 — — 0 ⫺90 m⫽共4 ⫻ exp(⫺ (0.000729) ⫻ ((V ⫹ 32)2)))⫹ 4 50 – 400 50 – 400 50 – 400 50 – 400 50 – 400 1000 – 8000 400 IA(soma) ⫺30 7 1 ⫺75 ⫺7 1 ⫺90 m⫽ 1.029 ⫹共4.83/共1 ⫹ exp((V ⫹ 57)/6.22))) 150 0 0 0 0 0 0 IA(dendrite) ⫺30 7 1 ⫺85 ⫺7 1 ⫺90 h⫽ 25 ⫹共120 ⫹ 共78.4/共1 ⫹ exp(V ⫹ 68.5)/ 5.95))⫺ 25)/(1 ⫹ exp((⫺V ⫹ 90) ⫻ 5)) 0 100 100 100 100 0 0 IH ⫺92 ⫺7,25 1 — — 0 ⫺40 m⫽ 556 ⫹ 1100 ⫻ exp(⫺ 0.5 ⫻ ((V)/11.06)2) 3 3 3 3 3 0 0 ICaL ⫺31 7 1 — — 0 120 m⫽ 1/共共 ⫺ 0.209 ⫻ 共V ⫹ 39.26兲/共exp(⫺ (V ⫹ 39.26)/4.111) ⫺ 1) ⫹ (0.944 ⫻ exp(⫺(V ⫹ 15.38)/224.1)))) 1 1 1 1 1 0 0
ISK — — — — — — ⫺90 I共V,Cai兲 ⫽ gmax⫻ O⬁共Cai兲 ⫻ 共V ⫺ Erev兲 0.1 0.1 0.1 0.1 0.1 0 0 Calcium buffering and pump (Desthexe et al., 1993) O⬁共V兲 ⫽ 共Cai兲4/共共Cai兲4⫹共0.00019兲4兲
sium currents had fixed and homogeneous conductance values in the dendrites and the axon-start compartment.
For the realistic morphology models, exact dendrite lengths, soma volume, and diameters of primary dendrites, aDs, axon, and AIS were used (for details, see Immunohistochemistry and morphological recon-struction). The specific branching patterns of each neuron (topology) were also respected. To be consistent with the NEURON software con-straints, soma volume was implemented by computing the equivalent cylinder corresponding to the volume measured using “fill out path” method on Simple Neurite Tracer. Axonal diameter was considered con-stant and set to 0.7m, whereas the diameters of nonprimary dendrites were approximated by a regular tapering to reach a final diameter of 0.5m.
Firing frequency and AP analysis (amplitude, first and second deriva-tive of APs) were computed online by handmade routines directly writ-ten in NEURON hoc language (Hines and Carnevale, 2001).
All computing files are available at model DB database under #245427.
Experimental design and statistical analysis. Statistical analysis
(per-formed according to data distribution) included the following: linear regression, unpaired t test, Mann–Whitney, paired t test, and one-way ANOVA, with a p value⬍0.05 being considered statistically significant. Distribution of data was first tested for normality with the Shapiro–Wilk test. Then, the difference between means of two samples was accordingly computed using t tests or Wilcoxon signed rank tests. For comparison between three groups, we used a one-way parametric ANOVA followed by post hoc t tests with Bonferroni correction for multiple comparisons. Linear regressions were obtained with the Pearson test. Data inFigure 12
were fitted using an exponential decay function of equation f⫽ y0⫹ a ⫻ exp(⫺b ⫻ x). Unless otherwise stated, statistical data are given as mean ⫾ SD and n indicates the number of recorded neurons. Statistical tests were computed by using Sigmaplot 11.0 software (Systat Software) and Prism 6 (GraphPad Software).
Figure preparation. Figures were prepared using Sigma Plot, Prism 6,
Adobe Photoshop, and Adobe Illustrator (CS5-CS6, Adobe Systems), Corel Draw X6 (Corel), and ImageJ (J. Schindelin et al., 2012;C. A. Schindelin et al., 2012;Rueden et al., 2017), with brightness and contrast adjustments performed consistently across the images to enhance clarity.
Results
To investigate the link between morphology and
electrophysio-logical properties in SNc DA neurons, we performed
patch-clamp recordings combined with post hoc reconstructions of
neuronal morphology based on neurobiotin fills of the recorded
neurons (n
⫽ 40). Recordings were obtained from coronal
mid-brain slices in the presence of synaptic blockers (picrotoxin and
kynurenate) to isolate intrinsically generated activity. Recordings
and reconstructions were performed on P19-P21 rats (mean
age
⫽ P20), as both electrophysiological properties and
morpho-logical features have been described to reach a mature stage by the
end of the second postnatal week (
Tepper et al., 1994
;
Dufour et
al., 2014
). Although the axon of SNc DA neurons has been
pre-viously identified based on its (1) absence of spines, (2) small
diameter, and (3) angle of branching from dendrite (
Ha¨usser et
al., 1995
), we performed ankyrinG immunostainings on every
recorded neuron to unambiguously identify the axon (
Fig. 1
).
Variability of axon location and AIS geometry in SNc
DA neurons
Consistent with the results obtained by
Ha¨usser et al. (1995
), we
observed a high degree of variability in soma-axon distance, with
the axon mainly originating from an axon-bearing dendrite
(ABD; 35 of 40 cells, 87.5%) and not from the soma (
Figs. 1
,
2
).
Indeed, the axon often arose from the ABD after the branching of
several secondary dendrites (mean number of intermediate
sec-ondary dendrites
⫽ 1.91, n ⫽ 35;
Figs. 1
,
2
). We analyzed this
unusual configuration by measuring the length and diameters of
the ABD up to the axon (ABD
stemfor stem ABD) and the starting
diameter of the axon (
Fig. 2
A, B). ABD
stemlength ranged from 0
to 106
m (mean ⫽ 33 ⫾ 27.5 m, n ⫽ 40), but the starting and
ending diameters of the ABD
stemdid not depend on its length
(
Fig. 2
B). Only the axon-start diameter was weakly negatively
correlated with ABD
stemlength (r
⫽ ⫺0.336, p ⫽ 0.037, n ⫽ 39).
We then characterized AIS geometry by measuring the distance
between the soma and the AIS (soma-AIS distance), AIS length,
and the AIS starting and ending diameters (
Fig. 2
C). While both
soma-AIS distance and AIS length were highly variable, ranging
from 20 to 125
m (mean ⫽ 55 ⫾ 27 m, n ⫽ 40) and from 20 to
55
m (mean ⫽ 32 ⫾ 7 m, n ⫽ 40), respectively, these two
measurements were not correlated (
Fig. 2
C). Concerning the
di-ameters, the starting diameter of the AIS was negatively
corre-lated with soma-AIS distance (r
⫽ ⫺0.436, p ⫽ 0.005, n ⫽ 40),
while its ending diameter did not show a significant correlation
with soma-AIS distance (
Fig. 2
C). Moreover, as shown in
Figure
2
D, most of the variation in soma-AIS distance was due to
vari-ation in ABD
stemlength. Therefore, consistent with previous
studies (
Ha¨usser et al., 1995
;
Blythe et al., 2009
;
Gonza´lez-Cabrera et al., 2017
;
Meza et al., 2018
), we found large variations
in AIS length, soma-AIS distance, but also in dendrite and axon
diameter between SNc DA neurons.
Variability of somatic AP waveform and pacemaking in SNc
DA neurons
SNc DA neurons in vitro generate a spontaneous regular pattern
of activity (low coefficient of variation of the interspike intervals
or ISIs) relying on the activity of various somatodendritic and
axonal voltage-gated ion channels (
Liss and Roeper, 2008
;
Gantz
et al., 2018
) (
Fig. 3
A). The AP in SNc DA neurons is initiated in
the axon (
Ha¨usser et al., 1995
;
Blythe et al., 2009
), most likely in
the AIS, as has been demonstrated in other neuronal types (
Kole
and Stuart, 2012
). Because AIS geometry is highly variable (
Fig.
2
), we wondered whether the shape of the somatic AP was also
variable in SNc DA neurons (
Fig. 3
). SNc DA neurons have been
demonstrated to express somatodendritic sodium channels that
are responsible for a faithful back-propagation of the
AIS-initiated AP (
Ha¨usser et al., 1995
;
Seutin and Engel, 2010
;
Ding et
al., 2011a
). This property leads to a biphasically rising AP
prising an initial segment (IS) and a somatodendritic (SD)
com-ponent, representing the contribution of AIS- and SD-located
sodium channels, respectively (
Grace and Onn, 1989
;
Ha¨usser et
al., 1995
;
Gentet and Williams, 2007
;
Blythe et al., 2009
;
Seutin
and Engel, 2010
). These two components are particularly easy to
separate when computing the first (dv/dt) and second (d
2v/dt
2)
time derivatives of the voltage signal during the AP (
Fig. 3
A, B).
While the first derivative (voltage velocity) is often used by
elec-trophysiologists to analyze AP dynamics (
Bean, 2007
), we found
that the second derivative (voltage acceleration) allows a better
discrimination of the IS and SD components (
Fig. 3
A, B).
Al-though the two derivatives depict different aspects of AP
dynam-ics (voltage velocity and acceleration), we found that the IS and
SD peaks of the second derivative are very strongly correlated
with their first derivative relatives (
Fig. 3
C). To characterize AP
shape, we therefore measured AP amplitude and AP half-width
but also the amplitudes of the d
2v/dt
2IS and SD components
(
Fig. 3
D, E). Consistent with previous observations (
Amendola et
al., 2012
;
Dufour et al., 2014
), both AP amplitude and AP
half-width displayed significant cell-to-cell variability, ranging from
48 to 78 mV (mean
⫽ 62 ⫾ 7.2 mV, n ⫽ 54) and 0.9 to 1.8 ms
(mean
⫽ 1.3 ⫾ 0.2 ms, n ⫽ 54), respectively, but were not
corre-lated (
Fig. 3
D). Moreover, only the SD component of the d
2v/dt
2significantly correlated with AP amplitude (
Fig. 3
E), suggesting
that the somatic AP shape is mainly determined by the activity of
SD sodium channels.
No relationship between AIS morphology and somatic
electrophysiological properties
Because several studies have demonstrated the influence of AIS
geometry on electrophysiological properties recorded at the
soma (
Kuba et al., 2006
;
Grubb and Burrone, 2010
;
Thome et al.,
2014
;
Chand et al., 2015
;
Hamada et al., 2016
;
Kole and Brette,
2018
), we wondered whether the variability in somatic AP shape
could be due to variations in AIS length or distance from the
soma. Surprisingly, we found no significant correlation between
AIS measurements and AP parameters (
Fig. 4
): neither AP
am-plitude nor AP half-width showed correlations with AIS length
(AP amplitude vs AIS length, r
⫽ ⫺0.141, p ⫽ 0.393, n ⫽ 39; AP
half-width vs AIS length, r
⫽ 0.069, p ⫽ 0.678, n ⫽ 39;
Fig. 4
B) or
distance from the soma (AP amplitude vs soma-AIS distance, r
⫽
0.041, p
⫽ 0.804, n ⫽ 39; AP half-width vs soma-AIS distance, r ⫽
⫺0.275, p ⫽ 0.0903, n ⫽ 39;
Fig. 4
B). While recent studies
sug-gested that the threshold of somatic APs might depend on
soma-AIS distance (
Platkiewicz and Brette, 2010
;
Thome et al., 2014
;
Hamada et al., 2016
;
Kole and Brette, 2018
), we did not find a
significant correlation between AP threshold and AIS
morphol-ogy (r
⫽ 0.144, p ⫽ 0.380, n ⫽ 39). The mechanisms underlying
the pacemaking in SNc DA neurons are still debated: while
sev-eral studies highlighted the central role played by
somatoden-dritic conductances (
Wilson and Callaway, 2000
;
Chan et al.,
2007
;
Guzman et al., 2009
;
Drion et al., 2011
;
Tucker et al., 2012
;
Jang et al., 2014
), a recent study suggested that the AIS sodium
channels may play a major role in controlling pacemaking
fre-quency (
Meza et al., 2018
). We therefore investigated whether
AIS morphology was related to variations in pacemaking
fre-quency. Consistent with previous observations (
Matsuda et al.,
1987
;
Putzier et al., 2009
;
Amendola et al., 2012
;
Dufour et al.,
2014
), we observed large cell-to-cell variations in pacemaking
Soma-AIS = 20 μm AIS length = 31 μm Soma-AIS = 70 μm AIS length = 35 μm Soma-AIS = 91 μm AIS length = 25 μm
AIS start and end Axon initial segment (AIS)
NB/AnkG
stem Axon-bearing dendrite (ABDstem) Non axon-bearing dendrite (nABD) ABD auxiliary dendrite (aD) Axon
ABDstem length = 106 μm
ABDstem length = 51 μm
ABDstem length = 0 μm
NB
A
B
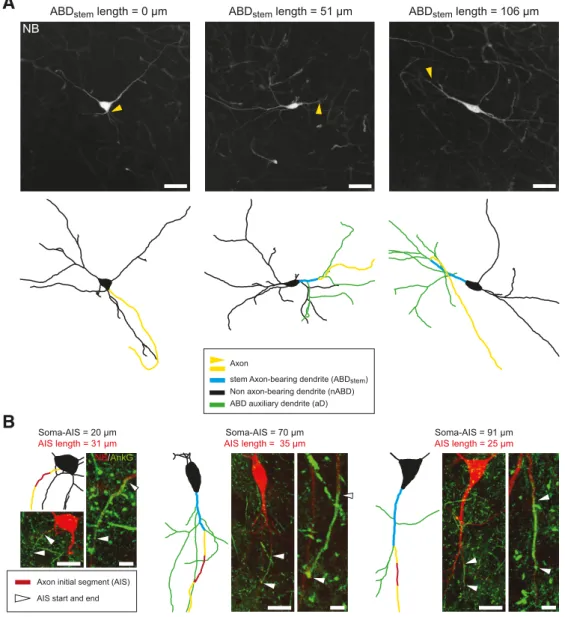
Figure 1. Mature SNc DA neurons display significant cell-to-cell variations in axon-related morphology. A, Neurobiotin stainings and skeleton representations of three SNc DA neurons show the
variations in the soma-axon distance. While some neurons have a soma-originating axon (left), the axon most often arises from an ABD (middle, right), at distances from the soma up to 100m (right). Moreover, ABD aDs are often present between the soma and the axon. B, Double neurobiotin-ankyrinG stainings and skeleton representations of three SNc DA neurons reveal significant variations in AIS distance from the soma. Each panel represents the skeleton with the original image at the same scale and an expanded version of the immunofluorescence image centered on the AIS. Scale bars: A, 50m; B, 25 m for the original images, 5 m for the AIS-centered expanded version.
frequency (from 0.59 to 3.24 Hz, mean
⫽ 1.67 ⫾ 0.73 Hz, n ⫽
46). However, in the 32 neurons where stable pacemaking was
recorded and AIS morphology was analyzed, no significant
cor-relation was found between the spontaneous firing frequency and
AIS length or distance from the soma (pacemaking frequency vs
AIS length, r
⫽ ⫺0.014, p ⫽ 0.938, n ⫽ 32; pacemaking frequency
vs soma-AIS distance, r
⫽ 0.005, p ⫽ 0.980, n ⫽ 32;
Fig. 4
C).
Role of somatodendritic sodium channels in
AP back-propagation
The results presented so far suggest that AIS morphology does
not play a predominant role in shaping SNc DA neuron activity,
as neither AP shape nor pacemaking frequency correlates with
AIS length or distance from the soma. We wondered whether the
reported presence of sodium channels in the dendrites (
Ha¨usser
et al., 1995
), and in particular in the ABD, could explain this lack
of dependence. To investigate this point, we first performed
dou-ble soma/dendrite current-clamp recordings in 29 neurons,
which were then labeled and reconstructed to determine whether
the recorded dendrites were axon-bearing (ABDs) or
non–axon-bearing (nABDs;
Fig. 5
A). These recordings allowed us to
moni-tor the back-propagation of APs from the AIS into the ABD, the
soma, and the nABDs. We observed a significant amplification of
the AP, particularly in the ABD: while AP amplitude increased
between the ABD and the soma (ABD vs soma; mean
⫾ SEM ⫽
58.3
⫾ 2.26 vs 60.6 ⫾ 2.08 mV, t ⫽ ⫺5.261, p ⬍ 0.001, n ⫽ 14,
paired t test), it did not change significantly anymore when the
AP propagated into the nABDs (soma vs nABD; median
⫽ 61.4 vs
ABDstem
ABDstem length
Axon AIS aD nABD øABD-st øABD-e Ax-st AIS length øAIS-st øAx-st øAIS-e
A
B
C
D
øAx-st 0 20 40 60 80 100 1200 4 8 12 0 1 2 3 4 5ABDstem length (μm) Count
Axon Diameter (μm) r=-0.336, p=0.037, n=39 4 0 2 Count øABD-st øABD-e 4 0 8 12 0 1 2 3 4 5 ABD stem diameter (μm) øAIS-st øAIS-e 0 10 20 30 40 50 60 0 20 40 60 80 100 120 140 0 1 2 3 4 4 0 2 5
Soma-AIS distance (μm) Soma-AIS distance (μm)
Count 4 0 8 4 0 8 0 2 4 Count 4 0 8 Count AIS length (μm) AIS diameter (μm) r=-0.436, p=0.005, n=40 r=0.970, p=6.10-5, n=40 -20 0 20 40 60 80 100 120 0 20 40 60 80 100 120 140
Axon start length (μm) 105
15 20 25 30 35 40 45 4 0 2 Count ABD stem length (μm)
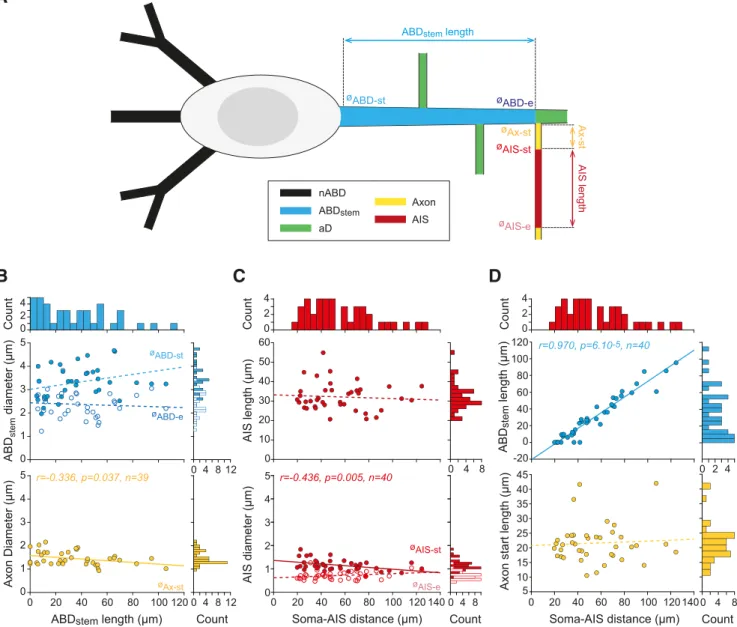
Figure 2. Detailed analysis of cell-to-cell variations in ABD and AIS morphology. A, Schematic presenting the main morphological parameters analyzed on each SNc DA neuron. The lengths of the
stem ABD (ABDstem), the axon start (Ax-st), the AIS (AIS length), the number of aDs, and the number of nABDs were measured. The starting and ending diameters of the stem ABD (ØABD-st, ØABD-e) and of the AIS (ØAIS-st, ØAIS-e) as well as the diameter of the axon start (ØAx-st) were also measured. The schematic also corresponds to the average topology observed in the 40 SNc DA neurons from which these measurements were obtained. B, Scatter plots representing the variation in ABDstemlength and its relationship with ABD (top) or axon diameters (bottom). Histograms represent the distribution of values for each parameter shown above or on the right side of the scatter plots. C, Scatter plots representing the variation in soma-AIS distance and its relationship with AIS length (top) and AIS diameters (bottom). Histograms represent the distribution of values for each parameter shown above or on the right side of the scatter plots. D, Scatter plots representing the variation in soma-AIS distance and its relationship with the length of ABDstem(top) or axon start length (bottom). Histograms represent the distribution of values for each parameter shown above or on the right side of the scatter plots. Plain lines indicate significant correlations between parameters. r, p, and n values are given on the corresponding plots. Dotted lines indicate nonsignificant correlations.
61.7, z
⫽ 0.454, p ⫽ 0679, n ⫽ 15, Wilcoxon signed rank test;
Fig.
5
B). Consistently, AP half-width decreased between the ABD and
the soma (ABD vs soma; mean
⫾ SEM ⫽ 1.24 ⫾ 0.06 vs 1.14 ⫾
0.06 ms, t
⫽ 5.632, p ⬍ 0.001, n ⫽ 14, paired t test) but did not
change significantly between the soma and the nABDs (soma vs
nABD; mean
⫾ SEM ⫽ 1.31 ⫾ 0.06 vs 1.30 ⫾ 0.06 ms, t ⫽ 1.441,
p
⫽ 0.172, n ⫽ 15, paired t test;
Fig. 5
B). The analysis of the IS and
SD components of the d
2v/dt
2confirmed and extended these
observations: while the IS component displayed a strong decrease
between the ABD and the soma (ABD vs soma; mean
⫾ SEM ⫽
595
⫾ 46 vs 274 ⫾ 31 mV䡠ms
⫺2, t
⫽ 7.47, p ⬍ 0.001, n ⫽ 14,
paired t test), the SD component displayed a strong increase in
amplitude over the same course (ABD vs soma; mean
⫾ SEM ⫽
185
⫾ 49 vs 342 ⫾ 60 mV䡠ms
⫺2, t
⫽ ⫺4.284, p ⬍ 0.001, n ⫽ 13,
paired t test;
Fig. 5
C). Although of smaller magnitudes, these
changes persisted when the AP propagated into the nABDs (IS
A
D
C
B
E
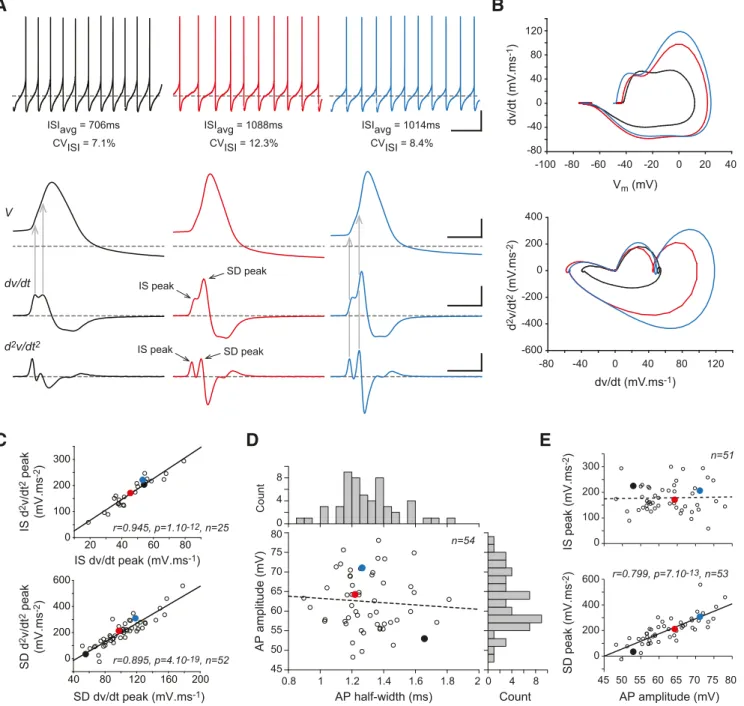
0 200 400 600 0 100 200 300 45 50 55 60 65 70 75 80 0.8 1 1.2 1.4 1.6 1.8 2 AP amplitude (mV) IS peak (mV.ms -2) SD peak (mV.ms -2) 45 50 55 60 65 70 75 80 AP amplitude (mV) AP half-width (ms) V dv/dt dv/dt (mV.ms-1) dv/dt (mV .ms -1) Vm (mV) IS peak d2v/dt2 d 2v/dt 2 (mV .ms -2) IS peak SD peak SD peak 4 0 8 8 4 0 Count Count r=0.799, p=7.10-13, n=53 ISIavg = 706ms CVISI = 7.1% ISIavg = 1088ms CVISI = 12.3% ISIavg = 1014ms CVISI = 8.4% n=54 n=51 0 200 400 -200 -400 -600 -80 -40 0 40 80 120 -20 0 20 -100 -80 -60 -40 40 -80 -40 0 40 80 120 IS dv/dt peak (mV.ms-1) 20 40 60 80 IS d 2v/dt 2 peak (mV.ms -2) 0 100 200 300 SD dv/dt peak (mV.ms-1) 40 80 120 160 200 SD d 2v/dt 2 peak (mV.ms -2) 0 200 400 600 r=0.945, p=1.10-12, n=25 r=0.895, p=4.10-19, n=52Figure 3. Cell-to-cell variations in soma-recorded AP waveform. A, Somatic current-clamp recordings of membrane voltage (top), first time-derivative of voltage (middle), and second
time-derivative of voltage (bottom) during an AP in three different neurons. The IS and SD components of the AP are indicated on the center traces for the first and second time-derivatives. Vertical gray arrows indicate the timing of the IS and SD peaks of the first derivative (left traces) or the second derivative (right traces) relative to the AP. B, Primary phase-plane plots (dv/dt vs Vm, top) and secondary phase-plane plot (d2v/dt2vs dv/dt, bottom) for the 3 neurons presented in A. C, Top, Scatter plot representing the strong correlation between the IS peak of the second derivative of voltage (d2v/dt2) and IS peak of the first derivative of voltage (dv/dt) measured in 25 neurons. Bottom, Same type of scatter plot for the SD peak measured in 52 neurons. D, Scatter plot representing the lack of significant correlation between AP amplitude and half-width. The distribution of values for both parameters is shown as histograms on the right and top of the scatter plot. E, Scatter plots representing the relationship between the amplitude of the second time-derivative IS or SD component and AP amplitude. Only the SD component was significantly correlated with AP amplitude. Plain lines indicate significant correlations between parameters. r, p, and n values are given on the corresponding plots. Dotted lines indicate nonsignificant correlations. Calibration: A, Horizontal 2 s (top), 2 ms (3 bottom rows); vertical 20 mV (2 top rows), 50 mV䡠ms⫺1(third row), 200 mV䡠ms⫺2(bottom row). Horizontal gray dotted lines indicate⫺60 mV (voltage traces) and 0 mV䡠ms⫺1 or 0 mV䡠ms⫺2for the derivative traces. C–E, Values corresponding to the recordings presented in A are identified by colored dots of matching colors.
soma vs IS nABD, mean
⫾ SEM ⫽ 374 ⫾
27 vs 264
⫾ 20 mV䡠ms
⫺2, t
⫽ 5.86, p ⬍
0.001, n
⫽ 13, paired t test; SD soma vs SD
nABD, median
⫽ 212 vs 254 mV䡠ms
⫺2,
z
⫽ 3.181, p ⬍ 0.001, n ⫽ 15, Wilcoxon
signed rank test;
Fig. 5
C).
Density of somatodendritic sodium and
delayed rectifier potassium currents
To determine whether this profile of AP
back-propagation arose from a differential
distribution of sodium channels in the ABD,
soma, and nABDs, we measured sodium
currents in these different compartments
using outside-out patch-clamp recordings
(
Fig. 6
A–C). While we observed a large
vari-ability in sodium conductance density
(g
Na), ranging from 29 to 180 pS/
m
2(mean
⫽ 70 ⫾ 45 pS/m
2, n
⫽ 29),
con-ductance density did not seem to depend on
the recording site (ABD, soma or nABDs),
as revealed by the lack of significant
correla-tion between g
Naand pipette-soma distance
or pipette-AIS distance (
Fig. 6
B). Although
other voltage-gated currents have been
demonstrated to display heterogeneous
dis-tributions in the SD compartment of SNc
DA neurons (
Gentet and Williams, 2007
;
Dufour et al., 2014
;
Engel and Seutin, 2015
),
our results suggest a fairly homogeneous
pattern of expression of sodium channels in
the SD compartment. We then wondered
whether the variability in sodium
conduc-tance density could be related to cell-to-cell
variations in soma-AIS distance (
Fig. 6
C):
no correlation was found between
soma-AIS distance and sodium conductance
density.
AP shape is not only defined by sodium
currents but also by potassium currents, in
particular the delayed rectifier type, which
play a major role in the control of AP
half-width (
Lien and Jonas, 2003
;
Bean, 2007
;
Ding et al., 2011b
). Using the same type of
recordings as for sodium currents, we
mea-sured delayed rectifier potassium currents
in the ABD, soma, and nABDs of SNc DA
neurons (
Fig. 6
D–F). Again, while a
signifi-cant variability in potassium conductance
(g
KDR) was observed, ranging from 11 to
626 pS/m
2(mean
⫽ 151 ⫾ 165 pS/m
2,
n
⫽ 25), no significant relationship was
found with any of the morphological
pa-rameters analyzed: potassium conductance
density was independent of recording
loca-A
B
C
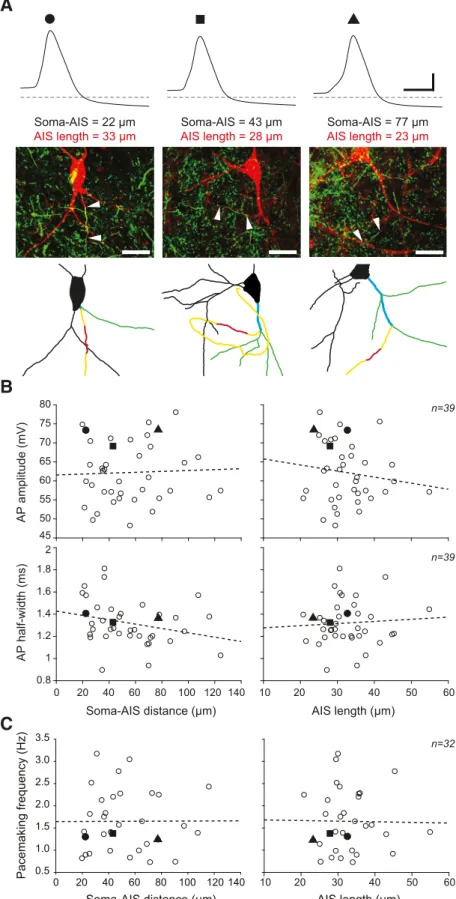
n=39 n=39 n=32 45 50 55 60 65 70 75 80 0.8 1 1.2 1.4 1.6 1.8 2 0 20 40 60 80 100 120 140 Soma-AIS distance (μm) 10 20 30 40 50 60 10 20 30 40 50 60 AIS length (μm) AP amplitude (mV) AP half-width (ms) Soma-AIS distance (μm) 0 20 40 60 80 100 120 140 Pacemaking frequency (Hz) 0.5 1.0 1.5 2.0 2.5 3.0 3.5 AIS length (μm) Soma-AIS = 22 μm AIS length = 33 μm Soma-AIS = 43 μm AIS length = 28 μm Soma-AIS = 77 μm AIS length = 23 μmFigure 4. Absence of correlation between electrophysiological parameters and AIS geometry. A, Top, Somatic current-clamp
recordings of the AP in 3 neurons presenting significant variations in soma-AIS distance and AIS length. Middle, Double immuno-labeling (neurobiotin/ankyrinG; red/green) of the recorded neurons showing AIS location and length. White arrowheads indicate AIS start and end. Bottom, Skeleton representation of the same neurons indicates the axon, AIS, ABD, and aDs, using the color coding already used inFigures 1and2. B, Scatter plots representing the lack of significant correlations between soma-AIS distance (left) or AIS length (right) and AP amplitude (top) or half-width (bottom) observed in 39 recorded and reconstructed neurons. C, Scatter plots representing the lack of significant correlations between soma-AIS distance (left) or AIS length (right) and pacemaking
4
frequency observed in 32 recorded and reconstructed neurons. B, C, Values corresponding to the 3 neurons presented in A are identified by a black circle, square, or triangle. Calibration: A, recordings, 20 mV vertical, 2 ms horizontal; pictures, 25m. Horizontal dotted lines indicate⫺60 mV. B, C, Dotted lines indicate linear regressions (nonsignificant in all cases).
tion, distance from the AIS, or soma-AIS distance (
Fig. 6
E,F).
Over-all, these results show that sodium and delayed rectifier potassium
currents are expressed in the SD compartment of SNc DA neurons in
a fairly homogeneous manner, while displaying significant
cell-to-cell variability in conductance density.
In summary, our experimental results suggest that, in SNc DA
neurons, AIS morphology shows significant cell-to-cell
varia-tions. In particular, the axon most often arises from an ABD of
highly variable length and complexity. Despite this, AIS
mor-phology seems to have a negligible impact on the shape of the AP
recorded at the soma or on pacemaking frequency. Moreover,
dendritic recordings indicate that sodium and delayed rectifier
potassium currents are fairly homogeneously expressed in the
soma and primary dendrites of SNc DA neurons. To determine
A
C
B
nABD Soma ABD
AP amplitude (mV) 40 50 60 70 80 n.s.
***
n.s.***
SD peak (mV/ms -2) 0 400 800nABD Soma ABD
AP half-width (ms)0.8 1.2 1.6 2
nABD Soma ABD
IS peak (mV/ms
-2)
200 600 1000
nABD Soma ABD
***
***
***
***
Pipette to soma distance (μm)
-40 -20 0 20 40 60 80 100 100 200 300 400 500 600
Pipette to soma distance (μm)
-40 -20 0 20 40 60 80 100 20 40 100 160 nABDSoma ABD AP amplitude dendrite/soma ratio (%) AP half-width dendrite/soma ratio (%) IS peak dendrite/soma ratio (%) IS peak dendrite/soma ratio (%) SD peak dendrite/soma ratio (%) SD peak dendrite/soma ratio (%) 96 98 100 102 nABDSoma ABD 100 96 104 108 112 nABDSoma ABD 50 100 150 200 250 nABDSoma ABD 60 80 100 120 nABD Pipette to soma = 21 μm ABD Pipette to soma = 31 μm n=14 n=13 n=13 n=15
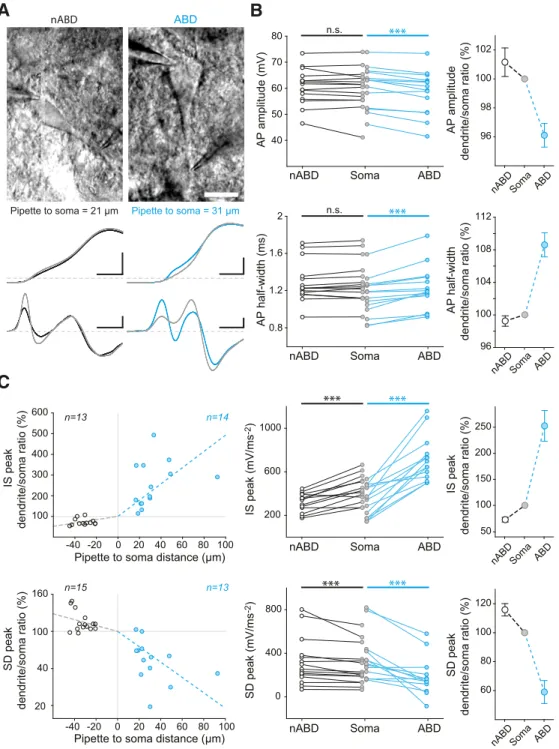
Figure 5. Back-propagating spikes suggest the presence of significant Na channel density in dendrites. A, Top, Photomicrographs showing examples of double recordings from a nABD (left) and
an ABD (right). Middle, Somatic (gray trace) and dendritic (black or blue traces) current-clamp recordings of the same neurons. Bottom, Second time derivative of the voltage (d2v/dt2) during the AP in the same neurons. B, Scatter plots representing the changes in AP amplitude (top) and half-width (bottom) during the back-propagation of an AP in the ABD, soma, and nABD. Right, Values normalized to soma. C, Scatter plots representing the changes in IS and SD d2v/dt2components during back-propagation. Left, IS (top) and SD (bottom) amplitudes normalized to soma represented as a function of the recording distance from the soma. Positive distances correspond to ABD recordings, and negative distances correspond to nABD recordings. Middle, Changes in IS (top) and SD (bottom) raw amplitudes between ABD, soma, and nABDs. Right, Changes in normalized IS and SD components in ABD, soma, and nABDs. Dotted lines indicate nonsignificant correlations. Normalized data on the right scatter plots are indicated as mean⫾SEM.***p⬍0.001,n.s.notstatisticallysignificant.Calibration:A,Pictures,20m.Recordings,20mVvertical,0.25mshorizontal (middle left); 20 mV vertical, 0.5 ms horizontal (middle right), 200 mV䡠ms⫺2vertical, 0.25 ms horizontal (bottom left), 50 mV䡠ms⫺2vertical, 0.5 ms horizontal (bottom right). Horizontal gray dotted lines indicate⫺40 mV (voltage traces) and 0 mV䡠ms⫺2(derivative traces).
A
B
C
D
E
F
Pipette to AIS distance (μm)40 20 60 80 100 120 140 160 180 n=14 gKDR ( p S/μ m 2) 0 100 200 300 400 500 600 NB/AnkG nABD: pipette to soma = -14 μm
- 120 mV 0 mV
ABD: pipette to soma = 23 μm NB/AnkG NB/AnkG - 40 mV 40 mV -80 mV gNa (pS /μ m 2) Soma-AIS distance (μm) 20 0 40 60 80 100 40 20 60 80 100 120 140 160 180 n=16
Pipette to soma distance (μm) -40 -60 -20 0 20 40 60 80 100 120 40 20 60 80 100 120 140 160 180 gNa (pS /μ m 2) n=22 gNa (pS /μ m 2) 40 20 60 80 100 120 140 160 180 n=16
Pipette to AIS distance (μm)
0 20 40 60 80 100 120 140 gKDR (pS /μ m 2)
Pipette to soma distance (μm) -30 -40 -20 -10 0 10 20 30 40 0 100 200 300 400 500 600 n=14 gKDR (pS /μ m 2) Soma-AIS distance (μm) 40 20 60 80 100 120 140 160 0 100 200 300 400 500 600 n=14 Control TTX
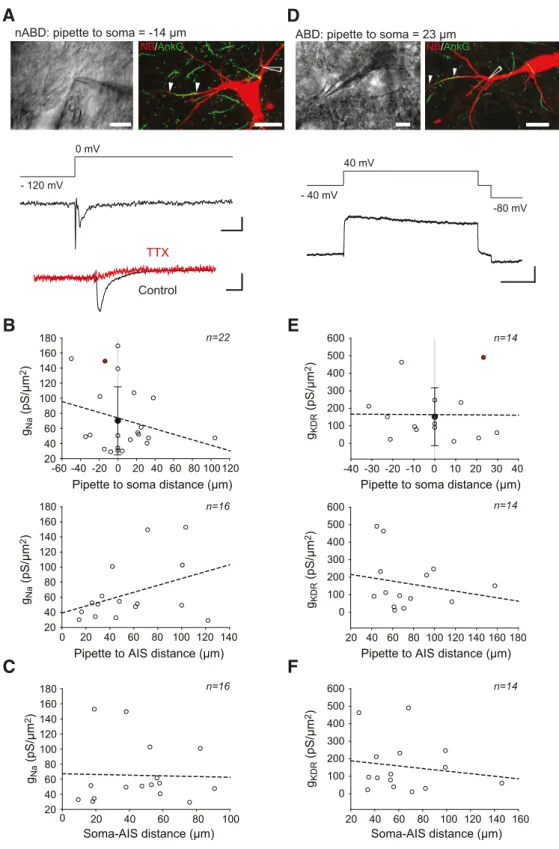
Figure 6. Somatodendritic sodium and delayed rectifier potassium current recordings. A, Top left, Photomicrograph showing an example of a recording from a nABD. Top right, Same neuron
labeled for neurobiotin (red) and ankyrinG (green) with the recording location indicated by a white schematized pipette. White arrows indicate the AIS start and end. Middle, Outside-out recording of the sodium current corresponding to the neuron shown above. Bottom, Somatic outside-out recording from another neuron using the same protocol showing the sensitivity of the sodium current to TTX. B, Scatter plots representing the lack of significant correlations between sodium conductance density and the distance of recording site from the soma (top) or the AIS (bottom). Top, Negative and positive distance values correspond to nABD and ABD recording sites, respectively. The value corresponding to the neuron presented in A is indicated by a red dot. Black circle represents the average conductance density. Error bars indicate SD. C, Scatter plot representing the lack of correlation between sodium conductance density and soma-AIS distance. Dotted lines indicate nonsignificant correlations. D–F, Description of the delayed rectifier current in the somatodendritic compartment using the same presentation as the one given for sodium currents in A–C. D, Neuron where an outside-out recording was obtained from the ABD. Calibration: A, D, Top left, 10m; Top right, 25 m. A, Middle, Bottom, 10 pA vertical, 2 ms horizontal; D, Bottom, 50 pA vertical, 25 ms horizontal.
how these peculiar biophysical and morphological characteristics
interact to influence AP shape and firing frequency, we built a
multicompartment model of SNc DA neuron based on the
mor-phological reconstructions presented above.
Influence of variable axonal and dendritic sodium channel
density on activity
Our multicompartment model included most of the
somatoden-dritic voltage- and calcium-gated ion currents known to be
in-volved in pacemaking (
Liss and Roeper, 2008
;
Drion et al., 2011
;
Gantz et al., 2018
): I
H, I
CaL(Cav1.3), I
A, I
SK, I
Na, and I
KDR(
Table
1
). The axon contained only I
Naand I
KDR, with a higher density of
these currents in the AIS than in the rest of the axon, consistent
with observations made in several neuronal types (
Clark et al.,
2009
;
Kole and Stuart, 2012
). As a first step, we used an
average-morphology model (
Fig. 7
A) to determine which densities of
dendritic and axonal I
Naand I
KDRcould replicate the
electrophys-iological profile recorded in real neurons (AP shape, amplitudes
of IS and SD d
2v/dt
2components, faithful back-propagation).
The variations in SD conductance densities were based on the
outside-out voltage-clamp recordings presented in
Figure 6
: we
thus chose to vary g
Nafrom 25 to 200 pS/
m
2(25 pS increment)
and g
KDRfrom 50 to 400 pS/m
2(50 pS increment). For
simplic-ity, we systematically covaried these two conductances, keeping
their ratio constant (g
Na/g
KDR⫽ 0.5). Except for the lowest pair of
values of densities (25/50 pS/
m
2for g
Na
/g
KDR), which generated
unstable electrophysiological behaviors in some neurons (data
not shown), this range of SD densities yielded amplitudes of the
SD d
2v/dt
2component at the soma very similar to the ones
ob-served in our recordings (30 – 450 vs 0 –500 mV
䡠ms
⫺2;
Fig. 7
B vs
Fig. 3
E). For the AIS, we determined g
Nasuch that the amplitudes
of the IS d
2v/dt
2component matched the range of experimental
values observed in our recordings (100 –300 mV䡠ms
⫺2). The AIS
g
Nadensities defined by this constraint ranged from 1000 to 8000
pS/m
2(1000 pS increment;
Fig. 7
A, B). As g
KDR
in the AIS is
unknown, we chose to couple it to g
Nausing the same range of
values (1000 – 8000 pS/m
2). The differences in densities
be-tween the AIS and the SD compartment are consistent with the
reported high density of sodium channels in the AIS compared
with soma and dendrites (
Kole et al., 2008
;
Lorincz and
Nusser, 2010
). All other conductance densities were kept
con-stant (
Table 1
).
Our model reproduced the typical electrophysiological
fea-tures observed in real SNc DA neurons (
Fig. 7
C): a spontaneous
pacemaking pattern of activity, a voltage sag and a biphasic
re-bound in response to hyperpolarizing current pulses, and a broad
biphasic AP characteristic of SNc DA neurons (
Grace and
Bun-ney, 1984
;
Washio et al., 1999
;
Seutin and Engel, 2010
;
Amendola
et al., 2012
;
Dufour et al., 2014
). We then wondered whether the
model was able to reproduce the specific profile of AP
back-propagation described in
Figure 5
. Most combinations of SD and
AIS g
Nadensities reproduced the increases in AP amplitude and
in SD d
2v/dt
2component and the decreases in AP duration
and in IS d
2v/dt
2component observed between the ABD, soma,
and nABDs ( p
⬍ 0.001 for all significant differences, ANOVA test
with Bonferroni correction;
Fig. 8
B, C). The combinations of 50 –
100 pS/m
2and 3000 –5000 pS/m
2for SD and AIS g
Na
,
respec-tively, quantitatively best reproduced the back-propagation
profile (
Fig. 8
C vs
Fig. 5
). The model also reproduced the strong
link found between AP amplitude and SD d
2v/dt
2and the
ab-sence of link between AP amplitude and IS d
2v/dt
2, independent
of the values of SD and AIS g
Na(
Fig. 8
D). Moreover, the range of
AP amplitudes obtained matched the experimentally observed
values (52– 88 mV vs 48 –78 mV;
Fig. 8
D vs
Fig. 3
E). Our model is
therefore able to faithfully reproduce the two phases of the AP (IS
and SD), their specific back-propagation profiles, and the
changes in amplitudes and duration observed between the ABD,
the soma, and the nABDs (
Fig. 8
B, E).
We then tried to determine the respective influence of SD and
AIS g
Naon pacemaking frequency in our constrained model (
Fig.
8
F ). Interestingly, while varying SD g
Naover its full range
in-creased pacemaking frequency by as much as 35% (from 1.79 to
2.41 Hz), varying g
Nain the AIS increased pacemaking frequency
by
⬍6% (from 1.79 to 1.88 Hz). Therefore, our model suggests
that pacemaking frequency in SNc DA neurons is more strongly
controlled by SD than by AIS sodium channels.
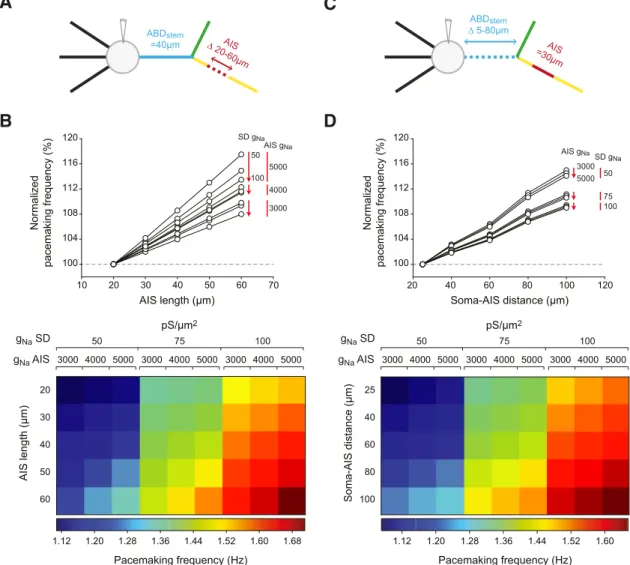
Influence of variable dendrite and AIS morphology
on activity
While these simulations were performed using an average
mor-phology, our experiments demonstrated important cell-to-cell
variations in morphology, at both the dendritic and axonal levels
(
Fig. 2
). As AIS length has been reported to influence excitability
in several neuronal types (
Kuba et al., 2006
,
2014
;
Gutzmann et
al., 2014
), including mouse SNc DA neurons (
Meza et al., 2018
),
we first tested how variations in AIS length modified pacemaking
frequency in a simplified version of our model (no intermediate
dendrites on the ABD;
Fig. 9
A, B). All combinations of SD and
AIS g
Nawere tested, but we present the results only for 50 –100
pS/m
2in the dendrites and 3000 –5000 pS/m
2in the AIS (the
other combinations gave very similar results). While modifying
AIS g
Nadensity had little influence on pacemaking frequency
(
⬍6%;
Fig. 8
F ), we found that pacemaking frequency was more
strongly influenced by modifying AIS length (
Fig. 9
B): changing
the length from 20 to 60
m increased frequency by as much as
17.5% (from 1.13 to 1.33 Hz), depending on SD and AIS g
Nadensities. Using the same simplified model, we then tested
whether a variable soma-AIS distance was associated with
signif-icant variations in pacemaking frequency (
Fig. 9
C,D), as AIS
dis-tance has also been proposed to influence neuronal excitability
(
Grubb and Burrone, 2010
;
Hamada et al., 2016
). Because most
of the cell-to-cell variation in soma-AIS distance is indeed due to
variations in ABD length (
Fig. 2
D), we varied ABD
stemlength
from 5 to 80
m while keeping the axon-start length constant at
20
m. This morphological variation induced increases in
pace-making frequency similar to the ones observed when varying AIS
length (maximum 15%, from 1.07 to 1.23 Hz;
Fig. 9
D).
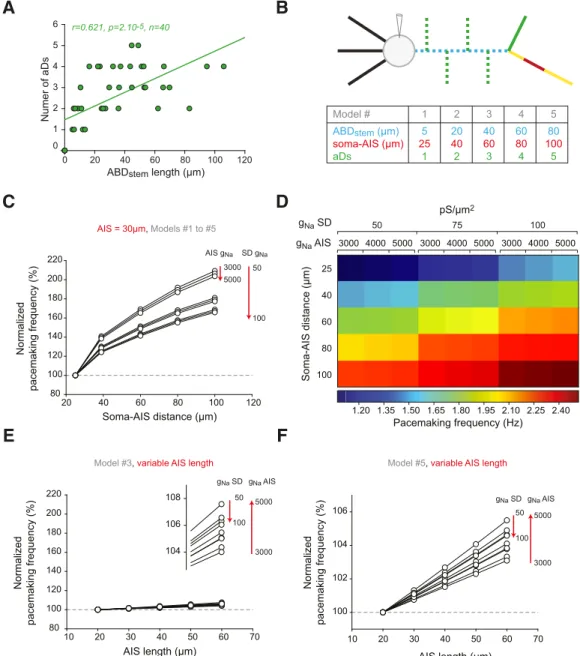
However, it has to be noted that cell-to-cell variations in ABD
stemlength are associated with a significant increase in the number of
secondary dendrites branching from the ABD in between the
soma and the axon (aDs;
Fig. 10
A). In addition, dendritic
topol-ogy has been shown to greatly influence neuronal output
(
Mainen and Sejnowski, 1996
;
Vetter et al., 2001
;
van Ooyen et
al., 2002
). To take these findings into account, we next tested the
influence of varying ABD
stemlength with the associated change in
dendritic complexity (
Fig. 10
B–D). Interestingly, including aDs
greatly increased the influence of soma-AIS distance on
pace-making frequency: changing this distance from 25
m (with 1
aD) to 100
m (with 5 aDs) increased pacemaking frequency by
⬎100% (from 1.07 to 2.24 Hz;
Fig. 10
C). Moreover, while the
increase in frequency due to dendritic complexity was strongly
potentiated by changes in SD g
Nadensity, it was almost
insensi-tive to changes in AIS g
Na(
Fig. 10
D). We then wondered whether
the increase in ABD complexity modified the impact of AIS
length on pacemaking frequency. Indeed, while varying AIS
length in the simplest model (1 aD) increased pacemaking
fre-quency by as much as 17.5% (
Fig. 9
B), the increase was reduced
to
⬍8% for the average-morphology model (3 aDs;
Fig. 10
E) and
to
⬍6% for the model with the longest soma-AIS distance (5 aDs;
Fig. 10
F ). Overall, these results reinforce the conclusions
ob-tained with the variations of g
Na(
Fig. 8
), as they demonstrate that
morphological variations of the SD compartment have a stronger
influence on pacemaking frequency than changes of the AIS:
while SD variations can modulate pacemaking frequency by as
much as 109%, frequency changes due to AIS manipulations do
not exceed 18%.
A
B
Ax-st AIS ABDstem nABD Soma aD Axon nABD (3) 500 25-200 50-400 25-200 50-400 25-200 50-400 25-200 50-400 25-200 50-400 400 400 1-8.103 1-8.103 3->0.5 soma 20 20 ABDstem 36 3.3->2.4 aD (3) 500 2->0.5 Ax-st 21 1.5 AIS 32 1.15->1 axon 800 0.7 L (μm) Ø (μm) gNa (pS/μm2) gKDR (pS/μm2)C
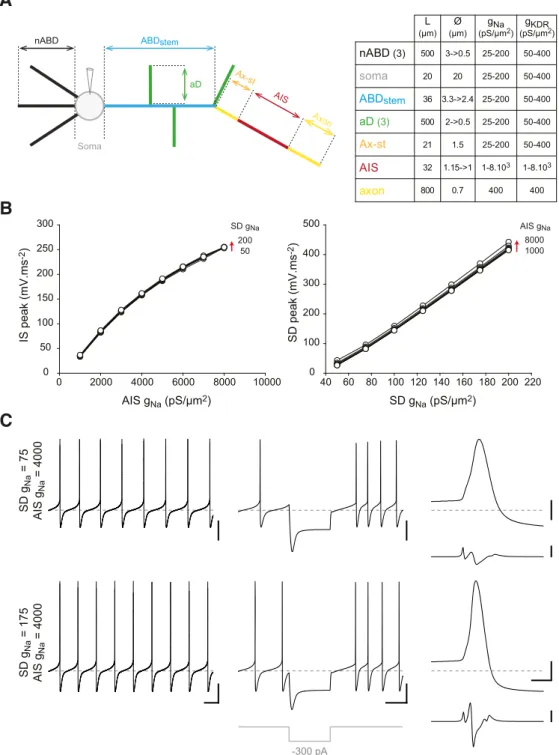
AIS gNa (pS/μm2) IS peak (mV.ms -2) SD gNa (pS/μm2) SD g Na = 75 AIS g Na = 4000 SD g Na = 175 AIS g Na = 4000 SD peak (mV.ms -2) 0 2000 4000 6000 8000 10000 0 50 100 150 200 250 300 40 60 80 100 120 140 160 180 200 220 0 100 200 300 400 500 -300 pA 8000 1000 AIS gNa 200 50 SD gNaFigure 7. Validation of the average-morphology model. A, Left, Schematic representation of the average-morphology model depicting all the neuronal compartments included in the
simulation. Right, Table indicating the length and diameters of the model compartments. While the axon, axon start (Ax-st) and the soma were modeled as cylinders (constant diameter), all other compartments were modeled as truncated cones. ABD, ax-st, and AIS length and diameters were based on measurements performed on confocal reconstructions of all the neurons included in the study. B, Left, Line and scatter plot representing the relationship between AIS gNaand the amplitude of the IS d
2v/dt2component recorded at the soma. Right, Line and scatter plot representing the relationship between SD gNaand the amplitude of the SD d
2v/dt2component recorded at the soma. The data from 56 simulations (combinations of 50 –200 pS/m2SD g
Naand 1000 – 8000 pS/m 2AIS g
Na) are represented and show the strict dependence of the two phases of the AP on the respective densities of sodium conductance in the AIS and the SD compartments. C, Voltage traces representing the pacemaker activity (left), the response to a hyperpolarizing current step (middle,⫺300 pA), and the waveform of the somatic AP and its second time-derivative (right) in the average-morphology model with a low density of SD gNa(75 pS/m
2, top traces) and a higher density of SD gNa (175 pS/m2, bottom traces). Calibration: C, Left, Middle, 20 mV vertical, 200 ms horizontal; Right, 20 mV vertical, 2 ms horizontal (top), 200 mV䡠ms⫺2vertical (bottom). Horizontal gray dotted lines indicate⫺60 mV (voltage traces).