Corrosion Fatigue Performance of Alloy 6013-T6
byJean-Marc P. Genkin
Ing6nieur Civil, Ecole des Mines de Paris (1992)
Submitted to the Department of Materials Science and Engineering in Partial Fulfillment of the Requirements for the Degree of
Master of Science in Materials Engineering at
Massachusetts Institute of Technology
February 1994
© Massachusetts Institute of Technology
Signature of Author
Deparjnent of *aterials Science and Engineering
January 14, 1994
Certified by
Professor Regis M.Pelloux Thesis Advisor
Accepted b3
Cil V.Thompson II Professor of Electronic Materials Chairman, Departmental Committee on Graduate Students · _ · _ Y *- _1|_ I
Corrosion Fatigue Performance of Alloy 6013-T6
byJean-Marc P.Genkin
Submitted to the Department of Materials Science and Engineering on January 15, 1994 in Partial Fulfillment of the Requirements
for the Degree of Master of Science in Materials Engineering
ABSTRACT
In the context of the issue of aging airplanes, the FAA has initiated different research programs to study the effect of corrosion fatigue on the structural integrity of airplanes. 2024-T3 aluminum alloy is the alloy which has received the most attention since it is widely used by aircraft manufacturers. However, a few years ago, Alcoa introduced 6013-T6 aluminum alloy as a possible candidate to replace 2024-T3 in fuselage skin and leading edges. the research work reported here compares the fatigue performance of both alloys along with the effect of precorrosion on fatigue crack initiation and propagation lives in thin gauge aluminum alloys.
6013-T6 alclad microstructure is first studied to determine cladding thickness, grain size and second phase particles. Corrosion experiments are carried out by immersion in ASTM G69 solution. Maximum pit depth, pit area fraction and pit density are recorded. Pit diameter increases much slower than pit depth. Comparison with 2024-T3 alclad shows that pit density is much lower than in 2024-T3 alclad base metal but pits are deeper than in 6013-T6 alclad.
The fatigue performance of fuselage skin is simulated by using tensile specimens with a centered open hole. These specimens are precorroded for 6, 12 and 24 hours and fatigue tested in air at 10Hz, under a R-ratio of 0.05. Numerous pits are found on the walls of the open hole along with microcracks in the cladding and at the cladding/base metal interface. Fatigue crack initiation life is sharply reduced by precorrosion exposures. Comparison with 2024-T3 alclad shows that 6013-T6 alclad is inferior to 2024-T3 alclad in terms of fatigue performance, both in the as-received and in the precorroded conditions. The sensitivity of crack initiation life to precorrosion is higher in 6013-T6 alclad than in 2024-T3 alclad. For both alloys, increasing precorrosion times has little effect on fatigue performance. This can be attributed to the fact that the stress intensity factor at the tip of a pit varies very little with pit depth for a given pit diameter.
Fatigue crack growth tests are run at 10Hz under two different load ratios R=0.05, 0.33 to explore the influence of R-value on fatigue crack propagation. At a given AK, the crack growth rates are increased by a larger R-value. Precorroded and as-received specimens are used to evaluate the effect of corrosion damage on fatigue crack growth. No significant effect is recorded.
Fatigue crack growth tests run at 10Hz in ASTM G69 solution shows an increase in crack growth rates by a factor of 2 at low A K. Decreasing the frequency to 0.1 Hz decreases crack growth rates because of crack tip branching and blunting which lower
the stress intensity at the tip of the crack.
It is concluded that corrosion fatigue damage in 6013-T6 alclad has a more detrimental effect on fatigue crack initiation than on fatigue crack propagation.
Thesis Supervisor: Regis M.Pelloux
TABLE OF CONTENTS ABSTRACT p.2 TABLE OF CONTENTS p.3 LIST OF FIGURES p.5 LIST OF TABLES p.8 ACKNOWLEDGEMENTS p.9 CHAPTER I: Introduction
I.1 Fatigue Damage in Aircraft Structures p.10
1.2 Aluminum Alloys used in the Aircraft Industry p. 13
1.3 Pitting of Aluminum Alloys p. 18
1.4 Crack Initiation p.22
1.5 Crack Propagation p.26
CHAPTER II: Microstructural Characterization of 6013-T6 alclad aluminum alloy
II. I Second Phase Particles p.29
11.2 Grain size p.34
II.3 Cladding p.34
CHAPTER III: 6013-T6 Alclad Corrosion Performance in ASTM G69
III.1 Experimental Procedures
III.1.1 solution-Potential p.35
III. 1.2 Corrosion Tests p.35
111.2 Results
III.2.1 Solution-Potential p.3 5
II.2.2 Pit morphology p.35
III.2.3 Pit Depth p.41
III.2.4 Pit Area Fraction p.46
CHAPTER IV: Experimental procedures for corrosion fatigue IV.1.1 Sample geometry
IV. 1.2 Experimental Set-up
CHAPTER V: Results of corrosion fatigue experiments
V. 1 Crack Initiation V.2 Crack propagation
CHAPTER VI: Discussion of Results
CONCLUSION
RECOMMENDATIONS FOR FUTURE WORK
APPENDIX: Fatigue tests data
REFERENCES p.5 0 p.5 1 p.5 7 p.69 p.7 7 p.87 p.90 p.91 p.106
LIST OF FIGURES
1.1 Fuselage modeled as a thin wall pressure vessel p.10
1.2 Multi Site Damage p. 11
1.3 Second phase particles in aluminum p.12
1.4 Stress distribution around a hole in an axially loaded plate p.24
1.5 Residual life prediction of crack initiation p.25
2.1 6013-T6: constituent particles (x1000) p.26
2.2 6013-T6: grain texture (x2(.)()) p.27
2.3 6()13-T6: grain size (x33()) p.33
2.4 2024-T3: grain size (x3()00) p.33
3.1 6013-T6: microstructure before corrosion (x300) p.38
3.2 6013-T6: microstructure after 30 minute corrosion (x300) p.38
3.3 6013-T6: microstructure after one hour corrosion (x300) p.39 3.4 6013-T6: microstructure after six hour corrosion (x300) p.39
3.5 6(013-T6: microstructure after one hour corrosion (x1710) p.4 0
3.6 6()13-T6: microstructure after six hour corrosion (x1710) p.40
3.7 6013-T6: overall pit density after immersion in ASTM G69 p.42
3.8 6013-T6: intergranular corrosion after 60 hour corrosion p.42
3.9 6013-T6: cross-section of the T-S plane after six hour corrosion p.43
3.10 2024-T3: cross-section of the T-S plane after six hour corrosion p.43
3.11 6013-T6: pit depth frequency after one hour corrosion p.44
3.12 6013-T6: pit depth frequency after six hour corrosion p.44 3.13 6013-T6: maximum pit depth as a function of the corrosion time p.45 3.14 6013-T6: pit area fraction as a function of the corrosion time p.45 3.15 6013-T6: pit area distribution after one hour corrosion p.47
3.17 6013-T6: crystallographic pits in tha cladding (x70) p.48
3.18 6013-T6: crystallographic pits in the cladding (x1800) p.48
4.1 Specimens designed for the study of crack initiation p.51
4.2 Rivet hole geometry p.50
4.3 CCT specimens p.52
4.4 Experimental set-up p.53
4.5 Set-up for tests run in ASTM G69 p.54
5.1 6013-T6 alclad: Microcracks in the cladding (x8.5) p.61
5.2 6013-T6 alclad: Microcracks in the cladding (x16) p.61
5.3 6013-T6: initiation curve, chamfer hole p.62
5.4 6013-T6: S-N curve, chamfer hole p.62
5.5 Effect of experimental conditions on fatigue behavior of 6013-T6 p.63
5.6 Effect of stress on fatigue behavior of 6013-T6 p.63
5.7 Effect of precorrosion on initiation life of 2024-T3 alclad p.64
5.8 Effect of precorrosion on fatigue life of 2024-T3 alclad p.64
5.9 6013-T6: straight hole versus chamfer (precorrosion) p.65
5.10 6013-T6: straight hole versus chamfer (in ASTM G69) p.65
5.11 6013-T6: S-N curve: Bare materials versus alclad p.66
5.12 6013-T6: Fracture surface of a precorroded specimen p.67 5.13 6013-T6: Fatigue crack initiation from a pit and intergranular corrosion p.67
5.14 6013-T6: Fatigue crack initiation from a pit p.68
5.15 6013-T6: microcrack below the fracture surface p.68
5.16 6013-T6: microcrack emanating from the cladding p.69
5.17 6013-T6: microcrack at the cladding/base metal interface p.69
5.18 6013-T6: 2a versus N curve for as received specimen p.71
5.19 6013-T6 alclad/2024-T3 alclad: R-ratio effect in air p.71
5.21 6013-T6: da/dN curve for as received specimens tested in ASTM G69 p.72
5.22 6013-T6: Stage I crack growth in air p.74
5.23 6013-T6: Stage II crack growth in air p.74
5.24 6013-T6: Stage II crack growth in ASTM G69 p.75
5.25 6013-T6: Stage II crack growth in ASTM G69, muddlike patterns p.75
6.1 6013-T6: number of cycles to initiation/maximum pit depth p.83 6.2 6013-T6: number of cycles to failure/maximum pit depth p.83 6.3 Stress intensity factor at the tip of a semi-elliptical crack as a function of the
aspect ratio when the crack depth is kept constant p.84
6.4 Stress intensity factor at the tip of a semi-elliptical crack as a function of the aspect ratio when the crack diameter is kept constant p.84
6.5 Geometry of a single crack initiating from a hole p.85
6.6 Geometry of a symetric crack initiating from a hole p.85 6.7 6013-T6 alclad: Experimental and calculated propagation lives p.86
LIST OF TABLES
1 Applications of aluminum alloys in the aircraft industry 2 Nominal composition of 6013 aluminum alloy
3 Mechanical properties of 6013 aluminum alloy 4 Solution-potentials of some second phase particles
5 6013-T6: volume fraction of constituent particles 6 6013-T6: particle density
7 Chemical composition of particle 1 8 Chemical composition of particle 2 9 Chemical composition of particle 3
10 6013-T6: ratio of the amount of elements in constituent particles 11 6013-T6: particle and large pit densities
12 6013-T6: pitting depth on the cladding
13 6013-T6: initiation life after precorrosion, chamfer hole 14 6013-T6: Fatigue life after precorrosion, chamfer hole
15 6013-T6: Ratio of initiation life to total life
16 2024-T3: Initiation life after precorrosion, chamfer hole 17 2024-T3: Fatigue life after precorrosion, chamfer hole
18 6013-T6: Limits of the three stages of fatigue crack propagation 19 6013-T6: Experimental and calculated propagation lives (6/G69) 20 6013-T6: Calculated initiation and propagation lives
A.1 A.2 A.3 A.4 A.5 A.6 A.7 A.8 A.9 A. 10 A.11 A.12 A. 13
6013-T6 alclad: Initiation, propagation and total lives (chamfer hole) 2024-T3 alclad: Initiation, propagation and total lives (chamfer hole) 6013-T6 alclad: Initiation, propagation and total lives (straight hole)
6013-T6 alclad: Crack growth rate, as received, R=0.05, in air
6013-T6 alclad: Crack growth rate, precorroded 6 hours, R=0.05, in air 6013-T6 alclad: Crack growth rate, precorroded 12 hours, R=0.05, in air 6013-T6 alclad: Crack growth rate, precorroded 24 hours, R=0.05, in air 6013-T6 alclad: Crack growth rate, as received, R=0.05, in ASTM G69 6013-T6 alclad: Crack growth rate, as received, R=0.33, in air
6013-T6 alclad: Crack growth rate, precorroded 6 hours, R=0.33, in air
6013-T6 alclad: Crack growth rate, precorroded 12 hours, R=0.33, in air 6013-T6 alclad: Crack growth rate, as received, R=0.33, in ASTM G69 6013-T6 alclad: Crack growth rate, as received, R=0.33, in ASTM G69
p.1 3 p.1 5 p.16 p.19 p.29 p.3 1 p.32 p.32 p.32 p.31 p.36 p.4 9 p.5 7 p.58 p.58 p.58 p.5 9 p.81 p.81 p.81 p.91 p.9 1 p.92 p.9 3 p.96 p.9 7 p.98 p.9 9 p.1 0 0 p.1 0 1 p.102 p.103 p.104
ACKNOWLEDGMENT
I would like to express my appreciation to my thesis supervisor, Professor Regis Pelloux for his continuous support and guidance throughout my stay at MIT.
The support of the Federal Aviation Agency (FAA) which provided funding for my research and the support of Alcoa which provided the materials are acknowledged.
I would also like to thank Jin Liang, David Grundy, Kristi Fukami, T.A. Vankatesh and Ann Redsten for their technical assistance.
I. 1 Fatigue damage in aircraft structures
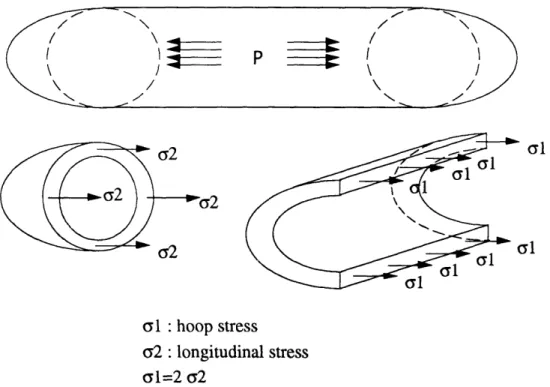
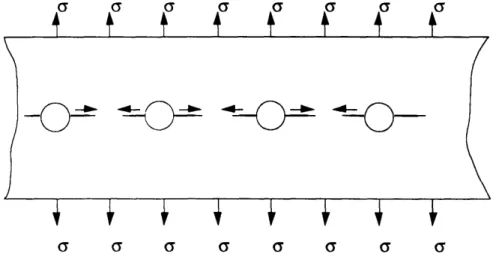
Damage by corrosion fatigue is probably the main structural damage factor that will affect the performance and the life of an airplane. However the severity of the degradation of an aircraft component by corrosion fatigue depends on its location in the airplane structure. Wings are subject to ground to air back to ground (G.A.C) cycles due to landing and take off and to fatigue cycles during the flight, due to the atmospheric perturbations and to plane maneuvers. On the contrary for the fuselage, the combination of a flight and a ground cycle corresponds to one single fatigue cycle. Tensile stresses are induced in the fuselage by the pressurization of the cabin. These stresses are relieved by depressurization during landing. An alternation of pressurization and depressurization constitutes one fatigue cycle. The loading time is typically 15 minutes corresponding to a strain rate of 4.10 -6 sec- with a nominal strain range of 0.25 %. The hold times at
peak stress can vary from 1 hour to 10 hours.
o 1: hoop stress
(2 : longitudinal stress
(1=2 (2
Fig. 1.1: Fuselage modeled as a thin wall pressure vessel
Modeling the cabin as a cylindrical vessel with spherical ends, the highest stress is
circumferential and is equal to twice the axial stress. It is in the order of 100 MPa or 15
ksi.
When corrosion takes place at the same time as fatigue, a synergistic effect is developed between the two degradation processes. Damage is enhanced. Corrosion fatigue is a serious issue for airplanes that are exposed to marine and/or polluted air. This environment is particularly detrimental to the corrosion fatigue performance of airplanes since chloride compounds induce the breakdown of the passive film which covers aluminum alloys and which protects them from the atmosphere.
In case of severe corrosion, fatigue cracks will initiate at each rivet. Since fatigue cracks propagate perpendicular to the direction of maximum tensile stress, the rivets rows, parallel to the axis of the plane, are a weak point in the airplane structure: multiple cracks at each rivet hole can coalesce suddenly to lead to a major failure of the skin.
This has been called Multi Site Damage (MSD)[1] as seen on Fig.1.2:
a
a
a
a
a
a
a
Fig. 1.2: Multi Site Damage (MSD)
The issue of Multi site Damage (MSD) has been emphasized since the Aloha 737 accident. MSD is recognized as a characteristic phenomenon, different from the growth
because the growth and coalescence of interacting cracks is very cumbersome to model: cracks can propagate in a non-collinear manner; the effect of large deformations must be accounted for when the fuselage bulge outwards under the effect of internal pressure; dynamic effects that may be present could enhance the crack driving force for cracks close to stress concentrators and further increase the overall crack velocity; in addition, in the case of a wide open crack, local stresses can be the result of a fluid/structure interaction (air leakage from fuselage); finally, the rapid crack propagation direction can change abruptly from axial to circumferential; in this case the crack arrest straps designed to avoid complete failure of the structure, may not work.
1.2Aluminum used in the aircraft industry
1.2.1 Aluminum alloys classes: different applications
The aluminum alloys used in the aircraft industry essentially belong to the lxxx series (commercially pure aluminum alloys), 2xxx series (Al-Cu-Mg aluminum alloys) and 7xxx series (Al-Zn-Mg-Cu aluminum alloys). Table 1 displays some examples of the applications of these alloys below:
Series Examples Applications
l xxx 1060 cladding
2xxx 2024-T3 fuselage skin
6xxx 6013-T6 fuselage skin / leading edges
7xxx 7075-T6/T8 wing skin / fuselage skin (clad)
7072 cladding [2]
Table. 1: Applications of aluminum alloys in the aircraft industry
1.2.2 Heat treatments: 131
Heat treatment is used in the 2xxx, 6xxx and 7xxx aluminum alloys to develop precipitation strengthening. The heat treatments commonly used in the aircraft industry
are T3, T4, T6 and T8. These heat treatments involve a solution treatment followed by
an aging cycle. T3 and T8 also include some amount of cold work prior to the aging. T3 and T4 designate natural aging whereas T6 and T8 are for artificial aging.
Solution treatment dissolves most of the second phase particles formed by alloying elements. The aluminum alloys are then quenched. Cold work may be used to increase strength. Aging treatments develop strengthening precipitates. Those first to form are usually the Guinier-Preston zones. Further aging leads to the development of other precipitates whose shape, composition and coherency with respect to the matrix may be
different from the initial GP zones. If these precipitates differ from the equilibrium phase, they are called transition precipitates.
I..2.3 Second phase particles
In aluminum alloys three types of second phase particles are commonly observed: constituent particles, dispersoids and fine precipitates, as seen in Fig. 1.3:
I
I fine precipitates I l ' dispersoids::: E:--~ .constituent particles
Fig. 1.3: Second phases in an aluminum alloy
Constituent particles are first to be formed from the melt and contain the natural impurities of aluminum, silicon and iron. In addition, they may also include some alloying elements. Dispersoids are coarse precipitates in the order of micrometers. Fine precipitates are for example, the GP zones whose thickness is in the order of nanometers. During aging heat treatment, these GP zone evolve into other types of precipitates which are responsible for the strengthening of age hardenable aluminum
alloys.
For instance, 6xxx series aluminum alloys are heat treatable medium strength alloys in which Mg2Si is the precipitation hardening phase. In the absence of manganese or
chromium, the iron rich phases are Fe3SiAll2, FeSiAl9 or a mixture of the two. When
manganese or chromium are present, the second phase particles are (Fe, Mn, Cr)3 Si
1.2.4 6013-T6 aluminum alloy
a) Composition
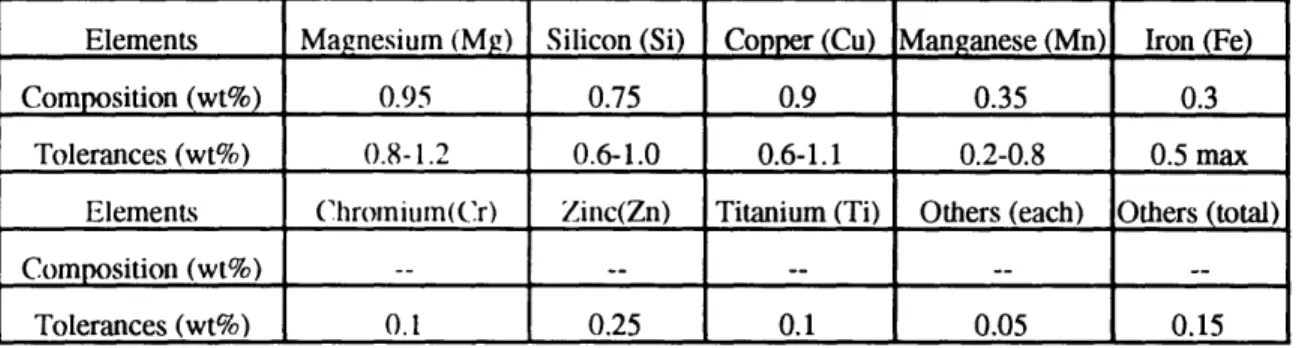
Very few papers have been published about 6013 aluminum alloy. Alcoa introduced this alloy a few years ago and most of the investigations were carried out either by the Alcoa test laboratories or other private labs. According to Alcoa Green Letter 225 [4], 6013
nominal composition and tolerances are as follows in wt %:
Elements Magnesium (Mg) Silicon (Si) Copper (Cu) Manganese (Mn) Iron (Fe
Composition (wt%) 0.95 0.75 0.9 0.35 0.3
Tolerances (wt%) 0.8-1.2 0.6-1.0 0.6-1.1 0.2-0.8 0.5 max
Elements (Chromiumn(Cr) Zinc(Zn) Titanium (Ti) Others (each) Others (total)
Composition (wt%) -- -- -- --
--Tolerances (wt%) 0.1 0.25 0.1 0.05 0.15
Table 2: Nominal chemical composition of 6013 alloy.
b) Phases
6013-T6 is an aluminum copper magnesium silicon alloy. No direct data is available about the strengthening mechanisms. However, alloy 6013-T6 does not fall in the high copper content group described by Mondolfo [5], since the copper content is well below 4 %. The remaining strengthening mechanisms are due to the precipitation of Cu2Mg8Si6All5s CuMgAI2or Mg2Si [5]. In the case of 6013 aluminum alloy case,
Mg2Si is the prevailing precipitate (aluminum-magnesium-silicon). Since iron and
manganese form insoluble phases with copper and silicon [3], they consequently reduce the amounts of copper and silicon available for the aluminum-copper-magnesium-silicon phase reactions. According to Mondolfo [5], the alloying elements can be found in the following phases:
Manganese can be present only as (Fe,Mn)3Si2All5 since the magnesium content is not
reported in [3] and [5] as (Fe,Mn)3SiAll2or as a variant of (Fe,Mn)3Si2All 2.This phase
may incorporate chromium in the iron-manganese sites and copper on the silicon sites. Silicon may be present as Mg2Si, Cu2Mg8Si6Alls, FeSiAl5 and (Fe,Mn)3Si2All 5
mentionned above. But FeSiAl5 which is similar to Fe2Si2Al9 [2] is reported to
transform into (Fe,Mn)3SiAIl2. when Manganese and chromium are present [3]. Cu may
be present as CuMgAI 2 and Cu2Mg8Si6Als.
As a conclusion, the expected phases in 6013-T6 aluminum alloy are Mg2Si, CuMgAl2,
Cu2Mg8Si6Als and (Fe,Mn)3SiA11 2or (Fe,Mn)3Si2Al 12.
c) Mechanical properties
Alloy 6013-T6 has a yield stress 12% higher than 2024-T3 alclad and 25% higher
strength than 6061-T6 as seen in Table 3 [6]. Its density is 3% lower than the density of
the aluminum alloys commonly used in the aircraft industry (2024 and 2014).
Series Example Thickness (mrm) Yield Strength Tensile Strength
lxxx 1060 0.152-0.483 17 MPa 55-96 MPa
2xxx 2024 T3 0.203-6.32 289 MPa* 434-441 MPa *
6xxx 6013 T6 0.5-6.3 317 MPa* 359 MPa *
7xxx 7075 T6/T8 0.203-6.32 434-476 MPa (T6)* 510-538 MPa (T6)*
Table 3: Mechanical properties [6]
Excellent formability was reported in the T4 temper. Consequently, components could be formed in the T4 temper and simply aged to the T6 temper, avoiding costly heat treatments. 6013-T6 alloy is also weldable. In addition, Alcoa claims alloy 6013-T6 is corrosion resistant, but acknowledges that some intergranular corrosion may occur when the alloy is exposed to severe environments such as salt-water. It is expected that the new alloy is probably less resistant than 6061-T6 to intergranular corrosion. However, 6013-T6 has been found to be immune to stress corrosion cracking and exfoliation corrosion.[4]
6013-T6 alclad: Corrosion Fatigue Performance:[71
It is reported [4] that general corrosion in 6013-T6 aluminum sheet follows a narrow intergranular path in salt-water type solutions. 2024 bare alloy exhibits slightly better corrosion fatigue performance than 6013-T6 which suffers from multiple cracking. A large data scatter for 6013-T6 specimens has been reported.
Aluminum Alloy 6013 Sheet for New US Navy Aircraft: r81
6013-T6 aluminum alloy has been selected for the US's navy P-7A airplane in place of the traditionnal 2024-T3 clad sheet. The authors reported that the new alloy has significantly better fatigue performance, toughness, and roughly equivalent fatigue crack propagation resistance than 2024-T3.
1.3. Pitting of aluminum alloys.
Aluminum and its alloys are very active in the electrochemical series. The standard potential of pure aluminum, measured against the Standard Hydrogen Electrode (SHE)
is - 1.662 V at 25°C. The Pourbaix diagram [9] for aluminum shows that alumina (A1203)
is the stable form of aluminum between pH 4 and pH 8 at 25°C. Since alumina is an
insoluble oxide in these environments, it may protect pure aluminum against the corrosive environment (passivity) [1()].
However, aluminum and aluminum alloys are not immune to corrosion in environments containing halide ions, even at pH between 4 and 8. Environments containing chloride ions induce the local breakdown of the oxide film protecting the aluminum when polarizing the metal above a critical potential, called the pitting potential. This well known phenomenon is called pitting. Once initiated, this pitting corrosion process is
autocatalytic and leads to the formation of holes (pits) on the exposed surface.
1.3. 1. Factors influencing pitting initiation:
Pitting initiation is not a well understood phenomenon. Natisham et al [11] attempted to explain the process as due to the adsorption of chloride ions on to the passive film but failed to explain why chloride ions are still adsorbed on the passive film below the pitting potential. It is also proposed [12] that chloride ions interact with the passive film and generate large numbers of metal vacancies which migrate to the metal/oxide interface leading to thinning of the film by vacancy coalescence. The final breakdown would be due to tensile residual stresses. The drawback of this theory is that there is no experimental evidence of these stresses [13]. In addition, some authors have questionned the effectiveness of the protective film in aluminum alloys since experimental evidence of defects have been reported [14]. Thus, most theories are simply based on an intrinsically flawed oxide film.
In 1970, Galvele [15] proposed a model for pit initiation and pit propagation which is based only on transport phenomena. It is assumed that pitting takes place when the local pH in a surface defect reaches a critical value where the environment is able to sustain metal dissolution and prevent further repassivation. The local pH is related to the product of the current density and the defect size. Because the current density is a function of the applied potential, it is shown that pitting initiate at defects of critical size. This theory is extended [ 16] to account for the effect of alloy composition on the pitting susceptibility of aluminum alloys. As before, pitting initiation occurs when a driving force, as measured by the pitting potential, is large enough to sustain a proper level of metal dissolution. The rate of metal dissolution needs to be high enough to create an environment where the oxides of the alloying elements are soluble (acidic environment) and thereby prevent further repassivation.
These models of pitting initiation do not consider the role of chemical defects on the metal surface except as a source of flaws for the passive film. However, numerous experimental evidences of the role of second phase particles in pitting initiation in
aluminum alloys have been reported 17, 18, 19]. These observations can be rationalized
by looking at the corrosion potentials of the matrix and of the second phase particles in aluminum alloys:
Precipitates Potential (V) solid solution Potential (V)
FeAI3 -0.56 2024-T3 -0.69 Si -0.26 7075-T6 -0.83 CuAl2 -0.73 6151-T6 -0.83 Al8Mg5 -1.224 6351-T5 -0.83 MgZn2 -1.05 6061-T6 -0.83 A16Mn -0.85 6063-T6 -0.83
Table 4: Solution potentials of some second phase constituents measured in 53g/L NaCl plus 3g/L H202 solution versus 0.1 N Calomel Electrode [2]
Table 4 displays the potentials of some common intermetallic phases and solution-potentials of some aluminum alloys. Solution potential is essentially the potential of the
electrochemical behavior which constitutes the highest volume fraction [2]. As seen in table 4, the differences between the potentials of the matrix and the second phase particles are significant and will set-up galvanic cells as reported by R.Wei [20] who
observed particles with a cathodic or an anodic behavior with respect to the matrix.
1.3.2. Pit growth
Pit propagation is an auto catalytic process [10, 15, 20]. Once a pit has initiated, chloride
ions migrate into the pit to achieve electrical balance. Further hydrolysis of metal ions acidifies the pit environment and enhances the metal dissolution process. A cap of
insoluble oxides may form at the pit mouth and impede the escape of A13+ ions from the
pit whereas C1- can still migrate inside. This greatly acidifies the pit environment and enhances the dissolution process. The cathodic reaction usually takes place on noble constituent particles for aluminum alloys or in areas away from pits. This model is primarily based on transport of ion species. However, pit propagation can also depend upon factors that are not related to transport phenomena such as grain orientation in pure aluminum. Baumgirtner, et al. [22] reported that the walls of the pits were composed of {001 } facets with <00())1> step edges showing that some facets exhibit higher dissolution rates due to different crystallographic orientations.
1.3.3 Corrosion susceptibility of some aluminum alloy classes [31
At this point, the phenomena of intergranular corrosion, exfoliation corrosion and stress corrosion cracking must be introduced since they share some common physical processes with the pitting process of aluminum alloys. Moreover, these material degradations are responsible for fatigue crack initiation in aircraft structures. Intergranular corrosion is a degradation process where preferential dissolution occurs at grain boundaries. Exfoliation corrosion is a form of corrosion where the attack occurs along subsurface intergranular paths parallel to the surface. Splitting of the structure is
observed since corrosion products have a higher volume than the initial material [2]. Stress corrosion cracking (SCC) is a synergistic process between stress and corrosion where failure occurs under a tensile load in a corrosive environment. G.H.Koch [23] has reported that a corrosive environment may promote fatigue cracking in aircraft aluminum alloys by two mechanisms of stress corrosion cracking: an anodic dissolution mechanism or by hydrogen embrittlement. Anodic dissolution is the mechanism by which cracking occurs by dissolution along grain boundaries. Hydrogen induced cracking is a process by which cracking occurs along grain boundaries that have been weakened by adsorption of atomic hydrogen.
The corrosion susceptibility of some aluminum alloy classes is presented below:
In 2xxx series aluminum alloys, CuAI, or CuMgAl2precipitates readily form along the
grain boundaries, leading to a copper-depleted zone (Al-0.2% Cu) at the grain boundaries when the quenching rate is less than 1000°F/s. Thus, grain boundaries act as
anodes while grain bodies and intermetallic phases CuAI2 act as cathodes. It is shown by
Galvele [24] that intergranular corrosion is due to a difference in pitting potentials between the different zones mentioned earlier. For 2xxx series aluminum alloys, stress corrosion cracking may occur and can be related to a preferential dissolution of some precipitates as in pitting initiation. 2024 aluminum alloy is also subject to exfoliation corrosion.
6xxx series aluminum alloys generally possess good SCC resistance. These alloys are primarily strengthened by the precipitation of Mg2Si particles which are anodic to the
matrix. Some alloys in this series can be susceptible to intergranular corrosion in the T4 and T6 temper. Pitting is the most common mode of corrosion.
7xxx series aluminum alloys can be susceptible to exfoliation corrosion or intergranular corrosion [25]. Stress Corrosion Cracking (SCC) is also a major problem in these alloys. Hydrogen embrittlement [26] has been proposed as the prevailing mechanism, of SCC
1.4. Crack initiation
Crack initiation is dependent upon the scale of observation. In a laboratory environment, the use of replication tape allows scientists to measure cracks shorter than 10m. An optical microscope easily detect cracks of 0.1 mm length. The equipment used in the aircraft maintenance (Eddy current, ultrasonic probes) has again a different resolution. That is why crack initiation depends upon the investigator definition.
1.4.1 Factors influencing crack initiation
a) In air
Microscopic studies of fatigue crack initiation on the well known 2024 aluminum alloys [27] revealed that the cracking mode in air is dependent upon the stress level.: At high stress levels, cracking at coarse slip lines initiating in the matrix is the most likely phenomenon. At low stress levels, constituent particles appear to play a prevalent role by initiating the local coarse slip lines responsible for cracking. A.Zabett and A.Plumtree [28] also observed that most of the cracks initiate from AI7Cu2Fe second
phase particles in 2024-T35 1. In the case of clad aluminum alloys, the pure aluminum layer also plays a role in crack initiation as mentioned by M.E Fine et al [29] who observed microcracking at the interface between the base metal (2024-T3 aluminum
alloy) and the pure aluminum cladding. X.R Wu and J.C Newman [30] also reported that
most cracks initiate in the clad layer of LC9 clad sheet in opposition with the cracking mode of 7075 bare alloy where cracks initiate at particle clusters.
b) Effect of environment
Fatigue crack initiation in corrosive aqueous environments can occur because of the stress concentration created by corrosion induced surface defects such as pits, exfoliation corrosion and intergranular corrosion. The effect of precorrosion on fatigue properties of aluminum alloys has been verified by N.L. Person [31] who reported that
fatigue cracking in smooth bending specimens occurs at pits. In addition, fatigue strengths of heavily pitted (0.2-0.3 mm) 7075-T6 and 2014-T6 bare aluminum alloys are decreased by 60% for long, 108 cycles, fatigue lives. The detrimental effect of intergranular corrosion is also reported for a 7075-T6 aluminum alloy lot. M.E. Fine, et al [29] also noticed that particles and pits have the same detrimental effect on fatigue crack initiation in 2024-T3 aluminum alloy. Moreover, stress corrosion cracking can also initiate defects which are detrimental to fatigue crack initiation [32]. The detrimental effect of corrosion damage on fatigue crack initiation has been reported in aircrafts [33]. S. Suresh [341 also mentioned that fatigue cracking can initiate because of an enhanced irreversibility due to the oxidation of slip steps, a preferential electrochemical attack at region of mechanically broken film and finally because of the reduction in surface energy of the alloy by adsorption of environmental species.
1.4.2 Stress concentration at the bottom of a pit
Since corrosion and fatigue processes tend to occur sequentially rather than concurrently
[35], it is interesting to evaluate the stress at the bottom of a pit located on the inside of a rivet hole. Modeling a pit as an elliptical crack [36], the stress intensity factor at the tip is:
AK= 1.12Ac/
c°
Q
where Ac is the stress range, or is the aspect ratio ( pit depth / pit radius) and Q is the
shape factor, being equal to:
Q = 1+ 1.464 a 1.6 5
If one considers:
- a loading of Ac = 15 ksi or 100 MPa, which is typical of the stress experienced by a fuselage skin.
Then, Q= 2.464 and =l. A( = Aa*kt where kt is the stress concentration factor at the
edge of a hole that is assumed to be located in an infinite plate:
3.0
t
2.0
1.0
-_ +-i-. 1.07 1.03
D/2
D.
-
2 D-
-Fig. 1.4: Stress distribution near a hole in an axially loaded plate [36]
From Fig. .4, kt can be deduced to be around 3 since 50 pm is 1/80 of the diameter.
Taking kt = 3, one finds:
AK = 2.68 MPalm
This stress intensity factor is of the order of the crack propagation threshold of most aluminum alloys . Therefore a 50 pm deep pit can initiate a fatigue crack under a stress range of 100 MPa.
1.4.3 A model of fatigue crack initiation life based on pit growth
Kondo [36] has observed that the corrosion fatigue process consists of three phases: pit growth, crack formation from the pit and fatigue crack propagation. In fact, he described corrosion fatigue as a competition model between pitting corrosion and crack propagation for low alloy steel in 90°C deionized water. Measurements showed that pit radius followed a power law of exponent 1/3. Kondo assumed that transition from a pit
to a crack occurs when the fatigue crack growth rate exceeds the pit growth rate. Modeling a pit as a elliptical crack, the equivalent stress intensity factor is given by [36]:
AK= .12A
u
tc
Q
If AKp is the critical experimental value for which the fatigue crack growth rate exceeds the pitting rate, one can calculate the critical pit radius at which transition from pitting to
fatigue cracking takes place:
I= AKp 2 Ccr 7a 1. 12 a]Y cq4 ur, e-
:
o Time log (t)Fig. l.5: Residual life prediction of crack initiation based on quantitative evaluation of pit[36]
Kondo's model for crack initiation life may be useful for airplane maintenance programs since it can predict the residual life before fatigue crack initiation just by measuring the
1.5.1 Parameters affecting fatigue crack propagation
Some parameters influencing the different regimes of crack growth are presented below: Region I (near threshold regime): crack growth rate is very sensitive to microstructural effects, load ratio effect (R-ratio) and environmental effects. An increase in the load ratio or the presence of a corrosive environment shifts the da/dN curve up.
Region II (Paris regime): Load ratio effect and microstructural effects are low. On the contrary, some combinations of environment and frequency can be very detrimental. Region III (fast crack propagation regime): Microstructural and load-ratio effect are very
important. Environmental conditions do not play a role since the crack growth is too fast
for corrosion to take place.
This rapid presentation of the problem aims at pointing out the complexity of corrosion
fatigue which involves a huge number of parameters and physical processes, such as the
transport of embrittling species to the crack tip, the pumping of the environment by the crack opening and closing of the crack walls, crack closure and finally fretting [34] All these physical phenomena are in turn influenced by the conditions of mechanical loading.
1.5.2 Physical and chemical processes involved in corrosion fatigue crack propagation A corrosive environment can alter crack propagation by two different types of processes. The first one acts through purely mechanical defects. Crack propagation can be affected by pitting corrosion, exfoliation corrosion or intergranular corrosion. For instance, J.P Chubb, et al [35] studied the effect of prior exfoliation corrosion on the fatigue behavior of 7178-T6 and 2024-T351 aluminum alloys. He observed that exfoliation corrosion increases crack growth rates in 7178-T6 while no effect is apparent on 2024-T351. A corrosive environment may also affect crack propagation through chemically induced processes. For example, hydrogen embrittlement [38] creates weak points at grain boundaries, precipitate interfaces and dislocation cores and is very detrimental when
occuring at the fracture site. This mechanism of corrosion fatigue was proposed by Smith et al [39] (cited in [23]) for 7075-T6 aluminum alloy. However, G.H. Koch [23] outlined that hydrogen embrittlement may not apply to other aluminum alloys.
Film rupture and anodic dissolution is a process by which crack advance occurs during transient anodic dissolution of metal at locations where the film has been mechanically broken [33]. Anodic dissolution and plasticity have also been associated to explain corrosion fatigue by the elimination of work-hardened metal and the stimulation of
localized plastic deformation [401. Adsorption of atoms on slip bands has been proposed
to reduce the slip reversibility and enhance crack growth rates.
In reality, both chemical processes and corrosion induced mechanical defects contribute to corrosion fatigue crack propagation. In addition, corrosion may be affected by cyclic loading.
1.5.3 Models of corrosion fatigue crack propagation [34.381
One idea developed over the last twenty years, is to consider the different combinations
of crack growth rates measured under purely mechanical fatigue and versus a purely stress corrosion condition.
The models can then be divided into two categories. The first is the superposition approach where crack growth is determined by linear superposition of the crack extension rates due to the different mechanisms (purely mechanical loading, purely stress corrosion, true corrosion fatigue...). The major drawback of this model is that it does not account for the interaction between the mechanisms of crack extension. In fact, the proposed mechanisms probably do not form an orthogonal basis. However, it can be used to explain the observed shape of the da/dN curve. Some weights can be used in the linear superposition to adjust the shape. However, these weights are empirical and cannot be determined from microstructural variables or the environmental composition.
The second category is to consider that the proposed mechanisms are mutually competitive and that the crack growth rate is determined by the fastest mechanism available. Again, the synergistic effect are difficult to incorporate into the model.
In addition, some attempts have been made to develop models based on crack-tip mechanics rather than on stress intensity factor only. Some authors have also taken interest in developing models for the occluded crack chemistry which is undoubtedly different from the bulk and consequently plays a prevailing role in fatigue corrosion crack growth [38].
As a conclusion, most of the life prediction models rely heavily on empirical data (da/dN curves) that are used to integrate the fatigue life from an initial crack size to the
II. Microstructural Characterization of 6013-T6 alclad aluminum alloy
The as-received material is a 6013-T6 alclad sheet supplied by Alcoa. Its dimensions are 48"x60"x0.045". The average micro hardness is 133.5 HV.
II. 1 Second phase particles
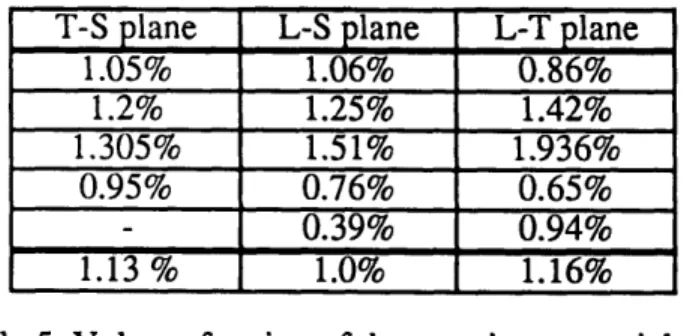
Cross-sections were cut parallel to the three principal planes, T-S, L-S and L-T, where L is the rolling direction, S the sheet thickness and T the transverse direction, perpendicular to S and L. Samples were mounted and polished down to 0.05 ILm with alumina slurries. They were then examined unetched with an optical microscope. A cross-section of the base metal is displayed in Fig.2.1. Constituent particles and dispersoids can be observed. Constituent particles appear light gray. Some are script like. Others are elongated in the rolling direction. Some are broken or form clusters. The volume fraction of the constituent particles is measured using two methods: the point count and an image processing technique. The point count method gives a volume fraction of 1.62+0.1% with 95 % confidence limits as determined using the Dehoff
method[42]. It is measured using a 10x10 grid placed at random location 5 times on each
of the 8 micrographs under consideration.
T-S plane L-S plane L-T plane
1.05% 1.06% 0.86% 1.2% 1.25% 1.42% 1.305% 1.51% 1.936% 0.95% 0.76% 0.65%
_- _0.39%
0.94%
1.13% 1.0% 1.16%Table 5: Volume fraction of the constituent particles as calculated with an image processing technique.
The image processing technique calculates a volume fraction of 1.1 %. The surface fractions are calculated on three different planes. Table 5 displays the results. It must be noted that these last values underestimate the real volume fraction since some
Fig.2.1: 6013-T6 aluminum alloy. Unetched (xl000).
Gray constituent particles and fine dispersoids can be seen
T
procedures of the image processing erode or erase particles. Particle densities are
displayed in table 6:
T-S plane L-S plane L-T plane
73646 part/cm- 2 79537 part/cm-2 58916 part/cm-2
79537 part/cm-2 85429 part/cm-2 50079 part/cm- 2
70700 part/cm-2 100158 part/cm-2 76591 part/cm-2
85429 part/cm-2 58916 part/cm-2 47133 part/cm-2
61862 part/cm- 2 41242 part/cm-2 61862 part/cm-2
74234 part/cm-2 73056 part/cm-2 71289 part/cm-2
Table 6: 6013-T6: Particle density
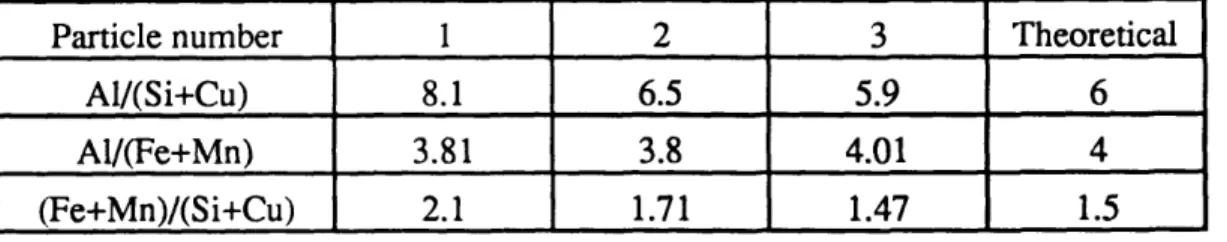
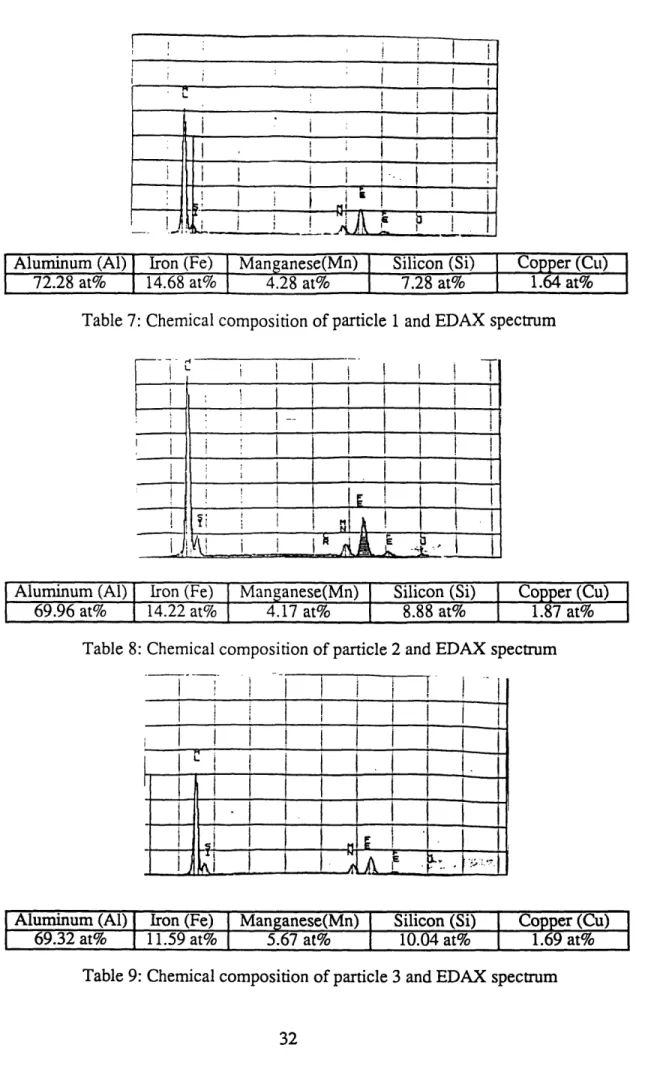
EDAX analysis of the constituent particles shows a content of aluminum, silicon, manganese, copper and iron. Magnesium is not detected. The results are displayed in
tables 7, 8 and 9. According to [2], they may be (Fe, Mn)3Si2A11 2 type particles. Indeed,
for these three particles, table 10 shows some ratios which are in accordance with the chemical composition of (Fe, Mn)3Si2A11 2particles.
Particle number 1 2 3 Theoretical
Al/(Si+Cu) 8.1 6.5 5.9 6
A1/(Fe+Mn) 3.81 3.8 4.01 4
(Fe+Mn)/(Si+Cu) 2.1 1.71 1.47 1.5
Table 10: Ratios of the different amount of elements (expressed in atom percent)
The difference between the experimental and theoretical values can be explained by two factors. The first is due to the x-ray beam that may analyze some of the surrounding matrix when the particles are too small. The second factor is due to the mix of
-Aluminum (Al) Iron (Fe) Manganese(Mn) Silicon (Si) Copper (Cu)
72.28 at% 14.68 at% 4.28 at% 7.28 at% 1.64 at%
Table 7: Chemical composition of particle 1 and EDAX spectrum
Aluminum (Al) Iron (Fe)
I
Manganese(Mn) Silicon (Si) Copper (Cu)69.96 at% 14.22 at% 4.17 at% 8.88 at% 1.87 at%
Table 8: Chemical composition of particle 2 and EDAX spectrum
I . I ! !- i
-i
I ! i I I
i i I i I I I L
i I 1 I I: 1
Aluminum (Al) Iron (Fe)
I
Manganese(Mn)I
Silicon (Si) I Copper(Cu)69.32 at% 11.59 at% 5.67 at% 10.04 at% 1.69 at%
Fig.2.3: Optical micrograph of a 6013-T6 alclad aluminum alloy sheet cross-section. Etched with Keller's reagent.(x330)
Fig.2.4: Optical micrograph of a 2024-T3 alclad aluminum alloy sheet cross-section Etched for 3 minutes in an aqueous solution containing 2g NaOH and 5g NaF (x330)
The dispersoids and precipitates are probably Mg2Si, Cu2Mg8Si6Al5 and CuMgA12as
seen in chapter I. No EDAX analysis was carried out because of the dimensions.
II.2 Grain Size
Grain size is recorded by metallographic examination of 6013-T6 alclad sheet sections in T-S, L-T and L-S planes. Specimens are mounted and mechanically polished with silicon carbide paper down to 5 im. Afterwards, 1, 0.3 and 0.05 m grades alumina slurries are used. After ultrasonic cleaning, the sections are etched with Keller's reagent by swabbing for two minutes. Micrographs of the sections are taken at random location on two samples. Grain size was measured using the linear intercept method. This gives
to an average grain size of 19 x 25 m on both L-S and T-S planes, the grains being
slightly elongated in the rolling direction. Grains in the L-T planes are slightly larger indicating that the overall grain shape was flattened in the rolling plane as expected. As a comparison, 2024-T3 grains are significantly elongated with a dimension of 60x25 nm. This probably accounts for a better performance of 6013-T6 in stretch-forming operations as reported in [7] and [8]. A perspective view of aluminum alloy 6013-T6 sheet can be seen in figure 2. Fig.2.3-2.4 show the difference between the grain texture of 2024-T3 and 6013-T6 aluminum alloys.
11.3 Cladding
Samples of the sheet are cut along the T-S and L-S plane, mounted and polished down to 0.05 pgm with alumina slurries. After ultrasonic cleaning, samples are etched with Keller's reagent by swabbing for two minutes. Cross-sections are examined with an optical microscope. The base metal is etched and the cladding did not exhibit any form of attack. Then, the cladding thickness is calculated by measuring the unattacked part of the sample. The cladding thickness is 60-70 pmun on each side. This represents roughly 10 % of the total thickness which is 0.045 inches or 1.143 mm.
III. 6013-T6 alclad and 2024-T3 alclad: corrosion performances in ASTM G69 III1.. Experimental Procedures
III. 1.1 Solution-potential (ASTM G69)
Samples are cut parallel to the L-T plane. On one side, a nickel wire is pasted with silver
paint for electrical contact. When the silver paint is dry, the contact is covered with glue. Then, the assembly was cold mounted. The side opposite to the wire is directed outward. After curing, grinding is used to remove the aluminum cladding. The sample is polished
down to 0.05 .tm with alumina slurries and cleaned in an ultrasonic bath. Afterwards, a lacquer is applied around the specimen to seal and prevent crevice.
The solution-potential of 6013-T6 aluminum alloy is measured using ASTM G69 [43]. One liter of ASTM G69 consists of 58.5+0.1g of NaCl and 9±1mL of H202at 30%.
III.1.2 Corrosion tests a) Samples Preparation
In this study, samples are cut from either from 6013-T6 or 2024-T3 alclad aluminum alloy sheets. Their dimensions are lxl cm. They are cold mounted in order to polish one side to 0.05 m grade with alumina slurries. They are cleaned in an ultrasonic bath for 15 minutes to remove any particle that might have been embedded in the matrix during the polishing stage. After, the samples are taken out of the bakelite and cleaned in acetone.
b) Experimental Set-Up
After preparation, the specimens are immersed in a beaker containing 2 liters of ASTM G69. Samples are held with a plastic mounting clip. The surface under study is facing upwards. During the whole experiment, a pump aerates the solution. The solution is changed every 2 hours for the first 12 hours to keep the hydrogen peroxide level high.
The solution pH is measured before and after changing. The experiments are carried out at room temperature.
I.2. Results
111.2.1 Solution-potential
The measured solution-potential is -741 mV versus a Saturated Calomel Electrode (SCE) at 25°C. 92 mV must be subtracted from the previous value to convert to the standard of 53g/L of NaCl with 9 mL of H202 . measured against a 0.1 N calomel electrode [43]. This gives -833 mV, which is in good agreement with the literature,
which gives a value of -830 mV for the 6xxx series in the T6 temper [2].
111.2.2 Pit Morphology
Two types of pits are observed. The first consists of large pits (Fig.3.2-3.4). The latter are roughly hemispherical, at least before they coalesce with neighboring pits. Low magnification micrographs clearly show that pits initiate around constituent particles (Fig.3.2-3.3) at short times. In addition, particle density correlates well with the density of these large pits, after 30 minutes immersion in ASTM G69, as seen in the table:
Density: number/cm-2 Pits Particles
52690 73646 72594 79537 59715 70700 54797 85429 61862 79537 85429 100158 58916 41242 Average 60886 73646 Standard Deviation 8389 16548
Since these particles appear to be unaffected by the solution, it can be assumed that they are cathodic to the matrix. At longer immersion times, constituent particles cannot be seen except in some pits where the pit cavity has reached a second layer of constituent particles. The shallow shape of the pits may be explained by the small potential
difference between the constituent particles and the matrix.
High magnification micrographs show some pits in the order l1m. These are probably due to dispersoids. There is a preferential pitting along grain boundaries which leads to an intergranular type damage as seen after 6 hours. The edges are clearly defined and the surrounding matrix is not attacked (Fig.3.6). No particle is detected. This proves that this pitting process is due to precipitates which are anodic to the matrix (if due to precipitates). In this case, the particles that can be involved are either Mg2Si or excess Si, since their open circuit potential is less noble than pure aluminum (6xxx series). One must mention some dark spots in Fig.3.4. These are probably not yet growing pits: some dissolution takes place and darkens the surroundings of some precipitates. For the first six hours, the overall pit density increases linearly with time as shown in Fig.3.7. After, it is difficult to define a pit density, since some localized intergranular corrosion occurs as mentioned earlier. In addition, evidence of this intergranular corrosion is given by examination of the cross-sections, where a very narrow intergranular corrosion is detected (Fig.3.8). At the transition cladding/base metal, no specific form of corrosion is reported.
Metallographic cross-sections show that the pit density is lower in 2024-T3 alclad than in 6013-T6 alclad. Pits are narrow and deep. Some intergranular corrosion is associated very often with the deepest pits (Fig.3.9-3.10)
Fig.3. 1: Optical micrograph of 6013-T6 aluminum alloy. As received, unetched (x300)
Fig.3.3: SEM micrograph of 6013-T6 aluminum alloy. 1 hour in ASTM G69 (x300)
Fig.3.5: SEM micrograph of 6013-T6 aluminum alloy. 1 hour in ASTM G69 (x1710)
Fig.3.6: SEM micrograph of 6013-T6 aluminum alloy. 6 hours in ASTM G69 (x1710)
111.2.3 Pit depth
Pit depth is recorded through metallographic examination. The samples are cross sectioned at random locations and polished. The pit depth was taken as the measured value on the cross-section. It must be noted that this measurement cannot represent the true pit depth since a pit is a three dimensionnal defect and a random cross section does not intersect the bottom of each pit. However, since the maximum pit depth is the point of interest, 10 samples were examined for each immersion time and the maximum depths recorded. In Fig.3.11-3.12, pit depth frequency is displayed. It can be seen that
the distribution extends to the deep pits at large times, as expected.
On the graph showing the maximum pit depth (Fig.3.13), each point represent the maximum pit depth recorded for one set of samples tested together in the same solution. The data shows some scatter that can be due to:
- Measurement accuracy since the cross-sections may not intersect the maximum depth of the deepest pits.
- Environment fluctuations such as temperature and solution composition. ASTM G69 solution is difficult to control because of the hydrogen peroxide which decays upon standing. In addition, the ASTM specifications are 9±1 mL which may not be accurate enough.
However, the time dependence for 6013-T6 aluminum alloy is found to be a power law of exponent 0.37 which is not irrelevant when compared with the corrosion data found
in the literature which reports an exponent of 0.33 [43].
For 6013-T6 alclad, no significant difference in maximum pitting depth on the different orientations was recorded. This can be explained by the equiaxed structure of the grains.
6013 T6 in ASTM G69
Overall pit density as a function of time 4.0 106 C 3.5 106 'r 3.0 106 o . 2.5 L06 ' 2.0 106 ., 1.5 106 1.0 106 5.0 1{)5 0 Fig.3.7: Overall 0 1 2 3 4 5 6 7 Time (hours)
pit density for 6013-T6 aluminum alloy immersed in ASTM G69
Fig.3.8: 6013-T6 alclad aluminum alloy sheet cross-section. The specimen was scratched prior to a 60 hour immersion in ASTM G69. Intergranular corrosion follows a
verq narrow path. (x1000)
I I I I . I - - -..- y = -1.2323c+05 +.6.6964e+.5t (R= 0.99236 ) . j A ... L·... ... ... -- I ... 7 I7 -.--- 7----!... i I/
../i
... ... ... ... _ wt ... /L..C... ... / . . .,. . . . . i L{I" _ __ _... ... ... I... ... ... ... ... ... ...-... ...-... ---......-" t. t ·z 1-·;. r t P Z r 7 ,, ,p 'i
lig.3.9: Optical micrograph of 6013-T6 alclad aluminum alloy. Cross-section of the T-S
plane. Corroded 6 hours in ASTM G69 (x200)
4·
I
Fig.3.10: Optical micrograph of 2024-T3 alclad aluminum alloy. Cross-section of the T-S plane. corroded 6 hours in ASTM G69 (x200)
r -: 0
-k ;' __ -4 _
0.54 >, 0.40 L 0.27 0.13 3 6 9 12 15 18 21 24 27 30 33 Pit Depth (m)
Fig.3.11: 6013-T6 alclad: Pit depth frequency after one hour immersion in ASTM G69
0.6 0.5 0.4 Ut 0.3 0.2 0.1 IL l LL II I L LLL 6 9.6 13 17 20 24 28 31 35 Pit Depth (m)
Fig.3.12: 6013-T6 alclad: Pit depth frequency after six hour immersion in ASTM G69
T XI l Tm I..T-rr. ' i . I . n .... ... -- -rm ---- -- .rr ... I I I I l enrpes DIpp L L L / ... ... ... ... ... ... ... I ... i... ...M9MM gm mt mmi :----I
100 10 I _~~~ r Q...6.01T6 .... . . * ~
_
2024 T3 Alclad : y = 39.847 * t(0.27238) (R= 0.9657 ) 6013 T6 Alclad : y = 9.3704 * t(0.38716) (R= 0.9003)--- Maximum Pit Depth 6013 T6 Alclad
---- Maximum Pit Depth 2024 T3 Alclad T-S plane
* Maximum Pit Depth 2024 T3 Alclad L-S plane
I I ., I I I I I I . . I . I
10 100
Time (hours)
Fig.3.13: Maximum pit depth as a function of immersion time in ASTM G69 solution
U.4 0.35 0 U E! 'o L~ 0.3 0.25 0.2 0.15 0.1 0.05 0 5 10 15 Time (hours) 20 25 30
Fig.3.14: 6013-T6 alclad: Pit area fraction on T-S and L-S plane as a function of the .5
I
-o .-0 :2 .E . . . . ~.,. _ · · · l i j i 1For 2024-T3 alclad, a significant difference is observed between the T-S plane and the L-S plane, the T-S plane being the worse. Since pitting is associated with some
intergranular corrosion, the preferential pitting on the T-S plane may be explained by a higher number of grain boundaries in the T-S plane.
III.2.4 Pit Area Fraction
Pit Area Fraction exhibits a logarithmic dependence with time (Fig.3.14). An attempt to correlate the pit area fraction with a power law gives an exponent of 0.37 but the correlation is unsatisfactory. In fact, the pit area fraction is mostly due to the large pits seen in Fig.3.2-3.4. These do not grow laterally too much as seen on the pit area distributions of Fig.3.15-3.16. Some Pits grow by coalescence rather than by a true lateral growth. The cathodic protection provided by the cladding may explain this logarithmic dependence.
111.2.5 Aluminum cladding:
An EDAX analysis shows that the cladding is pure aluminum. However, pits develop in a clear crystallographic manner as in pure aluminum (Fig.3-18). Bands of shallow square pits oriented along the rolling direction are observed (Fig.3-17). In the cross-sections, pits are observed on the whole thickness. Pitting kinetics is difficult to establish due to a surface processing problem. In fact, one side of the cladding is preferentially corroded. After eliminating the experimental bias, the cladding is slightly polished on both sides and the sample is immersed again in ASTM G69. In this case no selective attack is found. The cladding thickness is measured after polishing and gives a thickness of 48-60 g±m to compare with an initial thickness of 60-70 gm, demonstrating that the cladding remains after polishing.
70.0 60.0 50.0 40.0
i&
30.0
20.0 10.0 0.00 Fig.3.15: 6013-55.0 44.0 U U.I 9' rrt 33.0 22.0 11.0 0.00 0 375 750 1125 1500 1875 2250 2625 Pit Area (#m2 )r6: Pit area distribution after one hour immersion
3000
in ASTM G69.
0 375 750 1125 1500 1875 2250 2625 3000
Pit Area 4m2)
Fig.3.16: 6013-T6: Pit area distribution after six hour immersion in ASTM G69.
I
i i i i . . . . . . . i Ii... . ... ... ... ...
Fig.3. 17: 6013-T6 alclad aluminum: Cladding after 12 hour immersion in ASTM G69 Crystallographic pitting has occured along the rolling direction (x70)
Fig.3.18: 6013-T6 alclad: Cross-section corroded for 6 hours in ASTM G69. Pitting in the cladding is clearly crystallographic (xl 1800)
To measure pit depth, the samples are cross-sectioned perpendicular to direction since the pits are along this direction. Table 12 displays the results:
the rolling
Immersion times 6 hours 12 hours 18 hours 24 hours
15.1 21.2 18.1 18.1 18.1 21.2 24.24 15.1 9 21.2 21.2 18.1 19.7 15.1 27.2 22.7 6.1 12.1 33 15.1 27.2 18.1 6 Pit Depth (m) 18.1 3 21.2 4.54 30.3 24.2 18.1 24.2 12.1 35 Mean 13.6 19.67 20.34 18.7 Maximum 19.7 21.2 30.3 35
Table 12: 6013-T6: Pitting depth recorded on one side of the cladding
On the contrary, observation of electrochemical behavior of 2024-T3 alclad aluminum alloy is quite different. General dissolution of the cladding is seen as expected in this kind of material. However, cross-sections of the base metal show some pits which are usually associated with exfoliation type corrosion and precipitates. They are very rare but deeper than in the case of 6013-T6 alclad. Comparison with unclad material clearly show the effect of the cladding on the pitting behavior. In unclad 2024-T3, pits are more numerous, bigger and broader.
IV. 1. Experimental procedures for corrosion fatigue experiments IV.1.1 Sample geometries
All specimens are machined from as received 6013-T6 alclad sheet in the TL
orientation: the tension axis is perpendicular to the rolling direction and is in the plane of
rolling. This is the orientation of aluminum sheets used in the aircraft industry. specimen geometry is based on a rectangle of dimensions 6x3x0.045 inches. At each end, grip attachment is provided by a row of 1/4 inch diameter through-holes.
a) Specimens designed for the study of crack initiation
The specimen geometry is displayed in Fig.4.1. Centered holes with and without countersink are investigated. Their diameter is 0.159 inches or 4.03 mm, which is standard for a aircraft rivet hole. The hole cross-sections are displayed in Fig.4.2. A smaller gage width is machined in order to insure crack initiation at center holes thus
preventing failure at the grip holes.
· _
__ 1 00 ,.
EJJ4.03F1
Countersunk hole (mm)
H-H-Hf~I--i--+
" 4.03"
Straight shank hole (mm)
Fig.4.2: Hole geometries of specimens designed for the study of crack initiation.
The walls of the center hole are polished mirror-like with diamond paste (lgm grade). This procedure insures against surface defects from machining which could interfere
with the study of the surface condition effect. Also, the surface around the hole is
polished to detect the early stages of crack initiation. However, it is almost impossible to
remove the machining marks on the countersunk.
b) Specimens designed for the study of crack propagation
The samples are machined on the base of Center Cracked Tension specimens (CCT). At the center of the plate, the 1/8 inch hole is extended by two sawcut (jeweler saw) notches on both sides, such that the total notch is perpendicular to the tensile axis and is about 0.5 inches long. Its width is around 0.03 inches. This facilitates crack initiation. The
geometry is shown in Fig.4.3.
IV.1.2. Experimental set-up a) Crack initiation
A model 1331 Instron is used to perform the fatigue test using a sine wave form. The tests are carried out at 10 Hz. An R-ratio of 0.05 is chosen since it represents the real load ratio undergone by aircraft fuselage skins. Stress ranges of 100, 120, 140 MPa are used for countersunk hole specimens and 100, 120, 140, 170 and 220 MPa for open straight hole specimens.
Crack initiation is defined as the number of cycles necessary to grow a crack of a given length (0.4 mm for chamfer hole and 0.5 mm for straight hole). Crack initiation is monitored with a travelling microscope (Fig.4.4) on one side of the sheet and a
magnifying glass on the other side.
b) Crack propaation
As for crack initiation, an Instron 1331 is used for fatigue testing. The experiments are run with a sine wave and a frequency of 10 or 0.1 Hz.
Two R-ratios are applied, namely 0.05 and 0.33. As mentioned earlier, 0.05 is the load ratio experimented in service flight by fuselage skins. 0.33 is chosen to investigate the influence of an overload on crack growth rates. At R=0.05, the minimum and maximum loads are respectively 0.035 KIP and 0.7 KIP. At R=0.33, the minimum and maximum loads are respectively 0.333 and 1 KIP. With an average cross-section of 0.13 inches, the equivalent stresses were 1.72-34.5 MPa for R=0.05 and 16-48.5 MPa for R=0.33.
Once a crack is initiated, the crack length is measured using a traveling microscope without stopping the test. The measurement is done periodically by moving the microscope from one crack tip to the other. At high crack growth rates, the test is
stopped during the measurement for accuracy.
c) Tests run in solution
Some tests are run in ASTM G69 to evaluate the effect of active corrosion on both crack initiation and crack propagation. A clear plastic chamber with an open top and slot at the bottom is attached to the specimen using silicon rubber cement. Crack initiation and
3.0
SCALE = 1:1
DIMENSIONS ARE IN INCHES TOLERANCES ARE 0,050
UNLESS SPECIFIED OTHERVISE
N A .- J I I 159 N rI L .R
NOTE A: 00.159' 0005 THRU
30 HES ERWISE 0.040 IN Fig.4.3 CCT specimens - -YJ V·J * * "' V 'a ' a' uJ(
- Load Cell r Measurement Dial Grips Strobe Intake Travelling Microscope Frame (Attached to Load Frame) Grips Actuator on Adjust Scale Approx. 1.4
HOLES
NOTCH
40
°
40
©~
© ©"
CLEAR PLASTIC BOX
(OPEN TOP) 0.125 THICK \WALLS -I7 2 2.5 z ~Y C 1.0 3 1/16 x 1/16 SLOT THRU - SEALED . BOTTOM CENTER CCT SPECIMEN
DIMENSIONS ARE IN INCHES
SCALE: APPROX. 11
Fig.4.5: Set-up for tests run in ASTM G69
CIR I Fr _-
I
- I / ,5, 1 I II I II I I I I II I I I --IV. Experimental results of corrosion fatigue experiments
V. 1. Crack initiation
Because of the cladding softness, extensive deformation takes place around the hole causing difficulty in detecting the main crack when its length was less than 0.4-0.5 mm. In fact, the cladding is covered by lines which appeared black under the strobe light and can be mistaken as cracks (Fig.5.1-5.2). Moreover, some cracks initiate around the hole and stop propagating: since crack initiation is defined as the length of the crack which will lead to complete fracture, some intrinsic uncertainties remain.
In addition, it is difficult to detect cracking with the magnifying glass. For a chamfer hole, this is not a problem since fatigue cracking always initiates at the countersink (the crack is seen propagating along the countersink after initiation on the other side for all cases).
Results are displayed in Appendix 1. For the chamfer hole case, accuracy in the number of cycles is evaluated to 1,000 cycles. This represents 3% of the initiation life. The effect
on the propagation life is worse since it can reach 10%.
IV. 1.1 Effect of precorrosion
a) 6013-T6
Precorrosion has a strong initial effect since initiation lives are reduced by a factor of 2
as seen in table 13. Table 14 displays the reductions in total fatigue lives. Extending the
precorrosion time does not strongly affect the initiation and propagation lives in the limits of accuracy.
Stress range As received/ in 6/G69 in 12/G69 in 24/G69 in As received in
air air air air G69
100 MPa 100% 49.1% 41.7% 46.0% 21.1%
120 MPa 100% 60.1% 42.5% 41.2% 25.1%
140 MPa 100% 48.2% 40.1% 48.6% 28.5%
![Table 3: Mechanical properties [6]](https://thumb-eu.123doks.com/thumbv2/123doknet/14500165.527684/16.918.120.778.602.752/table-mechanical-properties.webp)
![Table 4: Solution potentials of some second phase constituents measured in 53g/L NaCl plus 3g/L H202 solution versus 0.1 N Calomel Electrode [2]](https://thumb-eu.123doks.com/thumbv2/123doknet/14500165.527684/19.918.110.767.776.920/table-solution-potentials-constituents-measured-solution-calomel-electrode.webp)
![Fig. 1.4: Stress distribution near a hole in an axially loaded plate [36]](https://thumb-eu.123doks.com/thumbv2/123doknet/14500165.527684/24.918.259.628.207.497/fig-stress-distribution-near-hole-axially-loaded-plate.webp)
![Fig. l.5: Residual life prediction of crack initiation based on quantitative evaluation of pit[36]](https://thumb-eu.123doks.com/thumbv2/123doknet/14500165.527684/25.918.249.655.309.676/fig-residual-prediction-crack-initiation-based-quantitative-evaluation.webp)