HAL Id: hal-01587868
https://hal.archives-ouvertes.fr/hal-01587868
Submitted on 14 Sep 2017
HAL is a multi-disciplinary open access
archive for the deposit and dissemination of
sci-entific research documents, whether they are
pub-lished or not. The documents may come from
teaching and research institutions in France or
abroad, or from public or private research centers.
L’archive ouverte pluridisciplinaire HAL, est
destinée au dépôt et à la diffusion de documents
scientifiques de niveau recherche, publiés ou non,
émanant des établissements d’enseignement et de
recherche français ou étrangers, des laboratoires
publics ou privés.
Estimating Vocal Effort from the Aerodynamics of
Labial Fricatives: A Feasibility Study
Yohann Meynadier, Anita Hajj, Michel Pitermann, Thierry Legou, Antoine
Giovanni
To cite this version:
Yohann Meynadier, Anita Hajj, Michel Pitermann, Thierry Legou, Antoine Giovanni. Estimating
Vocal Effort from the Aerodynamics of Labial Fricatives: A Feasibility Study. Journal of Voice,
Elsevier, 2018, 32 (6), pp.771.e15-771.e24. �10.1016/j.jvoice.2017.08.010�. �hal-01587868�
ESTIMATING VOCAL EFFORT FROM THE AERODYNAMICS OF LABIAL FRICATIVES:
A FEASIBILITY STUDY
Yohann Meynadier1, Anita El Hajj1, Michel Pitermann1, Thierry Legou1, Antoine Giovanni12 1
Aix Marseille Univ, CNRS, LPL, Aix-en-Provence, France 2
Assistance Publique - Hôpitaux de Marseille, CHU Timone Adultes, ORL, Marseille, France Email : yohann.meynadier@lpl-aix.fr
Journal of Voice, published online, 12 Sept 2017 doi: http://dx.dio.org/10.1016/j.voice.2017.08.010
KEY WORDS
airflow resistance; vocal effort; fricative consonant; vowel; method
ABSTRACT
Objective and Hypothesis: Vocal effort in loud voice is produced with increased subglottal pressure during vowels and increased supraglottal pressure during consonants. In the paper, our main objective is to check whether it was supported by a parallel increase in the airflow resistance of the laryngeal articulator and of the supralaryngeal articulator, here the lips. Study Design and Method: For this comparison, our choice fell on the fricative consonants, as their production allows perfectly synchronous air pressure and airflow measurements. Also, the calculation of the real instantaneous aerodynamic resistance is possible with fricatives - as it is with vowels - whereas it is not possible with plosives. The present feasibility study on a healthy subject is based on direct subglottal and intraoral pressures and airflow measured for /f/ or /v/ and from the contiguous vowel produced in VCVCV non sense words at different levels of intensity. Results and Conclusion: The results support that the airflow resistances at the lips and that at the larynx are quite parallel. The airflow resistance at the lips during labial fricative production could provide a good picture of the laryngeal resistance during the production of continuous speech. This suggests clinical applications using both non invasive inferred measurements of subglottal pressure variation and direct non inferred airflow measurements from more natural speech production tasks.
1
INTRODUCTION
Vocal fold pathologies responsible for voice disorders represent a public health issue in developed countries, especially among teachers, and many other professions [1][2][3][4][5].These pathologies are due to the inflammation of the vocal folds resulting from excessive (voice overuse) or inappropriate (voice misuse) use of the vocal apparatus. The treatment of such pathologies is based on voice therapy and occasionally microsurgery. However, it is not unusual to observe poor treatment outcomes or lesion recurrence, whatever the rehabilitation technique used. We believe that one of the reasons is the absence of a conceptual framework of the different dimensions of the vocal effort. The vocal effort is often considered as being an unpleasant sensation for the subject [6]. But here, we endorse the mechanical approach to vocal effort, including all the aspects of vocal production, from the speaker behavior to the functioning of the vocal apparatus.
Vocal effort is an global adaptive vocal behavior - every communication situation involves a set of difficulties that the speaker has to overcome to make his message perceived and understood by the listener. Those difficulties refer in particular to the environmental noise, the distance to the listener, the listener's lack of attention, etc. Relating to this issue, a number of studies have been presented, among which the study of the "Lombard speech" - louder voice and tendency to hyperarticulation in loud noise environments [7]. The objective of the speaker is indeed to improve speech intelligibility through reinforcement of the intonation marks and of the articulation precision. This is coherent with the notions of hypoarticulation and hyperarticulation from Lindblom [8] applied here to the larynx. Lindblom proposes that the external constraints, or "perception constraints" (ambient noise, distance, importance of the message) cause speakers to hyperarticulate in order to improve perceptual distinctiveness. Conversely, he describes a principle of articulatory economy aiming at reducing the amplitude and/or duration of articulation whenever possible without hindering message comprehension, taking into account the "production constraints", corresponding more or less to the physiological capability to produce speech without excessive damage. This concept is very similar to that developed by Le Huche [9] because speech articulation depends on the speakers’ idea of how their message will be understood taking into account their physiological capabilities evaluated in real time. All in all, vocal effort seems to be a phenomenon aiming at improving the perception of all the phonemes – vowels and voiced as well as voiceless consonants. Vocal effort is defined here in terms
2
of glottal biomechanics, by the use of the mechanisms for the loud voice: elevation of subglottic pressure and increase in laryngeal resistance. These two variables evolve non-independently in normal speakers but can be controlled separately by "expert" speakers, as in the case of the singing voice.
Acoustically speaking, the increase in the articulatory force and articulatory precision has already been widely studied, especially with regard to vowels (see work on the notion of "clear speech", eg, [10][11][12]). The realization of the voicing feature requires sufficient adduction of the vocal folds. This laryngeal constriction is sufficient to produce a transglottal pressure differential allowing the occurrence of transglottal airflow to initiate and to maintain the vibratory cycles [13]. In reality, maintaining the vibration requires a non-linear element, in this case the elasticity of the tissues of the vocal folds that tends to oppose an adduction force proportional to the spacing of the folds during the opening phase (abduction). On the other hand, the air flow in the glottis exerts a negative intraglottic pressure, which is responsible for a Bernouilli effect that contributes to ‘self-oscillation’. The parameter indicative of the force necessary to initiate vocal folds vibration is the phonation threshold pressure, which is increased by vocal fold pathology [14][15]. Biomechanically speaking, we conceive vocal effort as being the work performed by the organs considered (at the laryngeal and supraglottic levels), when the voice has to be produced clearer or louder. The vocal effort is thus nothing else but the increase in the mechanical forces used in the vocal production (increasing the glottal pressure and resistance).The parameter indicative of the effective force necessary to produce vocal fold vibration is the value for the laryngeal airflow resistance (henceforth Rglo), which is the ratio of the translaryngeal air-pressure, ie, the value for the subglottal pressure (henceforth Ps) minus the value for the intraoral pressure (henceforth Po; close to 0 for vowels) to the amount of oral airflow (henceforth Flo) out of the mouth. Rglo increases with the vocal effort behavior, ie, when the voice is produced at high volume level. Thus, Grillo and colleagues [16][17] showed that Rglo is capable of differentiating a vowel produced at normal volume level from a vowel produced at loud volume level. In a similar study, Rosenthal et al [18] showed that Rglo was lower for the phonation threshold pressure than for the modal voice condition, thereby showing that Rglo is influenced by the variations in voice intensity. These measures, considered as "the missing link" in voice physiology, have already been the subject of several publications [19][20][21][22]. They are now starting to be used in clinical practice. In a
3
normal subject, with no glottal air leakage due to a pathological condition, Rglo can be considered as a clear indication of phonatory effort.
Studies directly relating to the aerodynamic aspects of vocal effort during speech production and particularly during consonant production are rare. Consonant production, which involves a narrowly constricted vocal tract, could impact the subglottal pressure differently from vowel production, which involves a more open vocal tract. Previous studies on aerodynamic phenomena occurring in situations of narrowing of the vocal tract, as for example during phonation into a tube [23][24], confirmed that subglottal air pressure increases during phonation into a narrow straw, which could also be expected duringthe production of certain consonants. Yet, referring to the concept of global behavior, it can be said that it is likely that broadly similar phenomena affect the different phonemes produced during speech sequencing [25]. In line with this view, our general proposition is that during vocal effort the global increase in the aerodynamic resistance is similarly distributed over the speech production apparatus. The originality of this work lies essentially in the study of the coherence between the aerodynamic measures obtained for vowels, ie, produced by laryngeal adduction and vibration and without critical articulatory constriction - considered "gold standard" measures - and the aerodynamic measures obtained for voiced fricatives, ie, produced by the adduction and vibration of the vocal folds concomitantly with critical articulatory constriction, and also for voiceless fricatives, ie, produced by abduction and no vibration of the vocal folds concurrently with critical articulatory constriction. We therefore expect that different levels of vocal effort can be accounted for by calculating the airflow resistance at the laryngeal constriction (ie, vocal fold adduction), which is responsible for the phonation during vowels (and voiced segments), as well as at the supralaryngeal constriction, which is responsible for the articulation of fricative consonants. Therefore, we expect to observe similar airflow resistance during vowels or consonants and at all of the critical points of constriction of the vocal tract.
Apart from the other indirect methods of Ps and Rglo estimation [26]
,
which are indeed just asinvasive as the direct method, Holmberg [27] and Smitheran and Hixon [28] proposed a commonly used method to infer Ps from Po, and so to calculate an inferred Rglo. This minimally invasive indirect method is based on the principle of translaryngeal air pressure equalization during the occlusion of the labial voiceless stop /p/ [29][30][31]. Using a train of /pV/ syllables, Ps are inferred from the Po of the voiceless stops and airflow is measured at the middle of the interconsonantal vowels [26]. Because of the high correlation between indirect (ie, Po) and direct Ps values [26][28][32], the indirect method of
4
Rglo inference is efficient enough to discriminate between different phonation types [16][17][27][33] and sound intensity levels [18][34][35]. Nevertheless, Rglo values are calculated on nonsynchronous measures taken on different segments in the same syllable, making it impossible to dissociate the measurement for the vowel from the measurement for the consonant, and thus the Rglo produced during vowels from the Rglo produced during consonants. The calculated Rglo does not correspond to the Rglo during the production of the sole vowel or to the Rglo during the production of the sole consonant, but it is a more global and composite measure on the whole syllable The choice of fricative consonants makes it possible to overcome this major disadvantage. Therefore, here, we propose a new method of Rglo inference by Ps estimation from Po based on synchronous air pressure and flow measurements on the sole consonant. This method is based on the use of a continuous voiceless obstruent consonant, ie, the fricative /f/, instead of the noncontinuous voiceless stop /p/. As fricatives present a continuous aerodynamic leakage at their articulatory constriction, the Flo can be measured during their production. As fricatives are obstruents, ie, articulated by a critical constriction of the vocal tract, the Po is high during their production. Therefore, the measures necessary for the Rglo calculation are synchronously available during fricative consonants.
OBJECTIVES AND HYPOTHESES
We conduct a feasibility study on one healthy subject with two objectives, one general and one operational. The aim of the feasibility study is to assess the replicability and the efficiency of this new indirect method, regarding the general hypothesis, by comparison with the direct method.
The goal of
this feasibility study being limited to one single subject is not to generalize the investigated process
but to assess, from prototype productions and controlled conditions,whether such generalization could be achieved by means of this new indirect method.
Therefore, the operational objective is to know whether the measurement of Po during labial fricatives, especially voiceless fricatives, offers a noninvasive means to efficiently capture Ps values and variations.
The general objective is to demonstrate that vocal effort is directed to all phonemes - whether they are vowels, or voiced or voiceless consonants. Different airflow resistance degrees due to vocal effort increasing with the intensity level of speech could be measurable at the laryngeal constriction (ie, vocal fold adduction) responsible for the phonation during voiced segments, ie, vowel and voiced
5
fricative, as well as at the supralaryngeal constriction characterizing the articulation of voiced and voiceless fricatives. Therefore, we suggest that the airflow resistance at the lips (henceforth Rlab) during the production of the labial fricatives /f v/ is parallel to the airflow resistance at the larynx (Rglo) observed during vowel production.
First, the linguistic material and the methodology of data acquisition and processing are presented, then we report and discuss the results, first those relative to the operational objective (Experiment 1), then regarding the general objective (Experiment 2), before concluding by a general discussion.
MATERIALS AND METHODS
This feasibility study was conducted on one single subject, one of the authors, a 55-year-old man, a nonsmoker with no history of larynx or voice problems. The EVA aerophonometer [36] was used for the synchronous acquisition of acoustic, oral airflow and air pressure signals. EVA’s accuracy for aerodynamic measurements is very high; the measurement errors are essentially due to digitization noise leading to an error of 0.03mL/s (ie, 0.0015%) for oral airflow and to 0.03Pa (ie, 0.0015%) for pressure measurements. Data acquisition was performed using the technique described in Robieux et al [37]:
Ps: the real subglottal pressure (in hecto Pascals [hPa]), using a 23-gauge catheter (Cathlon IV; Smiths Medical, London, UK) inserted through the skin into the space between the first and second tracheal rings.
Po: the real intraoral pressure (in hPa), from a 4mm (in external diameter) suction catheter (Eruplast; Rüsch, Teleflex Medical GmbH, Kernen, Germany) placed inside the mouth and ending approximately 1 cm behind the central incisors.
Flo: the oral airflow (in dm3/s), detected by a flow sensor placed in front of the mouth and integrated into the airtight handpiece of the EVA aerophonometer (SQLab, Aix-en-Provence, France)..
the acoustic signal, by a microphone (C519, AKG, Wien, Austria), located at the front of the oralflow sensor, to identify the targets to be measured using the Phonedit signal editing software (http://www.lpl-aix.fr/~lpldev/phonedit), integrated in the EVA station (SQ Lab, Aix-en-Provence, France).
6
The corpus consisted of a list of non-sense words with a pattern of V[f]V[v]V and V[v]V[f]V, in which the voiced /v/ and voiceless /f/ fricatives were the target consonants of the study. Each word was produced in six symmetrical vocalic contexts with /i e u a /, eg /afava/, /avafa/, /ifivi/, /ivifi/, and so on. The French speaker repeated each list of these 12 pseudo-words six times in four different speech conditions: speech threshold (Threshold), volume of calm conversation (modal voice: Modal), similar to dictation conditions (clear voice: Clear), and similar to a person calling from a few meters away (loud voice: Loud). In each series and for each repetition of the list, the pseudo-words and conditions were presented in a different random order unknown to the speaker. The different conditions were perceptually validated by mutual agreement between an expert phonetician (one of the authors) and the speaker himself. The objective was the production of prototypes.
Aerodynamic data were extracted on the fricative consonant (C1) and the vowel (V2) at the word-median syllable of a sequence VC1V2CV using Phonedit. The amplitudes of pressures (Ps and Po) and of flow (Flo) for the fricatives were measured synchronously at the exact time when the Po peak is reached during consonant production. This time point is regarded as corresponding articulatorily to the maximum labiodental constriction. The amplitudes of pressure and flow for the vowels were measured at the middle of the acoustic stable portion of the vowel. This time point is viewed to approach the articulatory target, defined by the articulatory height and place of the tongue, which are distinctive features of the vowels. This time point is also chosen so as to avoid the perturbations due to the coarticulation with contiguous consonants [26].
The analyses on fricatives alone were based on data including all vocalic contexts. For the comparisons between vowels and consonants, the analyses of correlation focused only on items containing the open vowel /a/, ie, /afava/ and /avafa/. This makes it possible to compare extrema on the continuum of aerodynamic resistance, ie, between a vowel produced with a null articulatory resistance of the vocal tract due to the maximal articulatory opening and a maximal laryngeal resistance due to the vocal fold adduction, and a voiceless consonant produced with a high articulatory resistance due to the critical constriction of the vocal tract and a minimal laryngeal resistance due to the vocal fold abduction. The airflow resistance at the lips for /f/ and /v/ and at the larynx for /v/ and /a/ was calculated as follows:
7 Rglo: the laryngeal resistance (in hPa/dm3/s), calculated as (Ps-Po)/Flo. The oral cavity is
widely open during the articulation of /a/; thus Po is equal to 0 and Rglo corresponds to Ps/Flo (see Rothenberg [31]).
Rlab: the labiodental articulatory constriction resistance (in hPa/dm3/s) during the production of fricatives, calculated as the ratio between the intraoral pressure and the oral airflow: Po/Flo. Due to the widely open vocal tract, Rlab for the vowel /a/ was invariably close to 0 and not considered here (see Demolin et al [38]).
Statistical analyses were performed with R Studio package version 0.98.1091 (RStudio Inc.; Boston, Massachusetts, USA). The Welch test [39], a variant of the Student test adjusting the degrees of freedom of the test so as to allow populations with different variances to be compared, was used for comparisons of means. Linear regressions were used to estimate the linear correlation between pairs of variables. In such a context, the coefficient of determination, adjusted R², is the multiple correlation coefficient of the linear model. Thus, the adjusted R² was used to estimate the level of linear correlation between two variables. The significance level for all statistical tests was fixed at 0.05.
EXPERIMENT 1
The efficiency of an indirect measurement of Rglo via Rlab of fricatives depends on the accuracy of the Ps estimation by Po. Therefore, here we analyze the correlation between Ps and Po values for the voiceless fricative /f/ and the voiced fricative /v/. It has to be assessed whether the Po of the fricative could be a good predictor of the Ps values or, at least, an accurate indicator of macro-variations of Ps, as produced with increasing vocal effort, ie, from threshold to loud speech. Only simultaneous measures are considered here because the comparison between a consonant and a vowel is the object of the general hypothesis.
Results
Table 1 presents the differences between Ps and Po for the fricatives in each speech condition. Large absolute differences are observed, from 2.18 hPa for /f/ and 3.85 for /v/ inthe Threshold condition to 5.01 hPa for /f/ and 17.89 for /v/ in Loud speech. The difference becomes larger as the pressures increase with the level of vocal effort, which is especially strong for /v/. In ratio, ie, Po value minus Ps value divided by Ps value, the difference remains large: higher than 20% for /f/ and 60% for /v/, but
8
decreases when the vocal effort increases, thus more strongly for /f/. Finally, in all speech conditions, /f/ presents a Po-Ps delta far smaller than /v/.
INSERT TABLE 1 ABOUT HERE
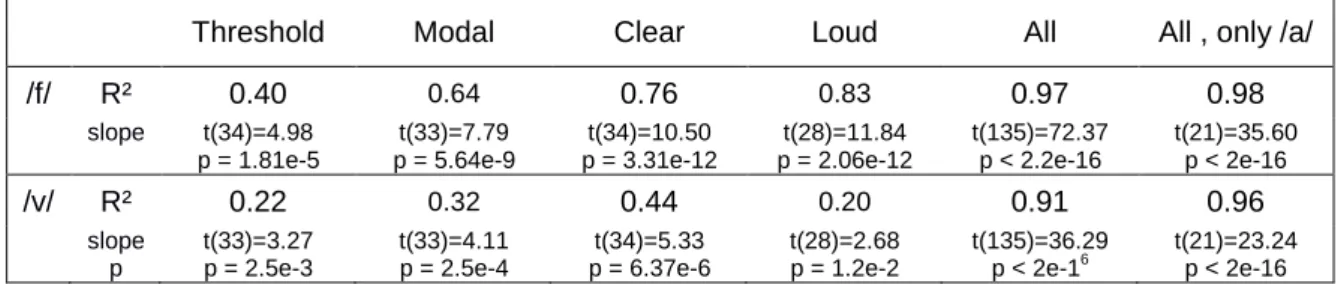
Pearson linear regressions were calculated in order to study the correlations between the Ps and Po for fricatives in each condition of speech and for all conditions in all vowel contexts and in the only /a/ context. Table 2 shows the coefficient of determination adjusted R² and the significance level of the slope of the regression line for all comparisons. For both fricatives, it appears that the adjusted R² calculated for all speech conditions pooled together is very high and stronger for /f/ than for /v/: respectively, 0.97 and 0.91, respectively, in all vowel contexts and 0.98 and 0.96, respectively, in the /a/ context. The adjusted R² is substantially lower when it is estimated for each condition: from 0.40 to 0.83 for /f/ and from 0.22 to 0.44 for /v/.
INSERT TABLE 2 ABOUT HERE
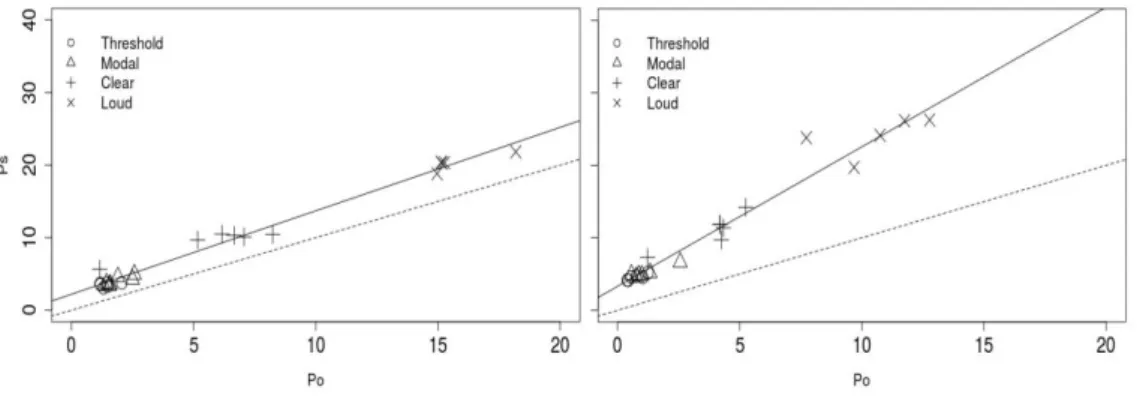
Figure 1 presents the linear regression lines for Ps as a function of Po measured for /f/ and for /v/ in all vocalic contexts and in /a/ contexts. Comparing /f/ with /v/, the correlations between pressures are stronger for the voiceless thanthe voiced fricatives, as well as in each speech condition (Table 2). The Ps values from the Po values for /f/ spread very closely about the regression line, while for /v/ a wider dispersion about the regression line reflects a less powerful accuracy of the model. Moreover, only for /f/, and not for /v/, the slope of the regression line is quite parallel to the 45°-slope regression line, indicating that Po increases proportionally with Ps for /f/. For /v/, this slope is much more abrupt, indicating that Ps values increase more than Po values as a function of the level of vocal effort.
INSERT FIGURE 1 ABOUT HERE Discussion
The results report that Po is always lower than Ps for both fricatives. As expected, /v/ exhibits a greater difference than /f/ (Table 1), due to higher Ps and lower Po (Demolin et al [38] and Meynadier [40]on French), as a result of the decoupling of the trachea and pharyngeal cavity by the adduction of the vocal folds for voicing. The voiced and voiceless consonants exhibit different expiratory load distributions. For the voiced fricative /v/, the load is supported by the two points of constriction, laryngeal and labiodental. Thus, during the production of /v/ there is a loss of the Po load caused by the laryngeal adduction responsible for the phonation, and so the decoupling between Ps and Po is
9
even more significant than for /f/. This is confirmed for all phonatory and vocalic conditions by correlations between Ps and Po, which is stronger for the voiceless than for the voiced fricative (Table 2), for which the dispersion around the regression line is wider and the slope of the Ps-Po regression line is steeper (Figure 1). As is well known for plosives, Po is, as expected, a more accurate indicator of Ps for the voiceless fricative than for the voiced fricative. As voiceless consonants are produced with an open glottis, the expiratory air pressure load is transferred onto the point of the articulation constriction.
Nevertheless, the point remains that the vocal fold abduction for the voiceless fricative /f/ provides an increase in transglottal airflow resulting in a high Po, but also a low Ps (relative to /v/), hence a large enough difference between Ps and Po (Table 1). As a result, the maximal Po of /f/ obviously cannot be considered as an exact prediction of the real Ps value simultaneously measured. This is highlighted by low enough correlations, especially in the lower phonation conditions (Threshold and Modal, Table 2). Actually, compared with the labial voiceless stop /p/ reported in previous studies, the Ps-Po deltas measured here for /f/ are significantly larger. Hertegård [32] found a maximal difference of 5% for /p/ produced in repeated /pa/ syllables in isolation or embedded in a carrier sentence. A similar difference was observed by Demolin et al [38] for the production of /p/, /t/ and /k/ in CaCa sequences by 1 French speaker. In the study by Demolin et al, Po values were slightly lower than Ps values, but they showed extremely high linear correlations with a 45°-slope regression line. Here, for /f/, Ps and Po values are much more different, as shown by the larger upwards shift of the points above the 45°-slope regression line (Figure 1). The greater shift above the 45°-slope regression line for the fricatives than for the stops [38] shows that Po never equals Ps during /f/ production in any condition. The main reason is the continuous air leak at the articulatory constriction (here at the lips) for fricatives, contrasting with the total closing of the vocal tract for stops. Up to almost 2 hPa decreases in Po for fricatives are reported in the literature, as in studies Subtelny et al [41], Arkebauer et al [42]or Frazer [43]. Stevens [44] reports that a voiceless fricative presents an open glottal area greater than the area at the oral constriction, which induces a sufficient air build-up behind the oral constriction. This results in a high Po necessary to the generation of the articulatory turbulent noise, which is the main phonetic characteristic of a fricative. In addition, a larger glottal opening for voiceless fricatives than for plosives is observed in various languages [45][46][47][48][49][50][51][52]. Stevens considers that by means of this laryngeal maneuver the transglottal equalization of pressures can be achieved, provided the oral
10
constriction is long enough. Nevertheless, a larger glottal opening causes a concomitant slight Ps decrease making the delay for pressure equalization even longer, because of the increase in Po and the decrease in Ps, ie, a momentarily even larger Po-Ps delta. It is also clear in our pilot study that the Po-Ps equalization is far from having been reached during the voiceless fricative production. Therefore, our study shows that Po cannot really be considered as a very precise predictor for the instantaneous amplitude of the real Ps for fricatives, because of a large air leak at the vocal tract constriction and a noninsignificant glottal resistance, as large Po-Ps differences indicate.
Nevertheless, especially for the voiceless fricative, the Po peak shows a very strong correlation with Ps as the vocal effort increases (Table 2) or when all vocal effort conditions are taken into account together (Figure 1). Across speech levels, the adjusted R² reaches 0.97 when all vocalic contexts are pooled and 0.98 in the /a/ context, and fits well enough the 45°-slope of the linear regression model between Ps and Po values. The Po of the voiceless fricative /f/ seems particularly able to account for the macro-variations in Ps due to the increasing levels of vocal effort, from the Threshold to the Loud condition. Therefore, we argue that this method of direct aerodynamic measurement on voiceless fricative could make it possible to estimate the vocal effort produced during consonant independently of measurements made on the contiguous vowel. Consequently, it seems possible to study the distribution of vocal effort over consonantal and vocalic segments of a same CVCV sequence by means of independent measurements of airflow resistance at different critical of points of the vocal apparatus.
EXPERIMENT 2
Experiment 2 concerns the main objective of this work, which is relative to the analysis of the distribution of vocal effort between the consonants and vowels by means of airway resistance measurements. We suggest that the vocal effort is a global speech behavior of the overall production apparatus and that it is not focused on the sole vowel, used as the gold standard measure for the evaluation of vocal effort. We suppose a strong synergy also exists between consonant and vowel articulation and phonation in a syllable. Here, we report the results of analyses of variance and linear regressions regarding the effect of an increasing vocal effort on airflow, air pressures and airflow resistances, with a particular interest in the comparison between the Rlab for fricatives and the Rglo for the vowel /a/.
11
Results
Airflow
The results on airflow variation due to vocal effort are summarized inTable 3. It is observed that Flo is not significantly different in the first three lower conditions of speech, but increases markedly, for the Loud condition, for the vowel (from 0.31 to 0.49 dm3/s) as well as for the fricatives (from 0.56 to 0.81 dm3/s for /f/ and from 0.25 to 0.50 dm3/s for /v/). The similar variation of Flo for the three segments is fairly well supported by significant coefficients of correlation between /a/ and /v/ (adjusted R² = 0.76, slope: t(21) = 8.41, p = 3.68e-8) and, /a/ and /f/ (adjusted R² = 0.65, slope: t(21) = 6.53, p = 1.82e-6). /f/ shows a Flo obviously higher than that for the voiced segments, /v/ as /a/, as a result of its large vocal-fold abduction. For /v/, the Flo values are slightly below those for the vowel /a/ (except in the Loud condition). These observations indicate the major impact of the vocal-fold adduction and the weaker effect of the labial articulatory constriction on Flo when voicing is produced.
INSERT TABLE 3 ABOUT HERE
Air pressures
As represented in Table 4, the variations in Ps for the vowel and both fricatives are quite parallel according to vocal effort. Ps exhibits a constant increase, which is maximum in the Loud condition, showing a twofold increase compared with the Clear speech: from 10.27 to 27.56 hPa for /a/, from 11.37 to 26.93 hPa for /v/, and from 9.59 to 21.41 hPa for /f/. It is noted that Ps for the voiced segments /a/ and /v/ are very close, while Ps for /f/ is slightly lower, as a consequence of its ‘extra-open’ glottis (see above). Nevertheless, the Ps variations for fricatives due to an increasing vocal effort respond in the same way as Ps for /a/, as illustrated in Figure 2 (top) and indicated by very high and significant coefficients of correlation between /a/ and /v/ (adjusted R² = 0.99, slope: t(21) = 58.81, p < 2e-16), and between /a/ and /f/ (adjusted R² = 0.98, slope: t(21) = 30.11, p < 2e-16).
INSERT TABLE 4 ABOUT HERE
As reported in Table 4, Po rises steadily and across the four conditions of increasing vocal effort in a similar way for /f/ (from 1.37 to 16.40 hPa) and for /v/ (from 0.78 to 9.44 hPa). The greater increase is produced in the Loud condition, where the Po value is tripled compared with that in the Clear condition. This Po variation for fricatives is parallel to the Ps variation for /a/ as a function of vocal effort, as shown by high correlations of Ps for /a/ with Po for /v/ (adjusted R² = 0.96, slope: t(21) =
12
22.58, p < 3.29e-16) as with Po for /f/ (adjusted R² = 0.97, slope: t(21) = 27.95, p < 2e-16). The Po for /f/ very closely varies with the dynamics of the Ps for the following vowel under vocal effort, as shown by the linear regression line parallel enough to the 45°-slope of the linear regression model (Figure 2). Compared with /f/, /v/ shows a steeper slope and more variation at the higher level of vocal effort, illustrating greater differences between its Po value and the Ps for the following /a/ with an increasing vocal effort. In both cases, the maximum Po for fricatives under-estimates the Ps for the following /a/ vowel.
INSERT FIGURE 2 ABOUT HERE
Airway resistances
Means and statistical differences for Rglo and Rlab between the conditions of vocal effort are presented in Table 5 and Figure 3. For /a/, Rglo increases significantly from one condition to the other, the greatest differences being between Modal and Clear (from 16.77 to 36.53 hPa/dm3/s) and between Clear and Loud (from 36.53 to 56.49 hPa/dm3/s). Unlike for the vowel, the Rglo for /v/, which increases significantly between the first three conditions, does not exhibit any significant difference between Clear (34.88 hPa/dm3/s) and Loud (36.08 hPa/dm3/s). The Rglo for /f/ varies even more than the Rglo for the vowel. It increases significantly only between Modal and Clear, remaining quite stable between the two lower voice conditions (5.12 hPa/dm3/s in Threshold versus 5.47 in Modal), as well as between the two higher voice conditions. (8.45 hPa/dm3/s in Clear versus 7.80 hPa/dm3/s in Loud). Therefore, the Rglo of fricatives shows a weak correlation with Rglo for /a/, as for /v/ (adjusted R² = 0.25, slope: t(21) = 2.91, p = 8.4e-3) or even no correlation, as for /f/ (adjusted R² = -0.025, slope: t(21) = 0.69, p = 0.50). Nevertheless, it could be noted here that even the voiceless fricative, for which glottal adduction is prohibited, shows some traces of vocal effort at the laryngeal level.
INSERT TABLE 5 ABOUT HERE INSERT FIGURE 3 ABOUT HERE
For /v/, Rlab rises steadily between conditions and exhibits the most marked increase being that between Modal (5.73 hPa/dm3/s) and Clear (14.99 hPa/dm3/s). For /f/ Rlab broadly increases significantly from condition to condition, the difference being the greatest between Clear (11.52 hPa/dm3/s) and Loud (22.45 hPa/dm3/s) – the only clear point of difference between the Rlab for /f/ and for /v/. The behavior of Rlab for /v/ seems to be closer to the variation of Rglo for the vowel /a/.
13
Figure 4 represents the linear regression of Rglo for /a/ as a function of Rlab for /f/ and for /v/. The coefficient R2 is 0.78 for /f/ (slope: t(20) = 8.68, p = 4.6e-3) and 0.83 for /v/ (slope: t(20) = 10.04, p = 2.99e-9). As for Po, it appears that Rlab of fricatives under-estimates the Rglo for the following /a/ vowel and so it cannot be considered as a precise predictor of the real Rglo values for /a/, notably indicated by an upwards shift of the regression line far enough from the 45°-slope regression line. Nevertheless, the high correlations between Rlab and Rglo highlight that the articulatory resistance at the lips under vocal effort very closely varies with the dynamic of the resistance at the larynx for the following vowel.
INSERT FIGURE 4 ABOUT HERE Discussion
The objective of this pilot study was to evaluate, by measurement of the airway resistance of the articulator considered, whether vocal effort distribution depends on the type of articulation, ie, vowel or consonant. As a matter of fact, there have been few studies on consonants as such, except those using the method of indirect measurement of Ps inferred by Po during the production of voiceless stops, which does not directly concern the production of the consonants themselves. The method is especially used to estimate the Rglo during the production of vowels, which is considered the gold standard in assessing vocal effort and forcing. Here, we are interested in evaluating the impact of vocal effort on the consonants themselves, suggesting that it could be similar to the effect of vocal effort measured on vowel. As expected, in our study the direct aerodynamic measures on the vowel /a/ show that Rglo reflects the increased vocal effort aiming at improving either clarity or intensity of speech. These results for vowel are perfectly in line with literature data (see the Introduction) and validate a prerequisite for the study on consonants. In order to evaluate our general hypothesis that consonants and vowels seem to respond in a similar way to the aerodynamic demands of the vocal effort, we discuss here the comparison of the aerodynamic measures on labial fricatives /f v/ and on /a/, that is, between closed phonemes produced with a high Rlab and open phonemes produced with a high Rglo and a nil Rlab.
Results on the parameters of aerodynamic resistance computing show that vowels and consonants display a perfectly similar increase in Ps and in Flo as a function of vocal effort. For all phonemes, Ps reflects distinctly the four levels of vocal effort, while Flo increases exclusively for the Loud condition.
14
Flo seems thus to be the least discriminating parameter of vocal effort conditions and the least correlated aerodynamic measure between a vowel and consonants. Indeed, its greater variability compared with pressures, as noted in numerous studies by standard deviation values, eg, Holmberg et al [34] or McHenry et al [53], may be due to the various pneumophonic, laryngeal and articulatory mechanisms it is subjected to. As at the very outlet of the production system, Flo results from multiple and complex combined variation sources. Real Ps, by contrast, is a highly distinctive parameter of the vocal effort level for vowels as well as for labial fricatives, which is stressed by strong correlations of Ps between fricatives and /a/. However, its use in routine clinical practice is severely limited by the invasiveness of its measurement, hence the relevance of a non-invasive aerodynamic measure such as the Po of labial fricatives. Yet, the Po of fricatives is equally efficient in distinguishing all levels of increasing vocal effort. Therefore, for the fricatives, a similar very high level of correlation with the Ps during /a/ production is observed for Po (for /f/ adjusted R² = 0.97; for /v/ adjusted R² = 0.96; see above) and for Ps (for /f/ adjusted R² = 0.98; for /v/ adjusted R² = 0.99; see above). Therefore, the pressure parameter (ie, Po) needed for the calculation of airflow resistance at the articulatory level of the fricative production (Rlab) responds to differences in vocal effort as well as the Ps used for the airflow resistance at the larynx for vowel production (Rglo).
As Rglo for vowels is considered as the gold standard measure of vocal effort, we compared the Rlab variation for fricatives /f v/ with that of Rglo for the vowel /a/, which allows here, as expected, the four levels of vocal effort to be distinguished. Rlab always increases with growing vocal effort and significantly distinguishes all four levels. This discrimination capacity is equivalent to that provided by the Rglo for vowels. This is also supported by the good correlations between Rglo for /a/ and Rlab for /f/ (adjusted R² = 0.78; see above) and for /v/ (adjusted R² = 0.83; see above).
In consonant production, although to a lesser extent, the laryngeal phonation also shows some traces of the impact of vocal effort. Produced with vocal fold adduction, the Rglo for the voiced fricative /v/ is obviously more reactive than the Rglo for the voiceless fricative /f/, produced with abduction. Rglo for /v/ fails to distinguish only the higher conditions (Clear and Loud). For /f/, the distinction by Rglo is lost for the lower conditions (Threshold and Modal) and for the higher conditions (Clear and Loud). But even in the case of the voiceless consonant, the residual Rglo is still somewhat modulated by vocal effort. This point argues for a global behavior in vocal effort, which could be not restricted to a strategy of articulatory reinforcement of preferential targets, eg, vowels, or properties, eg, distinctive
15
features. Therefore, this non-nil Rglo for /f/ and its increase with growing vocal effort could reflect the level of general effort exerted on the larynx - whether in adduction or in abduction with no possible release in the short term. This phenomenon could also be interpreted as the persistence and the anticipation of the laryngeal constriction necessary for the vowels preceding or following the consonant.
All in all, it can thus be considered that, during speech production with vocal effort, similar phenomena occur at the laryngeal level for vowels and consonants and at the articulatory level for consonants. This is in line with the notion of global vocal effort distributed and aimed at vowels as well
as atconsonants, which seem to respond in a very similar way to the aerodynamic demands of vocal
effort.
CONCLUSION
The general hypothesis of our work was that when a subject speaks with a loud voice or a clear voice, we can observe at the same time a vocal effort at a glottal level (with increased subglottic pressure and glottal resistance) and at an articulatory level (with increased intraoral pressure and labiodental constriction) during the production of homosyllabic consonants and vowels. Our results are consistent with this hypothesis.
Our work was a feasibility study carried out on a single subject, a coauthor of the article. His knowledge of the problem allowed him to produce prototypical speech types precisely to explore the hypothesis. Even preliminary, these results are compatible with the clinical models of vocal effort (Le Huche [9]) as well as with the phonetic models of speech variation (Lindblom [8]) where the speaker is expected to produce his or her speech in order to be understood and adjusts the intensity and articulatory precision for this purpose, and so tends to simultaneously increase the effort made at the glottal level and at the articulatory level.
This feasibility study suggests the adequacy of a new indirect method to infer fairly accurately the glottal resistance due to an increasing vocal effort from the supraglottal resistance produced at the oral constriction of fricative consonants. This result makes it possible to observe that a similar vocal effort seems to be produced for all segment types, vowels as well as consonants, in the same syllable. However, these preliminary results need to be confirmed by a larger study on a cohort of
16
inexperienced subjects producing more ecological speech corpora in more realistic situations of vocal effort.
REFERENCES
[1] Roy N, Nelson R, Merrill RM, Thibeault S, Gray SD, Smith EM. Prevalence of voice disorders in teachers and the general population: effects on work performance, attendance, and future career choices. J Speech Lang Hear R. 2004; 47: 542–551.
[2] Behlau M, Zambon F, Guerrieri AC, Roy N. Epidemiology of voice disorders in teachers and nonteachers in Brazil: prevalence and adverse effects. J Voice. 2012; 26(5): 665.e9-18.
[3] Martins RH, Pereira ER, Hidalgo CB, Tavares EL. Voice disorders in teachers. A review. J Voice. 2014; 28(6): 716-724.
[4] Dikkers FG, Nikkels PG. Benign lesions of the vocal folds: histpathology and phonotrauma. Ann
Otol Laryngol. 1995; 104(9 Pt1): 698-703.
[5] Hantzakos A, Remacle M, Dikkers FG, Degols JC, Delos M, Fredrich G, Giovanni A, Rasmussen N. Exudative lesions of Reinke’s space: a terminology proposal. Eur Arch Otorhinolaryngol. 2009; 266(6): 869-878.
[6] Ford Baldner E, Doll E, van Mersbergen MR. A Review of Measures of Vocal Effort With a Preliminary Study on the Establishment of a Vocal Effort Measure. J Voice. 2015; 29(5): 530-41.
[7] Garnier M. Communiquer en environnement bruyant : de l’adaptation jusqu’au forçage vocal [PhD.thesis]. Paris, France: Pierre et Marie Curie - Paris VI University; 2007.
[8] Lindblom B. Explaining phonetic variation : a sketch of the HandH theory. In Hardcastle, Marchal, Eds. Speech Production and Speech Modelling. Dordrecht, Netherlands: Kluwer Academic Publishers; 1990: 403-439.
[9] Le Huche F. Les concepts de projection vocale et de voix de détresse. Les Cahiers
d'Oto-Rhino-Laryngologie, de Chirurgie Cervico-Faciale et d'Audiophonologie
.
1990; 25(5): 297-302.[10] Leung KK, Jongman A, Wang Y, Sereno JA. Acoustic characteristics of clearly spoken English tense and lax vowels. J Acoust Soc Am. 2016; 140(1): 45.
[11] Kuo, C Weismer G. Vowel reduction across tasks for male speakers of American English. J
17
[12] Whitfield JA, Goberman AM. Articulatory-acoustic vowel space : associations between acoustic and perceptual measures of clear speech. Int J Speech Lang Pathol. 2016; 21: 1-11.
[13] Ladefoged P. The features of the larynx. J Phon. 1973; 1(1): 73-83.
[14] Titze IR, Schmidt SS, Titze MR. Phonation threshold pressure in a physical model of vocal fold mucosa. J Acoust Soc Am. 1995; 97(5 Pt 1):3080-3084.
[15] Zhang, Z. Cause-effect relashionship beween vocal fold physiology and voice production in a three-dimensional phonation model. J Acoust Soc Am. 2016; 139(4): 1493.
[16] Grillo EU, Perta K, Smith L. Laryngeal resistance distinguished pressed, normal and breathy voice in vocally untrained females. Logop Phoniatr Voco. 2009; 34(1): 43-48.
[17] Grillo EU, Verdolini K. Evidence for distinguishing pressed, normal, resonant, and breathy voice qualities by laryngeal resistance and vocal efficiency in vocally trained subjects. J Voice. 2008;
22(5): 546-552.
[18] Rosenthal AL, Lowell SY, Colton RH. Aerodynamic and acoustic features of vocal effort. J Voice. 2014; 28(2): 144-153.
[19] Titze IR. Phonation threshold pressure : a missing link in glottal aerodynamics. J Acoust Soc Am. 1992; 91(5): 2926-2935.
[20] Giovanni A, Robert D, Estublier N, Teston B, Zanaret M, Cannoni M. Objective evaluation of dysphonia : preliminary results of a device allowing simultaneaous acoustic and aerodynamic measurements. Folia Phoniatr Logo. 1996; 48: 175-185.
[21] Yu P, Ouaknine M, Revis J, Giovanni A. Objective voice analysis for dysphonic patients: a multiparametric protocol including acoustic and aerodynamic measurements. J Voice. 2001; 15(4): 529-542.
[22] Zhuang P, Swinarska JT, Robieux CF, Hoffman MR, Lin S, Jiang JJ. Measurement of phonation threshold power in normal and disordered voice production. Ann Otol Rhinol Laryngol. 2013; 122(9): 555-560.
[23] Amy de la Bretèque B. L'aérodynamique de la voix : à propos des exercices de rééducation avec
constriction du tractus vocal [PhD thesis]. Aix-en-Provence, France: Aix-Marseille University;
2014.
[24] Titze IR. Phonation threshold pressure measurement with a semi-occluded vocal tract. J Speech
18
[25] Traunmüller H, Eriksson A. Acoustic effects of variation in vocal tract effort by men, women, and children. J Acoust Soc Am. 2000; 107(6): 3438-3451.
[26] Löfqvist A, Carlborg B, Kitzing P. Initial validation of an indirect measure of subglottal pressure during vowels. J Acoust Soc Am. 1982; 72(2): 633–635.
[27] Holmberg EB. Laryngeal airway resistance as a function of phonated speech. J Acoust Soc Am. 1980; 68, Suppl. 1: S101.
[28] Smitheran JR, Hixon TJ. A clinical method for estimating laryngeal airway resistance during vowel production. J Speech Hear Disord. 1981; 46(2): 138-146.
[29] Shipp T. Intraoral pressure and lip occlusion in midvocalic stop consonant production. J Phon. 1973; 1: 167-170.
[30] Rothenberg M. A new inverse-filtering technique for deriving the glottal air flow waveform during voicing. J Acoust Soc Am. 1973; 53(6):1632-1645
[31] Rothenberg M. Interpolating subglottal pressure from oral pressure. J Speech Hear Disord. 1982; 47(2): 219-223.
[32] Hertegård S, Gauffin J, Lindestad P-Å. A comparison of subglottal and intraoral pressure measurements during phonation. J Voice; 1995; 9(2): 149–155.
[33] McHenry M, Minton JT, Kuna ST, Vanoye CR, Roberts-Seibert NS. Comparison of direct and indirect calculations of laryngeal airway resistance in various voicing conditions. Eur J Disord
Commun. 1995; 30(4): 435–449.
[34] Holmberg EB, Hillman RE, Perkell JS, Gress C. Relationships between intra-speaker variation in aerodynamic measures of voice production and variation in SPL across repeated recordings. J
Speech Lang Hear Res. 1994; 37(3): 484-495.
[35] Wilson JV, Leeper HA. Changes in laryngeal airway resistance in young adult men and women as a function of vocal sound pressure level and syllable context. J Voice. 1992; 6(3): 235–245. [36] Ghio A, Teston B. Evaluation of the acoustic and aerodynamic constraints of a
pneumotachograph for speech and voice studies. In: Proceedings of Int Conf Voice Physiol
Biomech. Marseille, France; 2004: 55-58.
[37] Robieux C, Galant C, Lagier A, Legou T, Giovanni A. Direct measurement of pressures involved in vocal exercises using semi-occluded vocal tracts. Logop Phoniatr Voco. 2014; 40(3): 106-112.
19
[38] Demolin D, Giovanni A, Hassid S, Heim C, Lecuit V, Soquet A. Direct and indirect measurements of subglottic pressure. In: Proceedings of Larynx 97. Marseille, France; 1997: 69–72.
[39] Welch BL. The generalization of “Student’s” problem when several different population variances are involved. Biometrika. 1947; 34(1-2): 28–35.
[40] Meynadier Y. Aerodynamic tool for phonology of voicing. In: Proceedings of Int Cong Phon Sci. Glasgow, UK; 2015.
[41] Subtelny JD, Worth JH, Sakuda M. Intraoral and rate flow during speech. J Speech Lang Hear
Res. 1966; 9(4): 498-518.
[42] Arkebauer HJ, Hixon TJ, Hardy JC. Peak Intraoral Air Pressures During Speech. J Speech Lang
Hear Res. 1967; 10(2): 196–208.
[43] Frazer BL. Approximating Subglottal Pressure from Oral Pressure: A Methodological Study.
Electronic MS Dissertation. Bowling Green State University, 2014. Available at:
https://etd.ohiolink.edu/,.Accessed April 2017.
[44] Stevens KN. Acoustic phonetics. Cambridge, MA: MIT Press, 1998.
[45] Slis IH. Articulatory Measurements on Voiced, Voiceless and Nasal Consonants. Phonetica. 1970; 21(4): 193–210.
[46] Collier R, Lisker L, Hirose H, Ushijima T. Voicing in intervocalic stops and fricatives in Dutch. J
Phon. 1979; 7: 357–373.
[47] Löfqvist A, Yoshioka H. Laryngeal activity in Swedish obstruent clusters. J Acoust Soc Am. 1980; 68: 792–801.
[48] Löfqvist A, Yoshioka H. Laryngeal activity in Icelandic obstruent production. Nord J Ling. 1981; 4(1): 1-18.
[49] Yoshioka H, Löfqvist A, Hirose H. Laryngeal adjustments in the production of consonant clusters and geminates in American English. J Acoust Soc Am. 1981; 70(6): 1615–1623.
[50] Yoshioka H, Löfqvist A, Collier RH. Laryngeal adjustments in Dutch voiceless obstruent production. Logoped Phoniatr. 1982; 16: 27-35.
[51] Löfqvist A, McGarr N. Laryngeal dynamics in voiceless consonant production. In Baer, Sasaki, Harris, Eds. Laryngeal function in phonation and respiration. Boston, USA: College-Hill Press; 1987: 391-402.
20
[52] Ridouane R, Fuchs S, Hoole P. Laryngeal adjustments in the production of voiceless obstruent clusters in Berber. In Harrington, Tabain, Eds. Speech Production: Models, Phonetic Processes,
and Techniques. Macquarie University, Sydney, Australia: Psychology Press; 2006: 249-267.
[53] McHenry MA, Kuna ST, Minton JT, Vanoye CR. Comparison of direct and indirect calculations of laryngeal airway resistance in connected speech. J Voice. 1996; 10(3): 236-244.
TABLES
Table 1: Difference between Ps and Po in hPa (Δ calculated by Ps minus Po) and in ratio (calculated by Ps minus Po divided by Ps).
/f/ /v/
Thres. Modal Clear Loud Thres. Modal Clear Loud Δ Ps-Po 2.18 2.43 4.12 5.01 3.85 4.61 8 17.49 ratio Ps/Po 0.61 0.54 0.43 0.23 0.83 0.8 0.7 0.65
Table 2: Adjusted R² and significant level of the slope of the linear regression of Ps as a function of Po for /f/ and /v/ in each speech condition and in all speech conditions confounded for all vocalic contexts and for the only /a/ context.
Threshold Modal Clear Loud All All , only /a/
/f/ R² 0.40 0.64 0.76 0.83 0.97 0.98 slope t(34)=4.98 p = 1.81e-5 t(33)=7.79 p = 5.64e-9 t(34)=10.50 p = 3.31e-12 t(28)=11.84 p = 2.06e-12 t(135)=72.37 p < 2.2e-16 t(21)=35.60 p < 2e-16 /v/ R² 0.22 0.32 0.44 0.20 0.91 0.96 slope p t(33)=3.27 p = 2.5e-3 t(33)=4.11 p = 2.5e-4 t(34)=5.33 p = 6.37e-6 t(28)=2.68 p = 1.2e-2 t(135)=36.29 p < 2e-16 t(21)=23.24 p < 2e-16
Table 3: Means and standard deviations (in parentheses) of Flo(in dm3/s) for the vowel /a/ and the fricatives /f, v/, with the p value for the pairwise statistical comparison of speech conditions (significant level at 0.05, « ns » for a non significant difference).
Flo Threshold p Modal p Clear p Loud
/a/ 0.31 (0.07) ns 0.30 (0.05) ns 0.31 (0.05) < 0.01 0.49 (0.04)
/v/ 0.26 (0.07) ns 0.24 (0.07) ns 0.25 (0.08) < 0.01 0.50 (0.10)
21
Table 4: Means and standard deviations (in parentheses) of Ps and Po(in hPa) for the vowel /a/ and the fricatives /f, v/, with the p value for the pairwise statistical comparison of speech conditions (significant level at 0.05, « ns » for a non significant difference).
Threshold p Modal p Clear p Loud
/a/ Ps 4.19 (0.38) < 0.01 4.98 (0.69) < 0.01 10.27 (2.13) < 0.01 27.56 (3.89)
/v/ Ps 4.63 (0.46) < 0.01 5.74 (0.88) < 0.01 11.37 (2.44) < 0.01 26.93 (3.71)
Po 0.78 (0.61) 0.015 1.13 (0.58) < 0.01 3.37 (1.50) < 0.01 9.44 (1.98)
/f/ Ps 3.55 (0.41) < 0.01 4.54 (0.78) < 0.01 9.59 (2.45) < 0.01 21.41 (2.66) Po 1.37 (0.43) < 0.01 2.11 (0.78) < 0.01 5.47 (2.66) < 0.01 16.40 (1.72)
Table 5: Means and standard deviations (in parentheses) of Rglo and Rlab (in hPa/dm3/s) for the vowel /a/ and the fricatives /f, v/, with the p value for the pairwise statistical comparison of speech conditions (significant level at 0.05, « ns » for a non significant difference).
Threshold p Modal p Clear p Loud
/a/ Rglo 14.36 (3.48) < 0.01 16.77 (3.85) < 0.01 34.53 (9.17) < 0.01 56.49 (9.81) /v/ Rglo 15.54 (4.20) < 0.01 21.18 (9.02) < 0.01 34.88 (12.90) ns 36.08 (9.31) Rlab 3.29 (2.95) 0.017 5.73 (5.06) < 0.01 14.99 (8.32) < 0.01 19.94 (7.34) /f/ Rglo 5.12 (1.70) ns 5.47 (1.64) < 0.01 8.45 (4.89) ns 7.80 (6.39) Rlab 3.32 (1.71) < 0.01 5.00 (2.85) < 0.01 11.52 (9.20) < 0.01 24.45 (15.01) FIGURES
Figure 1: Linear regression of Ps (y-axis, hPa) as a function of Po (x-axis, hPa) for /f/ (left) and /v/ (right) in all vocalic contexts (top; for both fricatives: 144 measures less 7 exclusions due to an acquisition error) and in /a/ context (bottom; for both fricatives: 24 measures less 1 exclusion due to an acquisition error). The 45°-slope regression line is indicated by the dotted line.
22
Figure 2: Linear regression of Ps for /a/ (y-axis, hPa) as a function of Ps (top, x-axis, hPa) for /f/ (left) and /v/ (right) and, as a function of Po (bottom, x-axis, hPa) for /f/ (left) and /v/ (right). For both fricatives: 24 measures less 1 exclusion due to an acquisition error. The 45°-slope regression line is indicated by the dotted line.
Figure 3: Mean Rglo (left) and Rlab (right) in hPa/dm3/s as a function of speech conditions for vowels and fricatives (confident interval of 95% in bars)
23
Figure 4: Linear regression of Rglo for /a/ (y-axis) as a function of Rlab (x-axis) for /f/ (left) and /v/ (right). For both fricatives: 24 measures less 1 exclusion due to an acquisition error plus 1 exclusion as outlier (1 from Clear condition for /f/; 1 from the Modal condition for /v/). The 45°-slope regression line is indicated by the dotted line.