HAL Id: hal-01579075
https://hal.inria.fr/hal-01579075
Submitted on 30 Aug 2017HAL is a multi-disciplinary open access archive for the deposit and dissemination of sci-entific research documents, whether they are pub-lished or not. The documents may come from teaching and research institutions in France or abroad, or from public or private research centers.
L’archive ouverte pluridisciplinaire HAL, est destinée au dépôt et à la diffusion de documents scientifiques de niveau recherche, publiés ou non, émanant des établissements d’enseignement et de recherche français ou étrangers, des laboratoires publics ou privés.
Review of recent Methodological Developments in
group-randomized trials: Part 2 - Analysis
Mélanie Prague, Elisabeth Turner, Gallis John, Li Fan, Murray David
To cite this version:
Mélanie Prague, Elisabeth Turner, Gallis John, Li Fan, Murray David. Review of recent Methodolog-ical Developments in group-randomized trials: Part 2 - Analysis. American Journal of Public Health, American Public Health Association, 2017. �hal-01579075�
REVIEW OF RECENT METHODOLOGICAL DEVELOPMENTS IN
1GROUP-RANDOMIZED TRIALS: PART 2 - ANALYSIS
23 4
Manuscript Click here to download Manuscript 20170128 GRT Review
ABSTRACT
5In 2004, Murray et al. published a review of methodological developments in both the design 6
and analysis of group-randomized trials (GRTs). Over the last 13 years, there have been many 7
developments in both areas. The goal of the current paper is to review developments in analysis, 8
with a companion paper to focus on developments in design. As a pair, these papers update the 9
2004 review. This analysis paper includes developments in topics included in the earlier review, 10
such as methods for parallel-arm GRTs, inference for conditional and marginal effects, and new 11
topics including methods to account for multiple levels of clustering and alternative estimation 12
methods such as augmented GEE, targeted maximum likelihood and quadratic inference 13
functions. We also examine developments in dealing with missing outcome data, including 14
doubly robust approaches, software available for analysis, and analysis of alternative group 15
designs (including stepped wedge GRTs, network-randomized trials, pseudo-cluster randomized 16
trials and individually-randomized group treatment trials). These alternative designs, like the 17
parallel-arm GRT, require clustering to be accounted for in both their design and analysis. 18
19
INTRODUCTION
20In a group-randomized trial (GRT), the unit of randomization is a group and outcome 21
measurements are obtained on members of those groups.1 Also called a cluster-randomized trial
22
or community trial,2-5 a GRT is the best comparative design available if the intervention operates
23
at a group level, manipulates the physical or social environment, cannot be delivered to 24
individual members of the group without substantial risk of contamination, or under other 25
circumstances (e.g., a desire for herd immunity in studies of infectious disease).1-5
In GRTs, outcomes on members of the same group are likely to be more similar to each other 27
than to outcomes on members from other groups.1 Such clustering must be accounted for in the
28
design to avoid an under-powered study and in the analysis to avoid under-estimated standard 29
errors and inflated type I error for the intervention effect.1-5 For analysis, regression modeling
30
approaches are generally preferred and most commonly used because of their ease of 31
implementation.6 Several textbooks now address these and other issues.1-5
32
In 2004, Murray et al.7 published a review of methodological developments in both the design
33
and analysis of GRTs. In the 13 years since, there have been many developments in both areas. 34
The goal of the current paper is to focus on developments in analytic methods, including those 35
relevant to designs described in a companion paper that focuses on developments in GRT 36
design.8 As a pair, these papers update the 2004 review. With both papers, we seek to provide a
37
broad and comprehensive review to guide the reader to seek out appropriate materials for their 38
own circumstances. 39
40
DEVELOPMENTS IN THE ANALYSIS OF PARALLEL
GROUP-41RANDOMIZED TRIALS
42Methods for Superiority, Equivalence, and Non-Inferiority
43
In GRTs, superiority trials are more common than equivalence or non-inferiority trials: a 44
PubMed search by one of the authors (DMM) of studies published in 2015 identified 562 45
superiority GRTs but only 1 equivalence GRT and 2 non-inferiority GRTs. Similarly, 46
developments in the methods literature have focused on superiority GRTs, with developments 47
for equivalence and non-inferiority GRTs limited to small sections in two of the more recent 48
textbooks2,5 and a review paper on sample size methods.9 As a consequence, the current review
49
paper focuses on superiority GRTs. 50
Methods for Intention-To-Treat and Alternative Intervention Effects
51
In GRTs, protocol violations can lead to non-compliance at either the group- or member-level.5
52
In order to minimize bias, intention-to-treat (ITT) principles are recommended at both levels 53
rather than “on-treatment” and “per-protocol” analyses.2,4,5 While group-level protocol violations
54
are usually easy to identify, member-level compliance may be more difficult to ascertain in 55
practice.2 Jo et al. demonstrate that analyses which ignore compliance information could be
56
underpowered to detect an ITT effect and propose a multilevel model combined with a mixture 57
model.10 Implications of group-level non-compliance can be considerable in GRTs, given the
58
small number of groups that are randomized in many GRTs. 59
Methods Based on the Randomization Scheme
60
Matching or stratification in the design has been recommended for some time as a way to ensure 61
baseline balance on important potential confounders,1 with constrained randomization more
62
recently developed.11 Recent reports suggest that most GRTs follow this advice.12-15 Matching
63
and stratification in the design can be ignored in the analysis of intervention effects, without 64
harm to the type I error rate, and often the saved degrees of freedom will improve power.16,17
65
Recently, Donner et al. reported that ignoring matching can adversely affect other analyses, such 66
as analyses that examine the relationship between a risk factor and an outcome;18 for this reason,
67
investigators considering pair-matching should consider small strata instead (e.g., strata of 4). Li 68
et al.19 compared model-based and permutation methods in the context of constrained
69
randomization adjusting for group-level covariates. They found that both the adjusted F-test and 70
permutation test maintained the nominal size and had improved power under constrained 71
randomization compared to simple randomization. 72
Model-Based Methods
73
Model-based methods can be broadly classified according to the interpretation of the model 74
parameters. Conditional model parameters are typically estimated using mixed-effects regression 75
via maximum likelihood estimation (MLE) and are referred to as cluster-specific effects (or as 76
subject-specific effects in the longitudinal analysis literature). Effects are conditional on the 77
random effects used to account for clustering and on other covariates included in the analysis. 78
Conditional models are often recommended for studies focused on change within members or on 79
mediation analyses.7 Parameters of marginal models are usually estimated using generalized
80
estimating equations (GEE).20,21 They define the marginal expectation of the dependent variable
81
as a function of the independent variables and assume that the variance is a function of the mean; 82
they separately specify a working correlation structure for observations made on members of the 83
same group. Marginal models are often preferred for analyses of population-level effects because 84
the intervention effect coefficient is interpreted as a population-averaged effect. In practice, 85
marginal models are less frequently used than conditional models.6
86
Marginal and conditional intervention effects are equal for identity and log links22 and the
87
distinction between them is only important for link functions such as the logit for binary 88
outcomes. Although some authors have advocated for the log instead of logit link for binary 89
outcomes,23 this approach is not widely used, possibly because of model convergence problems
90
for some data.24,25 Alternatively, a modified Poisson approach with log-link and robust standard
91
errors could be used in the GEE framework,26 since it does not suffer from the same convergence
problems as the binomial model with log link,27 but it may be less common because of the
93
familiarity of logistic regression among epidemiologists and biostatisticians. 94
In practice, the question about which of conditional or marginal effects are desired depends on 95
the research question. It is essential to understand the underlying assumptions of each method: 96
conditional models rely on correct specification of untestable aspects of the data distribution, 97
while marginal models rely on a correct definition of the population of interest, which can make 98
it difficult to generalize results to other populations.28 We address each of the two approaches in
99
more detail below. 100
Conditional Approaches
101
If the mixed effects model used to estimate conditional effects is misspecified, the estimates are 102
difficult to interpret and, even if regression diagnostics can help,29 standard errors (SEs) are not
103
robust. Fortunately, Murray et al.30 and Fu31 have shown that mixed models are robust to
104
substantial violation of the normality assumptions for member- and group-level errors, so long as 105
balance is maintained at the group level. Parameter estimation by restricted maximum likelihood 106
estimation (REML) is preferred to MLE when few groups are available.32-34 For binary
107
outcomes, alternative methods for specifying the test degrees of freedom have been examined in 108
small sample GRTs and the between-within method is recommended.32,35
109
Multiple Levels of Clustering in Conditional Models. GRTs may involve multiple levels of
110
clustering due to repeated measures on individuals or groups or additional hierarchical levels in 111
the design. Murray1 distinguished between mixed-effects models based on the number of
112
measurements included in the analysis and recommended mixed-effects analysis of variance 113
(ANOVA) or covariance (ANCOVA), or mixed-effects repeated measures ANOVA/ANCOVA, 114
for analyses involving 1 or 2 measurements per person or per group; those models can account 115
for all sources of random variation in such data if they are properly specified.36 However, that is
116
not the case in analyses involving 3 or more measurements per person or per group, where the 117
sources of random variation may be different; instead, such analyses require a random 118
coefficients model in which random trends and intercepts are calculated for each member (in 119
cohort GRT designs) and group (in cohort and cross-sectional GRT designs), average trends and 120
intercepts are calculated for each study arm, and the intervention effect is the net difference in 121
the average study-arm trends.36 Trends are often estimated as linear slopes, but can take another
122
form. 123
Variable Group Size in Conditional Models Johnson et al. focused on the analysis of Gaussian
124
outcomes from GRTs with variable group size.37 They compared ten model-based approaches
125
and found that a one-stage mixed model with Kenward-Roger32 degrees of freedom and
126
unconstrained variance components performed well for GRTs with 14 or more groups per study 127
arm. A two-stage model weighted by the inverse of the estimated theoretical variance of the 128
group means and with unconstrained variance components performed well for GRTs with 6 or 129
more groups per study arm. A number of other models resulted in an inflated type I error rate 130
when there was substantial variability in group size. 131
Marginal Approaches
132
When the GEE approach is used to estimate marginal effects, unbiased intervention effects can 133
be estimated even if the working correlation structure is incorrect (e.g. using robust SEs via the 134
sandwich estimator), although precision is increased if the working matrix is correct. Where 135
degrees of freedom are limited for the test of interest, as often happens in GRTs, SE estimation is 136
often biased downward and no method corrects for it in all cases, although several have been 137
proposed.38-44
Multiple Levels of Clustering in Marginal Models. While multilevel clustering is easy to account
139
for in mixed-effects regression, there is less literature for the GEE approach. The alternating 140
logistic regression approach45 for binary and ordinal outcomes can be used to account for
141
correlation due to repeated measures on individuals within groups and can be implemented 142
within a GEE framework in both R (the alr package) and SAS (PROC GEE).46 The
second-143
order GEE approach which, in contrast to regular GEE, models the working correlation structure 144
as a function of covariates, can be implemented in R (geepack in R47).48 For more general
145
working correlation matrices, the user typically needs to perform additional programming in 146
order to provide the appropriate covariance matrix and convergence may not be achieved. In 147
addition, although the intervention effect is unbiased when the marginal model is not correctly 148
specified, the SEs estimated using GEE may be too small. To correct this, a robust sandwich 149
estimator of the variance can be used but such an approach leads to loss of power.49 Because of
150
this accuracy-power trade-off, mixed-effects models may be a better option to deal with GRTs 151
involving more than two levels, although the effects estimated in such models are conditional 152
rather than marginal effects. 153
Variable Group Size in Marginal Models. Although GEE analysis can accommodate variable
154
group size, informative group size can negatively impact efficiency. In this case, Williamson et 155
al.50 showed that GEE weighted by group size can correct bias in the estimated intervention
156
effect. This approach is equivalent and less computationally demanding than within-cluster 157
resampling.51
158
Advanced GEE Approaches to Improve Efficiency. For binary outcomes, GEE is more
159
conservative (i.e. the intervention effect will be estimated closer to the null) than mixed-effects 160
models.28,52 Moreover, the SE of the estimated intervention effect is also typically larger when
using GEE so that much recent effort has focused on efficient estimation. GEE is most efficient 162
when the true correlation structure of the data is chosen as the working correlation structure. Hin 163
et al. compared multiple selection criteria for the working correlation matrix.53 An alternative
164
approach is augmented GEE (AU-GEE), a method developed for independent data using a causal 165
inference framework,54 which has been extended to clustered data.55 AU-GEE uses covariate
166
information to improve efficiency in a two-stage approach that specifies a model for the potential 167
outcomes under the treatment not received. AU-GEE is unbiased and robust to misspecification 168
of the potential outcome model, though correct specification improves efficiency. As for the 169
analysis of all trials, only baseline covariates should be included in AU-GEE for the analysis of 170
GRT data because adjustment for post-baseline covariates may lead to bias.56 Alternative
171
methods are available to account for post-baseline, time-varying confounding.57-59
172
Alternatives to GEE. The quadratic inference function (QIF) method is an alternative to GEE for
173
the estimation of marginal effects. Song et al.60 demonstrate that QIF has advantages over GEE:
174
it is more efficient and more robust to outliers; it has a goodness-of-fit test of the marginal mean 175
model and permits straightforward extensions to model selection. In large samples, QIF is more 176
efficient than GEE when the working correlation structure for the data is misspecified.61
177
However, the SEs may be under-estimated for small and medium sample size or for variable 178
group size.62 More recent work by Westgate63,64 provides improvements by using a
bias-179
corrected sandwich covariance estimate and by simultaneously selecting the QIF or GEE while 180
selecting the best working correlation structure.65 Despite the many attractive properties of QIF,
181
at this time there are few applications in public health.66-68
182
A second alternative estimation method is targeted maximum likelihood estimation (tMLE).69
183
tMLE is a maximum likelihood-based G-computation estimator that targets the fit of the data-184
generating distribution to reduce bias in the parameter of interest. It is based on a machine 185
learning approach that fluctuates an initial estimate of the conditional mean outcome and 186
minimizes a loss function to provide an estimate of the parameter of interest.70 The approach has
187
been used in public health71,72 and shows much promise for GRTs73,74 because it can improve
188
efficiency by simultaneously accounting for missing data and chance baseline covariate 189
imbalance without committing to a specific functional form.75
190
Permutation Methods
191
Permutation analysis was introduced for GRTs by Gail et al. for the COMMIT trial.76 They
192
found that the permutation test had nominal type I and II error rates across a variety of settings 193
common to GRTs, when the member-level errors were Gaussian or binomial, even when very 194
few heterogeneous groups were randomized to each study arm, and even when the ICC was 195
large, so long as there was balance at the level of the group. Murray et al.30 extended this work,
196
showing that unadjusted permutation tests offer no more protection against confounding than 197
unadjusted model-based tests, while the adjusted versions of both tests perform similarly. The 198
permutation test was more powerful than the model-based test when the data were binomial and 199
the ICC>0.01. Fu31 extended the work to heavy tailed and very skewed distributions and
200
reported similar results. 201
Li et al. compared model-based and permutation methods in the context of constrained 202
randomization adjusting for group-level covariates. They found that both the adjusted F-test and 203
permutation test maintained the nominal size and had similar power, but cautioned that the 204
randomization distribution must be calculated within the constrained randomization space to 205
prevent inflating the type I error rate.19
DEVELOPMENTS IN THE ANALYSIS OF ALTERNATIVES TO THE
207PARALLEL GRT
208 Stepped Wedge GRT 209Both between- and within-group information is available to estimate the intervention effect from 210
a stepped wedge group randomized trial (SW-GRT).77,78 However, because the control condition
211
is typically observed earlier than the intervention condition, time is a potential confounder and 212
should be accommodated in the analysis of SW-GRTs, typically by accounting for time as a 213
predictor.79 As for parallel GRTs, clustering by group must be accounted for, and longitudinal
214
measures on individuals can be accommodated within either the mixed-effects or GEE 215
framework, though more easily using mixed-effects models (see both Multiple Levels of 216
Clustering sections). Conditional approaches are more commonly used in practice and reported
217
on in the methods literature.79,80 Several authors have highlighted other characteristics specific to
218
SW-GRT including lagged intervention effects81 and fidelity loss over time.79
219
Network-Randomized GRT
220
Because the network properties of a network-randomized GRT are primarily used at the design 221
stage,82 and because they differ from regular GRTs only in the novel way in which groups are
222
defined, the theory on the analysis of parallel-arm GRTs can be applied to parallel-arm network-223
randomized GRTs.83 For example, in a ring trial of an Ebola vaccine,83 in which a network was
224
defined as all individuals who had regular physical contact with the incident (index) case of 225
Ebola and in which all contacts received the vaccine (placebo or active), standard GRT methods 226
were used. For network-randomized GRTs in which the intervention is not directly administered 227
to all individuals and in which it is expected that the intervention spreads over the network (e.g. 228
the snowball trials of a HIV prevention intervention for drug users84 or a microfinance
intervention85), methods86,87 are available to estimate both the direct and indirect effects of the
230
intervention. When network information is available and the outcome of interest is known to be a 231
disseminated process, adjusting for network features such as information on the location of each 232
individual within the network (i.e. group) can improve both the efficiency and power of the 233
analysis.88
234
Pseudo-Cluster Randomized Trial
235
Teerenstra et al.89 compared analytic methods for continuous outcomes in pseudo-cluster
236
randomized trials (PCRT) and Campbell and Walters discussed principles in their recent 237
textbook.5 Clustering by the unit of randomization at the first stage (e.g. provider) must be
238
accounted for in both the design and analysis of PCRT. No explicit sample size or analytic 239
methods are known to be available for non-continuous outcomes. 240
Individually Randomized Group Treatment Trial
241
Baldwin et al. compared four analytic models for IRGTs and three methods for calculating 242
degrees of freedom.90 A multilevel model adapted to reflect clustering in only one study arm,
243
combined with either Satterthwaite91 or Kenward-Roger32 degrees of freedom, provided better
244
type I error control, better efficiency, and less bias, even with heteroscedasticity at the member 245
level. This finding is consistent with earlier reports by Pals et al.92 and Roberts et al.93 More
246
recently, Roberts & Walwyn94 and Andridge et al.95 considered the circumstance in which
247
members are associated with more than one small group or change agent. Both found that 248
ignoring membership in multiple groups further inflates the type I error rate. Roberts & Walwyn 249
reported that multiple member multilevel models maintained the nominal type I error rate; they 250
also provide sample size and power formulae.94
251
DEVELOPMENTS TO ADDRESS DATA CHALLENGES
252Missing Outcome Data
253
Two recent reviews6,96 indicate that missing outcome data is common in GRTs, though
254
investigators frequently analyze only available data without accounting for the missing data 255
pattern. When the covariate-dependent missingness (CDM) assumption is plausible, both mixed 256
effects and GEE models provide unbiased estimates of the intervention effect when the CDM 257
covariates are included in an analysis of all available data.97,98 AU-GEE also can provide
258
unbiased effects by including all CDM covariates in the augmentation component55 and has the
259
advantage that all estimates can still be interpreted as marginal effects. Other two-stage 260
approaches such as multiple imputation (MI) or inverse probability weighting (IPW) can provide 261
unbiased intervention effects under certain conditions for more general missing at random 262
(MAR) patterns and may provide increased precision compared to covariate-adjusted conditional 263
or marginal models for CDM.97,99 Although there is less literature on how to deal with missing
264
not-at-random (MNAR) data,100 sensitivity analyses are recommended.101 A recent review
265
showed that very few GRTs performed any sensitivity analyses for their missing data 266
assumptions.6
267
To avoid possible type I error, MI should account for the clustered data structure.102,103 Fixed
268
group effects should not be used due to reduced power.104 For binary outcomes, Ma et al.105 and
269
Caille et al.106 show that the preferred MI method depends on the number of groups and the
270
design effect, and note that bias may arise for some approaches even for CDM missingness. 271
Using group-specific mean imputation may be adequate for continuous outcomes.98,102 Hossain
272
et al.98 show that if the missing data mechanism has an interaction between a covariate predictive
273
of the outcome and study arm, the imputation strategy must account for this interaction to be 274
unbiased. 275
Whereas MI requires specifying the distribution of the missing data conditional on covariates, 276
IPW requires specifying the probability of being missing depending on covariates. Theoretically, 277
both approaches can be used for any type of outcome and for both CDM and more general forms 278
of MAR mechanisms.99 While IPW requires an additional assumption of positivity (all
279
participants have a non-zero probability of being observed), it may be viewed as easier to define, 280
particularly in the presence of non-intermittent missingness.107 Importantly, and as for MI, if the
281
missing data mechanism has an interaction between a covariate predictive of the outcome and 282
study arm, the weights must be generated by accounting for this interaction in order to be 283
unbiased.108 Prague et al.109,110 developed a doubly robust estimator in the context of IPW, which
284
provides an unbiased estimate if either the marginal mean model or the missing data model is 285
correctly specified. They demonstrated that a doubly-robust augmented GEE approach can 286
simultaneously account for both CDM and baseline covariate imbalance in GRTs when the 287
parameter of interest is a marginal effect. Combining MI and IPW is a promising new approach 288
which may have superior performance to IPW or MI alone when there are missing covariates in 289
addition to missing outcomes.111
290
Baseline Imbalance of Covariates
291
While design strategies such as restricted randomization8 can help to achieve baseline covariate
292
balance, they may not be easy to implement (e.g. if group characteristics are unknown in 293
advance) and chance imbalance may arise regardless. In this case, some form of model-based 294
covariate adjustment could be used such as standard multivariate regression for conditional 295
models or AU-GEE for marginal models.55 The advantage of AU-GEE in this case is that it is
296
doubly robust in that the consistency of intervention effect estimate requires correct specification 297
of either the marginal mean structure or the treatment model, and it separates covariate 298
adjustment from intervention effect estimation thereby reducing the risk of choosing the 299
adjustment models to obtain the most significant results. The standard multivariate regression 300
adjustment approach does not enjoy either of these benefits. 301
Alternatively, Hansen and Bowers112 proposed a balancing criterion and studied its
302
randomization distribution in order to simultaneously test for balance of multiple covariates in 303
both RCTs and GRTs. Leyrat et al.113 suggested to use the c-statistic of the propensity score
304
model to measure covariate balance at the individual level. Leon et al.114 recommended
305
propensity score matching to correct for baseline imbalance; in a simulation study, they report a 306
median 90% reduction in bias. Nevertheless, the Consolidated Standards for Reporting of Trials 307
(CONSORT)115 recommends that the adjustment covariates be specified a priori for primary
308
analyses so that secondary analyses could test sensitivity of the primary findings to adjustment 309
for covariates identified post hoc. 310
Software
311
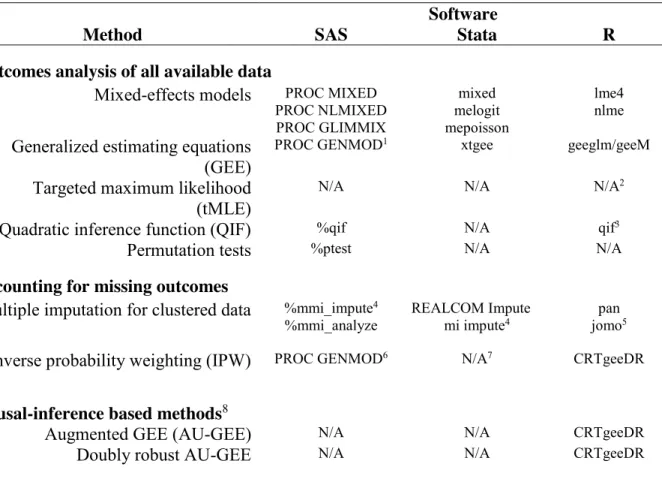
Table 1 identifies three software programs that can be used to analyze data from GRTs. The 312
table is organized around topics considered in the current paper. While none of the three software 313
programs can readily implement both QIF and tMLE for GRTs, the R program offers the most 314
ready-to-use functionality given its broad applicability to the methods cited in the current paper. 315
[TABLE 1 ABOUT HERE.] 316
REPORTING OF RESULTS
317The CONSORT guidelines for individually randomized trials were extended to GRTs in 2004115
318
and most journals now require authors to conform to these guidelines. Based on a review of 300 319
GRTs published between 2000-2008, Ivers et al. reported that 60% and 70% accounted for 320
clustering in the sample size calculation and in the analysis, respectively, 56% used restricted 321
randomization, and most (86%) allocated more than 4 groups per arm.14 A more recent review
322
of 86 trials published in 2013-2014 showed that 77% and 78% accounted for clustering in the 323
sample size calculation and in the analysis, respectively, and that 51% used some form of 324
restricted randomization.15
325
Given concerns about the ethical conduct of GRTs,116,117 recent reports on conduct and reporting
326
have focused on the ethics of GRTs. For example, Sim and Dawson discuss the challenges 327
associated with obtaining informed consent in GRTs.118 The Ottawa Statement on the ethical
328
design and conduct of GRTs was published in 2012119 with a reevaluation in 2015.120
329
DISCUSSION
330In this review, we have summarized many of the most important advances in the analysis of 331
GRTs during the 13 years since the publication of the earlier review by Murray et al.7 Many of
332
these developments have focused on developments in marginal model parameter estimation (e.g. 333
augmented GEE, QIF and tMLE) and missing data methods. Some topics that space limitations 334
have prevented include review of recent developments in survival outcomes,2,121-125 measurement
335
bias,126,127 validity,128,129 Bayesian methods,4,130-132 cost-effectiveness analyses4,133-136 and
336
mediation analyses to uncover mechanisms of action.137-140
337
Through this review, we have sought to ensure that the reader is reminded of the value of well-338
thought out analysis of GRTs and of keeping up to date with the many recent developments in 339
this area. Pairing this knowledge with our companion review of developments in the design of 340
GRTs,8 we hope that our review leads to continued improvements in the design and analysis of
341
GRTs. 342
APPENDIX: GLOSSARY
343Augmented GEE: “Augmenting the standard GEE with a function of baseline covariates.”55
344
These methods adapt semiparametric theory developed by Robins141 and Robins, Rotnitzky, and
345
Zhao142 for observational studies with time-varying exposures and missing data problems,
346
respectively. They consist of leveraging the estimating equation by a predictor function for 347
counterfactual outcomes under the intervention not received by the group/cluster considered 348
missing. 55
349
Baseline covariate balance: The group-level and individual-level covariate distributions are
350
similar in all study arms.11
351
Choice of balancing criterion: Li et al. describe several balancing criteria to assess how well a
352
GRT is balanced across covariates. These include the “best balance” (BB) metric of de Hoop et 353
al.,143 the balance criterion (B) of Raab and Butcher,11 and the total balance score introduced by
354
Li et al.19
355
Coefficient of variation: A measure of between-group variation, defined in Table 1 of our
356
companion paper.8
357
Cohort GRT design: A cohort of individuals is enrolled at baseline and those same individuals
358
are followed up over time. 359
Constrained randomization: Refers “to those designs that go beyond the basic design
360
constraints to specify classes of randomization outcomes that satisfy certain balancing criteria, 361
while retaining validity of the design.”144
362
Cross-sectional GRT design: A different set of individuals is obtained at each time point.
363
Designed balance at the group level: When there are equal numbers of groups randomized to
Intraclass correlation: A measure of between-group variation, defined in Table 1 of our
366
companion paper.8
367
Covariate-dependent missingness (CDM) assumption: The assumption that “missingness in
368
outcomes depends on covariates measured at baseline, but not on the outcome itself.”98
369
Doubly-robust augmented GEE approach: Combining augmented GEE and IPW, a
doubly-370
robust estimator is obtained, which provides an unbiased estimate if either the marginal mean 371
model or the missing data model is correctly specified.109,110
372
Equivalence: Assessing whether the new intervention is equivalent to the comparison
373
intervention. 374
G-computation estimator: A computational method to estimate causal effect in structural
375
nested models. These models are designed to deal with confounding by variables affected by 376
intervention.145
377
Individually Randomized Group Treatment Trials: “Studies that randomize individuals to
378
study arms but deliver treatments in small groups or through a common change agent.”8,92
379
Informative cluster size: When the outcome measured is related to the size of the cluster.50
380
Missing at Random (MAR) assumption: Rubin’s (1976) definition is that “data are missing at
381
random if for each possible value of the parameter φ [the parameter of the conditional 382
distribution of the missing data indicator given the data], the conditional probability of the 383
observed pattern of missing data, given the missing data and the value of the observed data, is 384
the same for all possible values of the missing data.”146
385
Network-Randomized GRT: “The network-randomized GRT is a novel design that uses
386
network information to address the challenge of potential contamination in GRTs of infectious 387
diseases.”8,82,84,147
Non-inferiority: When a trial is designed to show that the new intervention is not worse than
389
the comparison intervention. 390
On treatment analyses: When groups are analyzed “according to the intervention they actually
391
received.”2
392
Per protocol analyses: When groups “not receiving the correct intervention are excluded.”2
393
Pseudo-cluster randomized trial: Intervention is allocated to individuals in a two-stage
394
process. “In the first stage, providers are randomized to a patient allocation-mix…. In the 395
second stage, patients recruited to the PCRT are individually randomized to intervention or 396
control according to the allocation probability of their provider.”8
397
Stepped Wedge GRT: “A one-directional crossover GRT in which time is divided into intervals
398
and in which all groups eventually receive the intervention.”8,78
399
Superiority: When a trial is designed to establish whether a new intervention is superior to the
400
comparison intervention (e.g., another drug, a placebo, enhanced usual care). However, the 401
statistical test is still two-sided, allowing for the possibility that the new intervention is actually 402
worse than the comparison. 403
Within-cluster resampling: Randomly sample one observation from each cluster, with
404
replacement. Then analyze this resampled dataset. Repeat this process a large number of times. 405
“The within-cluster resampling estimator is constructed as the average” of all of the resample-406
based estimates (see Hoffman et al.51 pp. 1122-3).
407
ACKNOWLEDGEMENTS
408Removed to avoid unblinding during the review process. 409
CONTRIBUTORS
410Removed to avoid unblinding during the review process. 411
HUMAN PARTICIPANT PROTECTION
412No human subjects participated in this research therefore no IRB approval was sought. 413
REFERENCES
References 414415
1. Murray DM. Design and Analysis of Group-Randomized Trials. New York, NY: Oxford University 416
Press; 1998. 417
2. Hayes RJ, Moulton LH. Cluster Randomised Trials. Boca Raton: CRC Press; 2009. 418
3. Donner A, Klar N. Design and Analysis of Cluster Randomization Trials in Health Research. 419
London: Arnold; 2000. 420
4. Eldridge S, Kerry S. A Practical Guide to Cluster Randomised Trials in Health Services Research. 421
Vol 120: John Wiley & Sons; 2012. 422
5. Campbell MJ, Walters SJ. How to Design, Analyse and Report Cluster Randomised Trials in 423
Medicine and Health Related Research. Chichester, West Sussex: John Wiley & Sons; 2014. 424
6. Fiero MH, Huang S, Oren E, Bell ML. Statistical analysis and handling of missing data in cluster 425
randomized trials: a systematic review. Trials. 2016;17(1):72. 426
7. Murray DM, Varnell SP, Blitstein JL. Design and analysis of group-randomized trials: a review of 427
recent methodological developments. Am J Public Health. 2004;94(3):423-432. 428
8. Turner EL, Li F, Gallis JA, Prague M, Murray DM. Review of Recent Methodological 429
Developments in Group-Randomized Trials: Part 1 - Design. Am J Public Health. Submitted. 430
9. Rutterford C, Copas A, Eldridge S. Methods for sample size determination in cluster randomized 431
trials. Int J Epidemiol. 2015;44(3):1051-1067. 432
10. Jo B, Asparouhov T, Muthén BO. Intention-to-treat analysis in cluster randomized trials with 433
noncompliance. Stat Med. 2008;27(27):5565. 434
11. Raab GM, Butcher I. Balance in cluster randomized trials. Stat Med. 2001;20(3):351-365. 435
12. Varnell SP, Murray DM, Janega JB, Blitstein JL. Design and analysis of group-randomized trials: a 436
review of recent practices. Am J Public Health. 2004;94(3):393-399. 437
13. Murray DM, Pals SP, Blitstein JL, Alfano CM, Lehman J. Design and analysis of group-randomized 438
trials in cancer: a review of current practices. J Natl Cancer Inst. 2008;100(7):483-491. 439
14. Ivers NM, Halperin IJ, Barnsley J, et al. Allocation techniques for balance at baseline in cluster 440
randomized trials: a methodological review. Trials. 2012;13:120. 441
15. Fiero M, Huang S, Bell ML. Statistical analysis and handling of missing data in cluster randomised 442
trials: protocol for a systematic review. BMJ Open. 2015;5(5):e007378. 443
16. Diehr P, Martin DC, Koepsell T, Cheadle A. Breaking the matches in a paired t-test for community 444
interventions when the number of pairs is small. Stat Med. 1995;14(13):1491-1504. 445
17. Proschan MA. On the distribution of the unpaired t-statistic with paired data. Stat Med. 446
1996;15(10):1059-1063. 447
18. Donner A, Taljaard M, Klar N. The merits of breaking the matches: a cautionary tale. Stat Med. 448
2007;26(9):2036-2051. 449
19. Li F, Lokhnygina Y, Murray DM, Heagerty PJ, DeLong ER. An evaluation of constrained 450
randomization for the design and analysis of group-randomized trials. Stat Med. 451
2015;35(10):1565-1579. 452
20. Liang KY, Zeger SL. Longitudinal data analysis using generalized linear models. Biometrika. 453
1986;73(1):13-22. 454
21. Zeger SL, Liang K-Y. Longitudinal data analysis for discrete and continuous outcomes. Biometrics. 455
1986;42(1):121-130. 456
22. Ritz J, Spiegelman D. Equivalence of conditional and marginal regression models for clustered 457
and longitudinal data. Stat Methods Med Res. 2004;13(4):309-323. 458
23. Greenland S. Interpretation and choice of effect measures in epidemiologic analyses. Am J 459
Epidemiol. 1987;125(5):761-768. 460
24. Blizzard L, Hosmer W. Parameter Estimation and Goodness‐of‐Fit in Log Binomial Regression. 461
Biom J. 2006;48(1):5-22. 462
25. Williamson T, Eliasziw M, Fick GH. Log-binomial models: exploring failed convergence. Emerging 463
themes in epidemiology. 2013;10(1):1-10. 464
26. Zou G, Donner A. Extension of the modified Poisson regression model to prospective studies 465
with correlated binary data. Stat Methods Med Res. 2013;22(6):661-670. 466
27. Yelland LN, Salter AB, Ryan P. Performance of the modified Poisson regression approach for 467
estimating relative risks from clustered prospective data. Am J Epidemiol. 2011;174(8):984-992. 468
28. Hubbard AE, Ahern J, Fleischer NL, et al. To GEE or not to GEE: comparing population average 469
and mixed models for estimating the associations between neighborhood risk factors and 470
health. Epidemiology. 2010;21(4):467-474. 471
29. Huang X. Diagnosis of Random‐Effect Model Misspecification in Generalized Linear Mixed 472
Models for Binary Response. Biometrics. 2009;65(2):361-368. 473
30. Murray DM, Hannan PJ, Varnell SP, McCowen RG, Baker WL, Blitstein JL. A comparison of 474
permutation and mixed-model regression methods for the analysis of simulated data in the 475
context of a group-randomized trial. Stat Med. 2006;25(3):375-388. 476
31. Fu D. A comparison study of general linear mixed moedl and permutation tests in group-477
randomized trials under non-normal error distributions [Dissertation]. Memphis: Statistics, 478
University of Memphis; 2006. 479
32. Kenward MG, Roger JH. Small sample inference for fixed effects from restricted maximum 480
likelihood. Biometrics. 1997;53(3):983-997. 481
33. Localio AR, Berlin JA, Have TRT. Longitudinal and repeated cross‐sectional cluster‐randomization 482
designs using mixed effects regression for binary outcomes: bias and coverage of frequentist 483
and Bayesian methods. Stat Med. 2006;25(16):2720-2736. 484
34. Pinheiro JC, Bates DM. Mixed-effects models in S and S-PLUS. New York: Springer; 2000. 485
35. Li P, Redden DT. Comparing denominator degrees of freedom approximations for the 486
generalized linear mixed model in analyzing binary outcome in small sample cluster-randomized 487
trials. BMC Med Res Methodol. 2015;15(1):38. 488
36. Murray DM, Hannan PJ, Wolfinger RD, Baker WL, Dwyer JH. Analysis of data from group-489
randomized trials with repeat observations on the same groups. Stat Med. 1998;17(14):1581-490
1600. 491
37. Johnson JL, Kreidler SM, Catellier DJ, Murray DM, Muller KE, Glueck DH. Recommendations for 492
choosing an analysis method that controls Type I error for unbalanced cluster sample designs 493
with Gaussian outcomes. Stat Med. 2015;34(27):3531-3545. 494
38. McNeish D, Stapleton LM. Modeling clustered data with very few clusters. Multivariate Behav 495
Res. 2016;51(4):495-518. 496
39. Li P, Redden DT. Small sample performance of bias‐corrected sandwich estimators for cluster‐ 497
randomized trials with binary outcomes. Stat Med. 2015;34(2):281-296. 498
40. Fay MP, Graubard BI. Small‐Sample Adjustments for Wald‐Type Tests Using Sandwich 499
Estimators. Biometrics. 2001;57(4):1198-1206. 500
41. Mancl LA, DeRouen TA. A covariance estimator for GEE with improved small‐sample properties. 501
Biometrics. 2001;57(1):126-134. 502
42. Morel J, Bokossa M, Neerchal N. Small sample correction for the variance of GEE estimators. 503
Biom J. 2003;45(4):395-409. 504
43. Preisser JS, Lu B, Qaqish BF. Finite sample adjustments in estimating equations and covariance 505
estimators for intracluster correlations. Stat Med. 2008;27(27):5764-5785. 506
44. Pan W, Wall MM. Small-sample adjustments in using the sandwich variance estimator in 507
45. Carey V, Zeger SL, Diggle P. Modelling multivariate binary data with alternating logistic 509
regressions. Biometrika. 1993;80(3):517-526. 510
46. By K, Qaqish BF, Preisser JS, Perin J, Zink RC. ORTH: R and SAS software for regression models of 511
correlated binary data based on orthogonalized residuals and alternating logistic regressions. 512
Comput Methods Programs Biomed. 2014;113(2):557-568. 513
47. Halekoh U, Højsgaard S, Yan J. The R package geepack for generalized estimating equations. 514
Journal of Statistical Software. 2006;15(2):1-11. 515
48. Crespi CM, Wong WK, Mishra SI. Using second‐order generalized estimating equations to model 516
heterogeneous intraclass correlation in cluster‐randomized trials. Stat Med. 2009;28(5):814-827. 517
49. Teerenstra S, Lu B, Preisser JS, van Achterberg T, Borm GF. Sample size considerations for GEE 518
analyses of three-level cluster randomized trials. Biometrics. 2010;66(4):1230-1237. 519
50. Williamson JM, Datta S, Satten GA. Marginal analyses of clustered data when cluster size is 520
informative. Biometrics. 2003;59(1):36-42. 521
51. Hoffman EB, Sen PK, Weinberg CR. Within-cluster resampling. Biometrika. 2001;88(4):1121-522
1134. 523
52. Neuhaus JM, Kalbfleisch JD, Hauck WW. A comparison of cluster-specific and population-524
averaged approaches for analyzing correlated binary data. Int Stat Rev. 1991;59(1):25-35. 525
53. Hin L-Y, Carey VJ, Wang Y-G. Criteria for working–correlation–structure selection in GEE: 526
Assessment via simulation. Am Stat. 2007;61(4):360-364. 527
54. Tsiatis AA, Davidian M, Zhang M, Lu X. Covariate adjustment for two‐sample treatment 528
comparisons in randomized clinical trials: A principled yet flexible approach. Stat Med. 529
2008;27(23):4658-4677. 530
55. Stephens AJ, Tchetgen Tchetgen EJ, Gruttola VD. Augmented generalized estimating equations 531
for improving efficiency and validity of estimation in cluster randomized trials by leveraging 532
cluster-level and individual-level covariates. Stat Med. 2012;31(10):915-930. 533
56. Richiardi L, Bellocco R, Zugna D. Mediation analysis in epidemiology: methods, interpretation 534
and bias. Int J Epidemiol. 2013;42(5):1511-1519. 535
57. Robins JM, Rotnitzky A, Zhao LP. Analysis of semiparametric regression models for repeated 536
outcomes in the presence of missing data. J Am Stat Assoc. 1995;90(429):106-121. 537
58. Robins JM, Greenland S, Hu F-C. Estimation of the causal effect of a time-varying exposure on 538
the marginal mean of a repeated binary outcome. J Am Stat Assoc. 1999;94(447):687-700. 539
59. Miglioretti DL, Heagerty PJ. Marginal modeling of multilevel binary data with time‐varying 540
covariates. Biostatistics. 2004;5(3):381-398. 541
60. Song PXK, Jiang Z, Park E, Qu A. Quadratic inference functions in marginal models for 542
longitudinal data. Stat Med. 2009;28(29):3683-3696. 543
61. Khajeh-Kazemi R, Golestan B, Mohammad K, Mahmoudi M, Nedjat S, Pakravan M. Comparison 544
of Generalized Estimating Equations and Quadratic Inference Functions in superior versus 545
inferior Ahmed Glaucoma Valve implantation. J Res Med Sci. 2011;16(3):235-244. 546
62. Westgate PM, Braun TM. The effect of cluster size imbalance and covariates on the estimation 547
performance of quadratic inference functions. Stat Med. 2012;31(20):2209-2222. 548
63. Westgate PM. A bias‐corrected covariance estimate for improved inference with quadratic 549
inference functions. Stat Med. 2012;31(29):4003-4022. 550
64. Westgate PM. A covariance correction that accounts for correlation estimation to improve 551
finite-sample inference with generalized estimating equations: a study on its applicability with 552
structured correlation matrices. J Stat Comput Simul. 2016;86(10):1891-1900. 553
65. Westgate PM. Criterion for the simultaneous selection of a working correlation structure and 554
either generalized estimating equations or the quadratic inference function approach. Biom J. 555
66. Asgari F, Biglarian A, Seifi B, Bakhshi A, Miri HH, Bakhshi E. Using quadratic inference functions 557
to determine the factors associated with obesity: findings from the STEPS Survey in Iran. Ann 558
Epidemiol. 2013;23(9):534-538. 559
67. Bakhshi E, Etemad K, Seifi B, Mohammad K, Biglarian A, Koohpayehzadeh J. Changes in Obesity 560
Odds Ratio among Iranian Adults, since 2000: Quadratic Inference Functions Method. Comput 561
Math Methods Med. 2016;2016:1-7. 562
68. Yang K, Tao L, Mahara G, et al. An association of platelet indices with blood pressure in Beijing 563
adults: Applying quadratic inference function for a longitudinal study. Medicine (Baltimore). 564
2016;95(39):e4964. 565
69. Van der Laan MJ, Robins JM. Unified methods for censored longitudinal data and causality. 566
Springer Science & Business Media; 2003. 567
70. Gruber S, van der Laan MJ. A targeted maximum likelihood estimator of a causal effect on a 568
bounded continuous outcome. Int J Biostat. 2010;6(1):1-18. 569
71. Kotwani P, Balzer L, Kwarisiima D, et al. Evaluating linkage to care for hypertension after 570
community‐based screening in rural Uganda. Trop Med Int Health. 2014;19(4):459-468. 571
72. Ahern J, Karasek D, Luedtke AR, Bruckner TA, van der Laan MJ. Racial/ethnic differences in the 572
role of childhood adversities for mental disorders among a nationally representative sample of 573
adolescents. Epidemiology. 2016;27(5):697-704. 574
73. Balzer LB, Petersen ML, van der Laan MJ. Targeted estimation and inference for the sample 575
average treatment effect in trials with and without pair-matching. Stat Med. 2016;35(21):3717-576
3732. 577
74. Schnitzer ME, van der Laan MJ, Moodie EE, Platt RW. Effect of breastfeeding on gastrointestinal 578
infection in infants: a targeted maximum likelihood approach for clustered longitudinal data. 579
Ann Appl Stat. 2014;8(2):703-725. 580
75. Van der Laan MJ, Polley EC, Hubbard AE. Super learner. Stat Appl Genet Mol Biol. 2007;6(1). 581
76. Gail MH, Mark SD, Carroll RJ, Green SB, Pee D. On design considerations and randomization-582
based inference for community intervention trials. Stat Med. 1996;15(11):1069-1092. 583
77. Hemming K, Haines TP, Chilton PJ, Girling AJ, Lilford RJ. The stepped wedge cluster randomised 584
trial: rationale, design, analysis, and reporting. BMJ. 2015;350:h391. 585
78. Spiegelman D. Evaluating public health interventions: 2. Stepping up to routine public health 586
evaluation with the stepped wedge design. Am J Public Health. 2016;106(3):453-457. 587
79. Davey C, Hargreaves J, Thompson JA, et al. Analysis and reporting of stepped wedge randomised 588
controlled trials: synthesis and critical appraisal of published studies, 2010 to 2014. Trials. 589
2015;16(1):358. 590
80. Mdege ND, Man M-S, Taylor CA, Torgerson DJ. Systematic review of stepped wedge cluster 591
randomized trials shows that design is particularly used to evaluate interventions during routine 592
implementation. J Clin Epidemiol. 2011;64(9):936-948. 593
81. Copas AJ, Lewis JJ, Thompson JA, Davey C, Baio G, Hargreaves JR. Designing a stepped wedge 594
trial: three main designs, carry-over effects and randomisation approaches. Trials. 595
2015;16(1):352. 596
82. Harling G, Wang R, Onnela J, De Gruttola V. Leveraging contact network structure in the design 597
of cluster randomized trials. Clin Trials. 2016 [Epub ahead of print]. 598
83. Ebola ça Suffit Ring Vaccination Trial Consortium. The ring vaccination trial: a novel cluster 599
randomised controlled trial design to evaluate vaccine efficacy and effectiveness during 600
outbreaks, with special reference to Ebola. BMJ. 2015;351:h3740. 601
84. Latkin C, Donnell D, Liu TY, Davey‐Rothwell M, Celentano D, Metzger D. The dynamic 602
relationship between social norms and behaviors: the results of an HIV prevention network 603
85. Banerjee A, Chandrasekhar AG, Duflo E, Jackson MO. The diffusion of microfinance. Science. 605
2013;341(6144). 606
86. Ogburn EL, VanderWeele TJ. Causal diagrams for interference. Stat Sci. 2014;29(4):559-578. 607
87. VanderWeele TJ, Tchetgen EJT, Halloran ME. Components of the indirect effect in vaccine trials: 608
identification of contagion and infectiousness effects. Epidemiology. 2012;23(5):751. 609
88. Staples P, Prague M, Victor DG, Onnela J-P. Leveraging Contact Network Information in 610
Clustered Randomized Trials of Infectious Processes. arXiv preprint arXiv:1610.00039. 2016. 611
89. Teerenstra S, Moerbeek M, Melis RJ, Borm GF. A comparison of methods to analyse continuous 612
data from pseudo cluster randomized trials. Stat Med. 2007;26(22):4100-4115. 613
90. Baldwin SA, Bauer DJ, Stice E, Rohde P. Evaluating models for partially clustered designs. 614
Psychological Methods. 2011;16(2):149-165. 615
91. Satterthwaite FE. An approximate distribution of estimates of variance components. Biometrics. 616
1946;2(6):110-114. 617
92. Pals SP, Murray DM, Alfano CM, Shadish WR, Hannan PJ, Baker WL. Individually randomized 618
group treatment trials: a critical appraisal of frequently used design and analytic approaches. 619
Am J Public Health. 2008;98(8):1418-1424. 620
93. Roberts C, Roberts SA. Design and analysis of clinical trials with clustering effects due to 621
treatment. Clin Trials. 2005;2(2):152-162. 622
94. Roberts C, Walwyn R. Design and analysis of non-pharmacological treatment trials with multiple 623
therapists per patient. Stat Med. 2013;32(1):81-98. 624
95. Andridge RR, Shoben AB, Muller KE, Murray DM. Analytic methods for individually randomized 625
group treatment trials and group-randomized trials when subjects belong to multiple groups. 626
Stat Med. 2014;33(13):2178-2190. 627
96. Díaz-Ordaz K, Kenward MG, Cohen A, Coleman CL, Eldridge S. Are missing data adequately 628
handled in cluster randomised trials? A systematic review and guidelines. Clin Trials. 629
2014;11(5):590-600. 630
97. DeSouza CM, Legedza AT, Sankoh AJ. An overview of practical approaches for handling missing 631
data in clinical trials. J Biopharm Stat. 2009;19(6):1055-1073. 632
98. Hossain A, Diaz-Ordaz K, Bartlett JW. Missing continuous outcomes under covariate dependent 633
missingness in cluster randomised trials. Stat Methods Med Res. 2016. 634
99. Seaman SR, White IR. Review of inverse probability weighting for dealing with missing data. Stat 635
Methods Med Res. 2013;22(3):278-295. 636
100. Vansteelandt S, Rotnitzky A, Robins J. Estimation of regression models for the mean of repeated 637
outcomes under nonignorable nonmonotone nonresponse. Biometrika. 2007;94(4):841-860. 638
101. Thabane L, Mbuagbaw L, Zhang S, et al. A tutorial on sensitivity analyses in clinical trials: the 639
what, why, when and how. BMC Med Res Methodol. 2013;13(1):92. 640
102. Taljaard M, Donner A, Klar N. Imputation strategies for missing continuous outcomes in cluster 641
randomized trials. Biom J. 2008;50(3):329-345. 642
103. Ma J, Akhtar-Danesh N, Dolovich L, Thabane L. Imputation strategies for missing binary 643
outcomes in cluster randomized trials. BMC Med Res Methodol. 2011;11(1):18. 644
104. Andridge RR. Quanitfying the impact of fixed effects modeling of clusters in multiple imputation 645
for cluster randomized trials. Biom J. 2011;53(1):57-74. 646
105. Ma J, Raina P, Beyene J, Thabane L. Comparing the performance of different multiple imputation 647
strategies for missing binary outcomes in cluster randomized trials: a simulation study. J Open 648
Access Med Stat. 2012;2:93-103. 649
106. Caille A, Leyrat C, Giraudeau B. A comparison of imputation strategies in cluster randomized 650
trials with missing binary outcomes. Stat Methods Med Res. 2016;25(6):2650-2669. 651
107. Seaman S, Galati J, Jackson D, Carlin J. What is meant by “missing at random”? Stat Sci. 652
2013;28(2):257-268. 653
108. Belitser SV, Martens EP, Pestman WR, Groenwold RH, Boer A, Klungel OH. Measuring balance 654
and model selection in propensity score methods. Pharmacoepidemiol Drug Saf. 655
2011;20(11):1115-1129. 656
109. Prague M, Wang R, De Gruttola V. CRTgeeDR: An R Package for Doubly Robust Generalized 657
Estimating Equations Estimations in Cluster Randomized Trials with Missing Data. Harvard 658
University Biostatistics Working Paper Series: Harvard University; 2016. 659
110. Prague M, Wang R, Stephens A, Tchetgen Tchetgen E, DeGruttola V. Accounting for interactions 660
and complex inter‐subject dependency in estimating treatment effect in cluster‐randomized 661
trials with missing outcomes. Biometrics. 2016;72(4):1066-1077. 662
111. Seaman SR, White IR, Copas AJ, Li L. Combining multiple imputation and inverse‐probability 663
weighting. Biometrics. 2012;68(1):129-137. 664
112. Hansen BB, Bowers J. Covariate Balance in Simple, Stratified and Clustered Comparative Studies. 665
Stat Sci. 2008;23(2):219-236. 666
113. Leyrat C, Caille A, Foucher Y, Giraudeau B. Propensity score to detect baseline imbalance in 667
cluster randomized trials: the role of the c-statistic. BMC Med Res Methodol. 2016;16(1):9. 668
114. Leon AC, Demirtas H, Li C, Hedeker D. Subject‐level matching for imbalance in cluster 669
randomized trials with a small number of clusters. Pharm Stat. 2013;12(5):268-274. 670
115. Campbell MK, Elbourne DR, Altman DG. CONSORT statement: extension to cluster randomised 671
trials. Br Med J. 2004;328(7441):702-708. 672
116. Hutton JL. Are distinctive ethical principles required for cluster randomized controlled trials? 673
Stat Med. 2001;20(3):473-488. 674
117. Taljaard M, Chaudhry SH, Brehaut JC, et al. Survey of consent practices in cluster randomized 675
trials: improvements are needed in ethical conduct and reporting. Clin Trials. 2014;11(1):60-69. 676
118. Sim J, Dawson A. Informed consent and cluster-randomized trials. Am J Public Health. 677
2012;102(3):480-485. 678
119. Weijer C, Grimshaw JM, Eccles MP, et al. The Ottawa statement on the ethical design and 679
conduct of cluster randomized trials. PLoS Med. 2012;9(11). 680
120. van der Graaf R, Koffijberg H, Grobbee DE, et al. The ethics of cluster-randomized trials requires 681
further evaluation: a refinement of the Ottawa Statement. J Clin Epidemiol. 2015;68(9):1108-682
1114. 683
121. Zeng D, Lin D, Lin X. Semiparametric transformation models with random effects for clustered 684
failure time data. Stat Sin. 2008;18(1):355-377. 685
122. Cai T, Cheng S, Wei L. Semiparametric mixed-effects models for clustered failure time data. J Am 686
Stat Assoc. 2002;97(458):514-522. 687
123. Zhong Y, Cook RJ. Sample size and robust marginal methods for cluster‐randomized trials with 688
censored event times. Stat Med. 2015;34(6):901-923. 689
124. Zhan Z, de Bock GH, Wiggers T, Heuvel E. The analysis of terminal endpoint events in stepped 690
wedge designs. Stat Med. 2016;35(24):4413-4426. 691
125. Xu Z. Statistical Design and Survival Analysis in Cluster Randomized Trials [Dissertation], The 692
University of Michigan; 2011. 693
126. Kramer MS, Martin RM, Sterne JA, Shapiro S, Dahhou M, Platt RW. The double jeopardy of 694
clustered measurement and cluster randomisation. BMJ. 2009;339. 695
127. Cho S-J, Preacher KJ. Measurement Error Correction Formula for Cluster-Level Group Differences 696
in Cluster Randomized and Observational Studies. Educ Psychol Meas. 2016;76(5):771-786. 697
128. Eldridge S, Ashby D, Bennett C, Wakelin M, Feder G. Internal and external validity of cluster 698
129. Caille A, Kerry S, Tavernier E, Leyrat C, Eldridge S, Giraudeau B. Timeline cluster: a graphical tool 700
to identify risk of bias in cluster randomised trials. BMJ. 2016;354. 701
130. Ma J, Thabane L, Kaczorowski J, et al. Comparison of Bayesian and classical methods in the 702
analysis of cluster randomized controlled trials with a binary outcome: the Community 703
Hypertension Assessment Trial (CHAT). BMC Med Res Methodol. 2009;9(1):37. 704
131. Grieve R, Nixon R, Thompson SG. Bayesian hierarchical models for cost-effectiveness analyses 705
that use data from cluster randomized trials. Med Decis Making. 2010;30(2):163-175. 706
132. Clark AB, Bachmann MO. Bayesian methods of analysis for cluster randomized trials with count 707
outcome data. Stat Med. 2010;29(2):199-209. 708
133. Gomes M, Ng ES-W, Grieve R, Nixon R, Carpenter J, Thompson SG. Developing appropriate 709
methods for cost-effectiveness analysis of cluster randomized trials. Med Decis Making. 710
2012;32(2):350-361. 711
134. Díaz-Ordaz K, Kenward M, Gomes M, Grieve R. Multiple imputation methods for bivariate 712
outcomes in cluster randomised trials. Stat Med. 2016;35(20):3482-3496. 713
135. Ng ES, Diaz-Ordaz K, Grieve R, Nixon RM, Thompson SG, Carpenter JR. Multilevel models for 714
cost-effectiveness analyses that use cluster randomised trial data: an approach to model choice. 715
Stat Methods Med Res. 2013;25(5):2036-2052. 716
136. Díaz‐Ordaz K, Kenward MG, Grieve R. Handling missing values in cost effectiveness analyses that 717
use data from cluster randomized trials. J R Stat Soc Ser A Stat Soc. 2014;177(2):457-474. 718
137. Hox JJ, Moerbeek M, Kluytmans A, van de Schoot R. Analyzing indirect effects in cluster 719
randomized trials. The effect of estimation method, number of groups and group sizes on 720
accuracy and power. Front Psychol. 2014;5:78. 721
138. MacKinnon DP, Fairchild AJ, Fritz MS. Mediation analysis. Annu Rev Psychol. 2007;58:593-614. 722
139. Vanderweele TJ, Hong G, Jones SM, Brown JL. Mediation and spillover effects in group-723
randomized trials: a case study of the 4Rs educational intervention. J Am Stat Assoc. 724
2013;108(502):469-482. 725
140. VanderWeele TJ. A unification of mediation and interaction: a 4-way decomposition. 726
Epidemiology. 2014;25(5):749-761. 727
141. Robins JM. Marginal structural models versus structural nested models as tools for causal 728
inference. In: Halloran ME, Berry DA, eds. Statistical models in epidemiology, the environment 729
and clinical trials. New York: Springer; 1999:pp. 95-134. 730
142. Robins JM, Rotnitzky A, Zhao LP. Estimation of regression coefficients when some regressors are 731
not always observed. J Am Stat Assoc. 1994;89(427):846-866. 732
143. de Hoop E, Teerenstra S, van Gaal BG, Moerbeek M, Borm GF. The "best balance" allocation led 733
to optimal balance in cluster-controlled trials. J Clin Epidemiol. 2012;65(2):132-137. 734
144. Moulton LH. Covariate-based constrained randomization of group-randomized trials. Clin Trials. 735
2004;1(3):297-305. 736
145. Vansteelandt S, Joffe M. Structural nested models and g-estimation: The partially realized 737
promise. Stat Sci. 2014;29(4):707-731. 738
146. Rubin DB. Inference and missing data. Biometrika. 1976;63(3):581-592. 739
147. Staples PC, Ogburn EL, Onnela J-P. Incorporating Contact Network Structure in Cluster 740
Randomized Trials. Sci Rep. 2015;5:17581. 741
742 743
Table 1. Summary of known functions and procedures to analyze GRTs using methods
744
described in the current review.
745
Software
Method SAS Stata R
Outcomes analysis of all available data
Mixed-effects models PROC MIXED PROC NLMIXED PROC GLIMMIX mixed melogit mepoisson lme4 nlme
Generalized estimating equations (GEE)
PROC GENMOD1 xtgee geeglm/geeM
Targeted maximum likelihood (tMLE)
N/A N/A N/A2
Quadratic inference function (QIF) %qif N/A qif3
Permutation tests %ptest N/A N/A
Accounting for missing outcomes
Multiple imputation for clustered data %mmi_impute4
%mmi_analyze REALCOM Impute mi impute4 jomopan 5
Inverse probability weighting (IPW) PROC GENMOD6 N/A7 CRTgeeDR
Causal-inference based methods8
Augmented GEE (AU-GEE) N/A N/A CRTgeeDR
Doubly robust AU-GEE N/A N/A CRTgeeDR
Footnotes: 1. PROC GEE is another option, but is in experimental phase and has limited usefulness for GRTs over and above PROC GENMOD. 2. In R, tmle is available for tMLE, but at the time of writing, does not allow for clustering. 3. As of the writing, the authors have been unable to load the package and it only allows equal cluster size, but Westgate has modified the code for GRTs with variable cluster size in the appendix of his paper63 4. Only useful for continuous outcomes. 5. In R, miceis available for multiple imputation but at the time of writing, does not account for clustering. 6. Cannot account for imprecision in the weights. 7. xtgee cannot accommodate individual-level weights but only group-specific weights. 8. Both of the listed methods are related: AU-GEE accounts for baseline covariate imbalance and doubly robust AU-GEE, an extension of AU-GEE, accounts for both baseline covariate imbalance and missing data. N/A: not available at the time of writing.