HAL Id: hal-01810154
https://hal-centralesupelec.archives-ouvertes.fr/hal-01810154
Submitted on 7 Jun 2018
HAL is a multi-disciplinary open access
archive for the deposit and dissemination of
sci-entific research documents, whether they are
pub-lished or not. The documents may come from
teaching and research institutions in France or
abroad, or from public or private research centers.
L’archive ouverte pluridisciplinaire HAL, est
destinée au dépôt et à la diffusion de documents
scientifiques de niveau recherche, publiés ou non,
émanant des établissements d’enseignement et de
recherche français ou étrangers, des laboratoires
publics ou privés.
Matthieu Rivollier, J. L. Courouau, Marie-Laurence Giorgi, François Jomard,
Michel Tabarant, Cécile Blanc, Sylvain Vaubaillon
To cite this version:
Matthieu Rivollier, J. L. Courouau, Marie-Laurence Giorgi, François Jomard, Michel Tabarant, et
al.. Study of the Oxidation Mechanisms of 316LN Steel in Liquid Sodium. ICAPP, May 2015, Nice,
France. �hal-01810154�
Study of the Oxidation Mechanisms of 316LN Steel in Liquid Sodium
Matthieu Rivollier1; Jean-Louis Courouau1; Marie-Laurence Giorgi2, François Jomard3, Michel Tabarant4, Cécile Blanc4, Sylvain Vaubaillon5
1CEA, DEN, DANS, DPC, SCCME, Laboratoire d’Etude de la Corrosion Non Aqueuse, F-91191 Gif-sur-Yvette, France 2École Centrale Paris, EA4038, Laboratoire de Génie des Procédés et Matériaux, F-92295 Chatenay-Malabry, France 3CNRS, UMR8635, Groupe d’Étude de la Matière Condensée, F-78035 Versailles, France
4CEA, DEN, DANS, DPC, SEARS, Laboratoire d’Ingénierie des Surfaces et Lasers, F-91191 Gif-sur-Yvette, France 5CEA, INSTN, UEPTN, Laboratoire Jannus, F-91191 Gif-sur-Yvette, France
Tel: +33169081809, Fax: +33169081586, Email: matthieu.rivollier@cea.fr
Abstract – The sodium cooled fast reactor is selected in France as the 4th generation of nuclear power plant. Reactors vessel, primary loop structures and heat exchangers will be made of austenitic stainless steels: 316LN is the reference material. To assess reactor service life time, corrosion of austenitic stainless steel by liquid sodium is studied in normal operating conditions as well as in transient conditions either expected or not. Oxygen is one of the impurities present in liquid sodium at the level of a few parts per million in weight. It presents a major effect on corrosion phenomena of austenitic
stainless steel, although not totally understood yet, in increasing the iron solubility as well as its dissolution rate. Oxygen is also known to form sodium chromite scale (NaCrO2), those behavior is little documented in the literature.
Based on corrosion tests performed in the static sodium test device (“CorroNa”) at 550 °C and 650 °C, sodium chromite scale (NaCrO2) is observed in slightly oxidizing conditions. Below the oxide scale, a chromium depleted layer is
characterized. Some aspects of the morphology of this oxide scale and its properties are presented.
To predict long term corrosion effects on materials (40-60 years), the oxidation mechanisms are investigated in order to identify the limiting step of the kinetics, as well as to understand the basic phenomenon at play in this complex corrosion phenomenon. This paper proposes that sodium oxide diffuses through the oxide scale and that the oxide scale grows inwards
thanks to test achieved with inert corrosion marker and isotopic tracers (16O-18O). Tests are characterized by Rutherford
Backscattered Spectroscopy (RBS), Nuclear Reaction Analysis (NRA), Glow Discharge Optical Emission Spectroscopy (GD-OES), and Secondary Ion Mass Spectroscopy (SIMS).
In addition, these results are used to assess the sodium diffusion coefficient in the austenitic stainless steel. Moreover, in knowing chromium diffusion coefficient in stainless steel, kinetics assessment of oxidation is then made possible.
I. INTRODUCTION
The use of liquid sodium at high temperature on the long term is envisaged as coolant for Sodium Fast Reactors (SFR), which are being evaluated by CEA for a future generation of nuclear reactors (60 years – 350 to 650°C) [1]. The chemical conditions that can change with time (normal, transient and incidental) mean that any interactions on the liquid metal with structural materials must be well known, well understood, and possibly predicted to guarantee service life-time as well as resistance to incidental conditions. One of the main corrosion parameters (apart from temperature) is the content of dissolved oxygen, the most important impurity in the liquid sodium. Although its exact role is unknown, oxygen is reported to increase the corrosion either by catalyzing the dissolution of iron or by promoting excessive mass transfer. In addition, oxygen forms mixed oxide scales on alloyed steels interface such as Na2O.Cr2O3
(NaCrO2) [2] in specific conditions and accelerates
intergranular penetration at high oxygen levels. It is thought [3] that oxidation takes a non-negligible part on the overall corrosion kinetics. This is why, in the prospect of long-term modelling, oxidation in controlled conditions was done in liquid sodium, in order to characterize the specimen at the finest scale available to indicate more precisely the phenomenon of oxide scale growth. The objective is to understand the underlying corrosion mechanisms, possibly to identify the limiting step and to quantify the corrosion effect, i.e., all data that are required for modelling, following the widespread methodology used for corrosion modelling. This paper will present the results obtained by tests performed on 316LN steel at 650°C in liquid sodium with 200 µg/g oxygen content for a few hundred hours, focusing on the morphology characterized by scanning electron microscope, x-ray diffraction and surface characterization using glow discharge-optical emission spectrometry.
II. MATERIAL AND CORROSION CONDITIONS The tested material is an austenitic stainless steel. Its composition is given in Table I. The grain size is close to 50 µm. Before the corrosion experiments, the specimens are polished. Several final polishing: SiC paper 1200 and 4000 and diamond suspension 1 µm, implying several roughnesses, are performed on the specimen surfaces.
TABLE I
Composition of the 316LN stainless steel tested. Element Concentration (wt. %) Fe Balanced Cr 17.9 Ni 12.1 Mo 2.35 Mn 1.72 C 0.012 Si 0.45 P 0.034 S 0.025 Ti 0.0015 Al 0.0025 Cu 0.0025 Co 0.0008
The tests are run in a static sodium device “CorroNa” [4]. The sodium is contained in a molybdenum crucible. A furnace heats the thermal well where the crucible is set. All of this is set below an argon purified glove box that eases all operations required for the test preparation and the handling of the liquid metal. During corrosion test, the system is perfectly tight towards both the atmosphere and the argon of the glove box.
Before testing, the 99.95 % pure sodium (provided by Métaux Spéciaux) is melted and the free level is skimmed in order to remove sodium oxide present in excess. A low temperature step at 105-110°C is done for 3 days and after that, oxide present is carefully skimmed out. Then, an additional purification step is done at high temperature (650°C during 72 h) using a zirconium getter to get rid of any residual oxygen.
After purification, sodium oxide (Na2O) is added to
the liquid sodium in order to obtain 200 µg/g of oxygen concentration. This step is used to control the oxygen pollution of sodium.
After controlled pollution, the specimens are immersed in liquid sodium at 120°C and the system is closed tightly. Then, sodium is heated at 0.5°C/min to 650°C. The temperature is kept constant during 122 h to 500 h and decreased at 0.5°C/min.
After immersion in liquid sodium, the specimens are washed with 99.9 % pure ethanol (provided by Carlo Erba) in order to remove metallic sodium from the sample surfaces.
The specimens are then weighted to get the weight variation.
X-Ray Diffraction (XRD, device: Bruker D8 discover) is carried out. XRD gives the phase formed during corrosion. The XRD is performed with a copper cathode which produced an X-ray of wavelength λ = 1.5406 Å. Morphological characterizations are performed by means of electron microscopy: Scanning Electron Microscopy (SEM, device: Zeiss Gemini ultra 55) is used to characterize surface and specimen cross-sections. In both cases, Energy Dispersive X-ray (EDX, device: Bruker AXS Flash Detector 4010) analyses are done. Depth elementary profiles are obtained from the interface by Glow Discharge Optical Emission Spectroscopy (GD-OES, device: Horiba Jobin Yvon GD-Profiler 2). The concentration profiles are performed on a 4 mm diameter area, with a 2.5 nm depth resolution.
III. CHARACTERIZATIONS
XRD characterizations show the formation of sodium chromite (NaCrO2), and (Mo0.5M0.5)6C carbide type, with
M = Mn, Fe or Ni. Sodium peroxide (Na2O2), hydrated
soda (NaOH-H2O) and sodium oxide (Na2O) are possible
phases identified as well. Those phases are associated to sodium reaction with air and moisture after corrosion test; in fact, it seems that the metallic sodium is not completely removed from specimens, after washing in ethanol.
Figure 1 shows an example of the typical surface of samples corroded during 250 h at 650°C, observed with the SEM. Triangular shaped crystals are observed on the surface; EDX analyses show that these ~250 nm-large crystallites are chromium, sodium and oxygen-rich. Above these Na-Cr-O rich crystals, Mn-rich bigger crystallites are present.
Figure 2 presents SEM with backscattered electron cross-section images of a sample immersed in sodium during 250 h at 650°C. The Figure 2a is an overview. It shows grain-boundaries inside the substrate, one of them arises to the surface in contact with liquid sodium. Figure 2b enlarges the image close to the grain-boundary to show that it is slightly more affected. Below sample mounting (in black, at the top of the image), a grey zone can be observed. EDX analyses show that this zone is rich in chromium, sodium and oxygen. Between this oxide scale and the substrate, cavities are formed. Matrix between cavities appears as depleted in chromium. In addition, a clearer phase in backscattered electron is seen below Cr-Na-O rich zone. This phase is enriched iron and molybdenum. Finally, the manganese-rich crystallites observed on the surface are not seen on cross-section observations. The presented SEM observation is representative of observations performed along the cross-section.
Fig. 1. SEM surface observation (secondary electrons), sample immersed during 250 h at 650 °C in liquid sodium with 200 µg/g oxygen content.
Fig. 2. SEM cross-section observations (backscattered electron), sample immersed during 250 h at 650 °C in liquid sodium with 200 µg/g oxygen content. a: Overview, b: Grain-boundary details.
The concentration depth profiles of carbon, oxygen, chromium, manganese, iron, nickel, molybdenum and sodium obtained by GD-OES are plotted in Figure 3. It shows the concentration and density in log-scale as a function of depth of the sample corroded in liquid sodium during 250 h at 650°C and 200 µg/g of oxygen content. The origin of the x-axis stands for the specimen surface. The maximum depth corresponds to the depth of the characterization, here 12 µm. Concentration profiles firstly point out a 1 µm thin layer rich in oxygen, sodium and chromium, which corresponds to the sodium chromite scale. In this zone, the oxygen concentration decreases slightly while the sodium concentration increases slightly. The chromium concentration appears as steady together with the density. The end of the oxide scale is supposed to be at the maximal sodium concentration. It also corresponds to the slope changes of oxygen and chromium concentrations, validating this hypothesis. The iron, nickel and molybdenum concentrations increases across the oxide scale from nearly 0.1 at.% to, respectively, 8, 2 and 2 at.%, which can be attributed to non-uniform scale.
The next zone is set between 1 µm and 1.55 µm: it presents molybdenum and carbon peaks at 1.3 µm, a slight Cr depleted zone around 1.55 µm and carbon enrichment when compared to the matrix. Then, the last corroded affected zone is set between 1.55 and 5.25 µm, with a
gradual increase of the density along two distinct variations that affects accordingly the Fe, Cr, Ni profiles, as well as the Na profile.
A last zone of the steel matrix appears only affected by sodium and oxygen diffusion.
In the first zones, manganese enrichment is seen. The enrichment is explained by the manganese impurities in liquid sodium.
In addition, the depths of the oxide scale, the molybdenum-rich zone and the corrosion affected layer seem to increase with time, which requires additional testing time.
Fig. 3. GD-OES depth chemical profiles on sample immersed in liquid sodium 500 h at 650°C and 200 µg/g in oxygen.
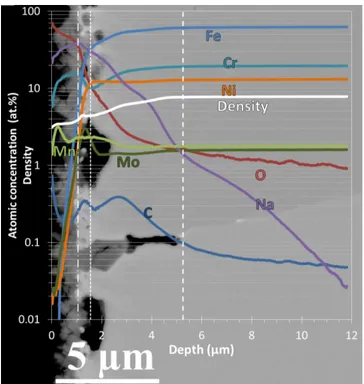
The elementary profile obtained by GD-OES is compared with SEM observation in Figure 4. It should be noted that the characteristic scales of SEM observation and depth profile do not match exactly, in fact 5 µm of the cross-section image correspond to 4 µm of the elementary depth profile. This small difference comes from that the comparison is not rigorous. In fact the GD-OES profile is performed on a 4 mm diameter section while cross-section observation is performed on a 17 µm large section. Nevertheless, the comparison is carried out to illustrate concentrations variation.
The previous described layers, namely oxide scale, Mo-rich zone and affected zone, with SEM observation: the oxide layer is found in both characterizations and the molybdenum and carbon peaks coincide with the clear phase enriched in iron and molybdenum. Oxide penetrations are also seen in the concentration variations: i.e., the slope changes in sodium, iron, chromium and molybdenum concentrations and in density coincide with characteristic depth of oxide penetration and cavities formed below.
Fig. 4. GD-OES depth chemical profiles compared with the SEM cross-section observation for a sample immersed in liquid sodium containing 200 µg/g in oxygen, 500 h at 650°C.
IV. DISCUSSION
IV.A. Sodium diffusion in austenitic stainless steel
Elementary profile points out the maximum sodium concentration at the oxide/metal interface. Sodium can accumulate, diffuse backwards to liquid metal or diffuse to the steel matrix. The last sodium diffusion profile can be used to figure out the sodium diffusion coefficient in the 316LN steel. The mechanism is considered to be equivalent to the case of diffusion with constant sodium concentration at sodium chromite/alloy interface (supposed to be at equilibrium) and 0 far from the interface. According to this description, the solution is given by Mehrer [5]:
𝐶𝑁𝑎(𝑥) = 𝐶𝑁𝑎0 ⋅ erfc (2√𝐷𝑥
𝑁𝑎⋅𝑡) (1)
Where 𝑥 is the position length from the maximal sodium concentration, 𝐶𝑁𝑎(𝑥) is the sodium concentration at the 𝑥 position, 𝐶𝑁𝑎0 is the sodium concentration at the scale/alloy interface, 𝐷𝑁𝑎 is the sodium diffusion coefficient in the alloy, 𝑡 is the time and erfc is the complementary error function.
The sodium GD-OES profiles are fitted by using Equation (1). It is to be noticed that fits are performed for depth where density and chromium, nickel and iron concentrations become steady. Indeed, the microstructure before this point is not well known and can affect sodium diffusion. The scale/alloy interface (x = 0) is assumed to be
at maximal sodium concentration. From fits, sodium diffusion coefficient in 316LN steel is deduced at 650°C for all specimens. Figure 3 gives an example of the fit performed.
The results give a mean value for the sodium diffusion coefficient: DNa = 9×10-18 m²/s with a standard deviation of
3×10-18 m²/s. The mean calculated sodium concentration at
the scale/alloy interface is 9.5 at.% (standard deviation of 2 at.%).
The only known literature data refer to another material, pure iron: in the Armco iron and electrolytic iron grade [6], DNa = 2×10-17 m²/s and DNa = 6×10-18 m²/s at
650°C respectively. The obtained value of diffusion coefficient is then of the same order of magnitude.
IV.A. Chromium diffusion in austenitic stainless steel
A lower chromium concentration is seen in the affected zone. As earlier, the diffusion profile can be fitted in using the equation, given by Crank [7]:
𝐶𝐶𝑟(𝑥) = (𝐶𝐶𝑟316𝐿𝑁− 𝐶𝐶𝑟0) ⋅ erf ( 𝑥
2√𝐷𝐶𝑟⋅𝑡) + 𝐶𝐶𝑟
0 (2)
Where 𝑥 is the position length to minimal chromium concentration, 𝐶𝐶𝑟(𝑥) is the chromium concentration at the 𝑥 position, 𝐶𝐶𝑟316𝐿𝑁 is the initial chromium concentration in the 316LN steel, 𝐶𝐶𝑟0 is the chromium concentration at Mo rich zone/alloy interface, 𝐷𝐶𝑟 is the chromium diffusion coefficient in the alloy, 𝑡 is the time and erf is the error function.
The chromium GD-OES profiles are fitted by using Equation (2). The fits are performed from the Mo rich zone/affected zone interface to the maximal depth of the profile. Mo rich zone/affected zone interface (x = 0) is assumed to be at minimal chromium concentration. From fits, chromium diffusion coefficient in 316LN steel is deduced at 650°C for all specimens. Figure 3 gives an example of the fit performed.
The results give a mean value for the chromium diffusion coefficient: DCr = 1.8×10⁻¹⁸ m²/s with a standard
deviation of 1.8×10⁻¹⁸ m²/s.
Some values of chromium diffusion coefficient are available in the literature. Perkins [8] gives this diffusion coefficient in volume at 650 °C, Dv = 7.8×10⁻²¹ m²/s, and in
the grain boundaries, δDgb = 6.5×10⁻²⁴ m3/s. Using:
𝐷𝐶𝑟= 𝐷𝑣+ 𝛿𝐷𝑔𝑏
𝑑 (3)
where 𝑑 is the grain size, here 50 µm. The coefficient
DCrPerkins = 1.3×10⁻¹⁸ m²/s is found.
Smith [9] also gives some values at 650 °C:
Dv = 1.1×10⁻²⁰ m²/s, and δDgb = 3.5×10⁻²⁴ m3/s. Using
Equation (3), the diffusion coefficient DCrSmith = 7.3×10
-19 m²/s is found.
The two values found in literature are in good agreement with the fitted value obtained in this study.
V. CONCLUSION
The fine characterisations achieved by GD-OES demonstrated that 316LN steel is both oxidized and dissolved in liquid sodium at 650°C with 200 µg/g of oxygen. Oxidation is characterised by the formation of an external sodium chromite scale. Dissolution leads to the formation of uniformly distributed and localised to grain boundaries porosities below the oxide scale. Porosities are sodium filled even though samples were ethanol cleaned. Sodium appeared to diffuse in the corrosion unaffected steel matrix: sodium diffusion coefficient was then assessed to 9×10-18 m²/s at 650°C in 316LN. Moreover,
chromium diffusion coefficient in 316LN stainless steel is measured, and the result is very close to the values available in the literature, which may imply that chromium diffusion is the rate limiting step of oxidation process.
In order to fully understand the corrosion mechanisms, other experiments at different temperatures have to be performed.
REFERENCES
1. Cabet, C., D. F., M. Sauzay, Y. Cui, L. Forest, J.L. Courouau, S. Dubiez-Le Goff, T. Marlaud, and M. Blat-Yrieix. "Some recent results on stainless steel 316L(N) for a 60 years design life as ASTRID structural material" in International Congress on
Advances in Nuclear Power Plants (ICAPP 2014).
2014. 6-9 April 2014, Charlotte, USA.
2. Shaiu, B.J., Wu P.C.S., and Chiotti P., “Thermodynamic properties of the double oxides of Na2O with the oxides of Cr, Ni, and Fe”. Journal of Nuclear Materials, 67, p. 13 (1977).
3. Courouau, J.-L., Lorentz V., Tabarant M., Bosonnet S., and Balbaud-Célérier F. (2013): “Corrosion by oxidation and carburization in liquid sodium at 550°C of austenitic steels for sodium fast reactors”, Fast
Reactors conference (FR 13), Paris, France.
4. Courouau, J.-L., Balbaud-Célérier F., Lorentz V., and Dufrenoy T., “Corrosion by liquid sodium of materials for sodium fast reactors: the CORRONa testing device”, International Congress on Advances in
Nuclear Power Plants (ICAPP '11), paper 11152, Nice,
France, May 2-5, 2011, ANS.
5. Mehrer, H., “Diffusion in solids, Fundamentals, methods, materials, diffusion-controlled processes”, Springer, 2007.
6. Tomilov, A.V., and Shcherbedinskii G.V., “A study of diffusion of sodium and potassium in iron.”
Fiziko-Khimicheskaya Mekhanika Materialov, 3, 3, p.261
(1967).
7. Crank, J., “The mathematics of diffusion”, Oxford university press, Oxford, 1975.
8. Perkins, R.A., Padgett, J.R., Tunali, N.K., “Tracer diffusion of 59Fe and 51Cr in Fe-17 Wt Pct Cr- 12 Wt
Pct Ni Austenitic Alloy”, Metallurgical Transactions,
4, p.2535 (1973).
9. Smith, A.F., “The diffusion of chromium in type 316 stainless steel”, Metal Science, 9, p.375 (1975).