Cryotribology of Graphite and Diamond by
Ahmet F. Ashaboglu
B.S., Mechanical Engineering (1994) Tufts University
Submitted to the Department of Mechanical Engineering in Partial Fulfillment of the Requirements for the Degree of
Master of Science in Mechanical Engineering at the
Massachusetts Institute of Technology February 1996
* 1996 Massachusetts Institute of Technology All rights reserved
,/7
i)Signature of Author... . . . . ....
January 16, 1996
Certified by... ... ..
Certified by ... .../• . . i. ... ... yU.... z..I... ....
/ v Yukikazu Iwasa
4Thesis Supervisor
A ccepted by...
Ain A. Sonin Chairman, Department Committee on Graduate Students
,.iASSb CHUS.•: - !•S••T$ ,j•!; Ji
OF TECHNOLOGY
MAR 1 91996
Cryotribology of Graphite and Diamond
by
Ahmet F. Ashaboglu
Submitted to the Department of Mechanical Engineering on January 16, 1996 in Partial Fulfillment of the Requirements for the Degree of Master of Science in
Mechanical Engineering
Abstract
An experimental study was carried out on tribological behaviors of materials of interest to cryogenic applications slid against graphite and chemical-vapor-deposition (CVD) diamond film. The testing was carried out using a pin-on-disk tribometer capable of operating at cryogenic temperatures. The range of temperatures investigated was 4.2 to 293 K, with constant temperatures at 4.2, 77, and 293 K.
Two basic scenarios of testing were generally used: 1) friction vs velocity characteristics at constant temperatures; 2) friction vs temperature behavior at fixed sliding speeds. For natural diamond, alumina, and graphite pins slid against graphite disks, a favorable positive sliding velocity-coefficient of friction characteristics has been observed. In the case of natural diamond, graphite, and AISI 440C stainless steel pins slid against CVD-diamond film, the coefficient of friction is virtually velocity independent. Friction coefficients for natural diamond and graphite pins slid against CVD-diamond film are nearly temperature independent between 77 and 293 K. All pin materials slid against graphite disks show a peak friction coefficient value at a temperature of around 100
-200 K.
Thesis Supervisor: Yukikazu Iwasa
Title: Research Professor, Francis Bitter Magnet Laboratory, Senior Research Engineer, Department of Mechanical Engineering
Acknowledgments
I would like to take this opportunity to thank and acknowledge all the people for their support and contributions while I was working on my research and writing my thesis. First, my appreciation goes to Dr. Yukikazu Iwasa, my advisor, I have benefited greatly from his guidance and patient support. Next, Prof. Ernest Rabinowicz, for his generous
advice and sharing his expertise in tribology with me whenever I needed it.
I am very grateful to Drs. Koji Kobashi and Takeshi Tachibana of Kobe Steel Ltd. who have generously provided the CVD-diamond film specimens tested.
I would also like to thank my colleagues Mamoon Yunus, Hunwook Lim, Thomas Willett, and Jun Kim for their support and assistance.
Lastly, I am indebted to my friends and family, especially my parents, whose patience, love, support, and understanding mean much more to me than words can convey.
Table of Contents
T itle Page ... ... ... 1
A bstract ... 2
A cknow ledgm ents ... ... ... . ... ... 3
T able of C ontents ... ... ... ... 4
1. Introduction and Background... 5
1.1. Tribology... 5
1.2. M echanism of Friction ... ... 7
1.2.1. Real Area of Contact ... .. 7
1.2.2. Quantitative Laws of Sliding Friction... ... 9
1.3. Analysis of Friction-Generating Mechanisms...11
1.3.1. Asperity Deformation Mechanism... 11
1.3.2. Adhesion M echanism ... 12
1.3.3. Plowing M echanism ... 14
1.3.4. Stick-Slip M echanism ... ... 15
2. Tribology of Diamond and Graphite... 17
2 .1. D iam on d ... .... ... 17
2 .2 . G raphite... ... ... ... ... ... 19
3. Experimental Procedure and Materials...21
3 .1. A p p aratu s... ... ... .. .... ... ... ... 2 1 3 .2 . M aterials... ... ... ... ... ... 2 3 3.3. Sample Preparation... ... 27
3.4. T esting.... ... ... ... 28
4. Results and Discussions... ... 30
4.1. Friction vs Velocity Experiments...30
4.2. Friction vs Temperature Experiments...40
5. Conclusions ... ... .. ... 51
1. Introduction and Background
The principle objectives of this research were to advance the theoretical understanding of low-temperature sliding behavior and to expand our cryogenic tribology data base, particularly for very hard materials. We were interested in hard materials because of their generally high load bearing capacities, low friction coefficients, and wear resistances. The emphasis is on the friction behavior of materials of interest to cryogenic applications slid mainly against CVD-diamond film and graphite.
Early in the next century, both superconductivity and cryogenics are predicted to play key roles in highly competitive global high-technology markets involving energy and power, information, medicine, transportation, space, and basic science. Since cryotribology is one engineering issue that is vital to these low-temperature applications, it was worthwhile for us to investigate new materials which are promising in this field. A notable recent development in this regard is the remarkable progress achieved in techniques for synthesizing diamond films by chemical-vapor-deposition (CVD) methods. Analyses, e.g. x-ray and electron diffraction, and Roman scattering, indicate that the properties of CVD-diamond films are very similar to those of pure, type-IIa bulk diamond; this makes CVD-diamonds technologically important for applications including abrasive coatings, heat sinks, high-performance electronic devices, as well as for our interest -coating materials for cryogenic devices.
1.1 Tribology
The main concern of tribology is the science and the technology of the interface between two or more bodies in relative motion. Numerous engineering systems such as machines, vehicles, and instruments depend on processes of motion. Consequently, the analysis of dynamic behavior has become of great interest to many scientists throughout history. Tangential resistance to relative motion between bodies in contact is a feature common to all processes of motion, i.e., the occurrence of friction. Further, if in a dynamic system
one moving component consists of a solid body, the effect of friction generally is accompanied by wear which can be defined as the progressive loss of substance from the operating surface of a body occurring as a result of relative motion at the surface. In order to embrace all aspects of moving surfaces, the word "tribology" was coined by a British committee in 1966 from the word "tribos", which means "rubbing" in classic
Greek [1].
The first practical application of friction was the use of frictional heat in the lighting of fires. The second problem man was faced with concerning friction was in the transportation of materials where friction had to be overcome. Sleds, rollers, and wheels were used for more than 3000 years to minimize work required to transport heavy materials. However, the scientific study of the dynamics of motion and of friction phenomena is much more recent than these early applications might suggest. Galileo was the first to discover "the principle of inertia" 400 years ago: if a moving object is not disturbed by friction forces, it continues to move with a constant velocity in a straight line. The next step was taken by Newton who formulated basic laws of classical mechanics. Amantons in 1699, Coulomb in 1785, and Morin in 1833 followed Galileo and Newton in formulating some rules of friction based on extensive experiments. Their main discovery was the "roughness hypothesis" which says that friction is due to the interlocking of mechanical asperities on the surfaces of the materials in contact. This hypothesis allowed them to explain why the friction force is proportional to the load, and independent of the contact area. It was not until about 1920, when scientists such as Hardy and Tomlinson came up with the "adhesion hypothesis" which assumes that the friction force is needed to overcome molecular adhesion forces acting between the contacting surfaces. But at that time they were unable to explain the discrepancies in the results of numerous friction experiments indicating that the friction force is independent of the contact area. In the 1940s, Holm, Ernst and Merchant, and Bowden and Tabor found a big difference between the apparent geometrical area of contact and the "real" area of contact formed by the touching asperities of the two surfaces. In light of this new discovery, Bowden and Tabor were able to explain the so called "generalized" theory of
friction which states that friction has a dual nature in that both deformation processes and adhesion processes are involved [2, 3].
1.2 Mechanism of Friction
Friction is defined as the resistance to motion which exists when two bodies in contact are moved tangentially with respect to each other. The frictional force arises from the molecular and mechanical interactions of the surfaces at the area of contact. As discussed earlier, the nature of the interaction between two surfaces is determined by the real area of contact.
1.2.1 Real Area of Contact
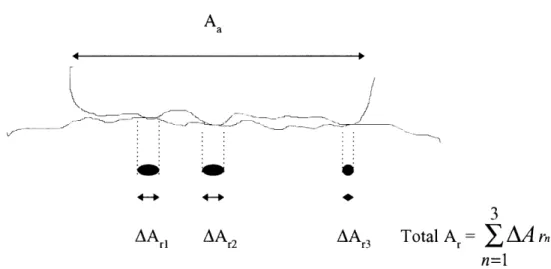
The apparent area of contact, Aa, is the area that appears to the human eye to be making contact between two or more surfaces according to the geometry of the situation. But since no surface is perfectly smooth, surfaces have an uneven series of high and low spots in reality. The real area of contact, Ar, is defined by the area where the high spots, or asperities, of each surface come into contact with one another. In order to calculate
Ar, we look at one asperity, Figure 1.1. As it can be seen in the figure, the interface is in a state of triaxial constraint.
AL
The penetration hardness, p, is the largest compressive stress that such a region of material can carry without plastic yielding. It is three times as great as the yield strength, y, in uniaxial compression. As the normal load is applied on the contacting surfaces, the asperities deform to create the total contact area, which is determined by the flow stress of the softer material. Hence the real area of contact can be estimated as such:
Alr = (1.1)
where L is the applied load, and p is the penetration hardness of the softer material. Figure 1.2 shows a schematic illustration of an interface with apparent and real areas of contact.
Aa
AArl AA 2 AA 3 Total A = J AA rn
n=1 Figure 1.2 Schematic illustration of an interface with apparent and real areas of contact.
8 ~ ~ ~1-u( :::::::::::::::::::::::::::::::::::::::: ~7~7 f-,
1.2.2 Quantitative Laws of Sliding Friction
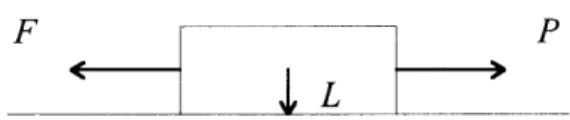
When a body of weight L is pulled by an applied force P, sufficient enough to cause sliding as shown in the Figure 1.3, the body moves in the direction of P.
J1L
Figure 1.3 Schematic illustration of a body of weight L, which is pulled with a tangential force P causing a friction force F in the opposite direction.
The frictional force, F, is colinear with and opposite the direction of P. Hence, when tangential motion occurs, the friction force always acts in a direction opposite to that of the relative velocity of the surfaces.
While there is no universally accepted theory of friction, there are certain quantitative laws concerning friction that have been more or less agreed upon. They are concerned with the magnitude of the friction force. The three quantitative relations that are required to express the magnitude of the friction force as a function of the principal macroscopically observable variables: the applied load, the size of the region of contact, and sliding velocity are as follows:
1. The friction force F is proportional to the normal force L, that is:
F= pL (1.2)
where p/ is the coefficient of friction.
2. The friction force is independent of the apparent area of contact Aa. Thus
large and small objects have the same coefficient of friction.
3. The friction force is independent of the sliding velocity v [2].
These three laws provide the quantitative framework within which friction is generally studied by scientists and engineers.
The first law is generally well obeyed. The only exceptions that occur involve either very hard or very soft materials, such as diamond (hard) and teflon (soft). In such cases the friction force is related to some other power of the load besides a linear one given in Eq. 1.2. Materials with a hard surface coating on a soft substrate may as well violate this linear law. When the load, or wear, becomes too great the hard surface is broken and the properties of the substrate come into play.
Deviations from the second quantitative law, which states that friction is independent of the apparent area of contact, are sometimes noted in very smooth and very clean surfaces. Under these conditions very strong interaction between the surfaces takes place. The friction force becomes independent of the load but proportional merely to the apparent area of contact, which has become the real area of contact.
Of all these quantitative laws, the third law is often invalidated. It is well known that the friction force required to start sliding is usually greater than the force required to maintain sliding. This leads to the definition of two separate coefficients of friction: one describing friction before motion and one describing friction after motion commences. These are known as the static, jgs, and kinetic, tk,' coefficients of friction. Generally, the kinetic coefficient of friction is less than the static, i.e. gk < ýs. Throughout this thesis, when the coefficient of friction is referred to, the kinetic coefficient of friction, 1gk, is
In the following section, the experimental laws of friction will be examined in order to deduce a theoretical model of friction with the goal to be able to explain the experimental results presented later.
1.3 Analysis of Friction-Generating Mechanisms
There are three basic mechanisms that are responsible for the generation of friction force, namely, asperity deformation, adhesion, and plowing. In this section these three mechanisms as well as stick-slip instabilities, which are a common source of friction variations during sliding, will be discussed.
1.3.1 Asperity Deformation Mechanism
The asperity deformation mechanism is responsible for both the static coefficient of friction as well as the dynamic coefficient of friction because asperities are continuously produced due to the delamination of wear sheets. But, the asperity deformation process does not have as much contribution to the dynamic coefficient of friction as plowing and adhesion mechanisms, since new asperities are only produced with the formation of delaminated wear particles, which often requires a large number of cyclic loading by the asperities of the opposing surface.
As shown in Figure 1.4, when two asperities of two surfaces sliding against one another come into contact, they have to deform in order for the sliding motion to proceed.
F
Figure 1.4 Schematic illustration of two interacting surface asperities.
The contribution of asperity deformation mechanism to the total coefficient of friction is expected to be the largest when two identical metals are slid against each other since the surfaces will in that case remain always rough and therefore, full of asperities. Since in a dynamic case the surfaces become smooth, most of the normal load is carried by the entrapped wear particles between the surfaces and the flat contacts. In this case, the actual contribution of the asperity deformation to the total friction force is expected to be very small next to the plowing and adhesion mechanisms' contributions. At this point, it
should be also noted that asperity deformation mechanism largely controls the static coefficient of friction before the onset of sliding between two surfaces.
1.3.2 Adhesion Mechanism
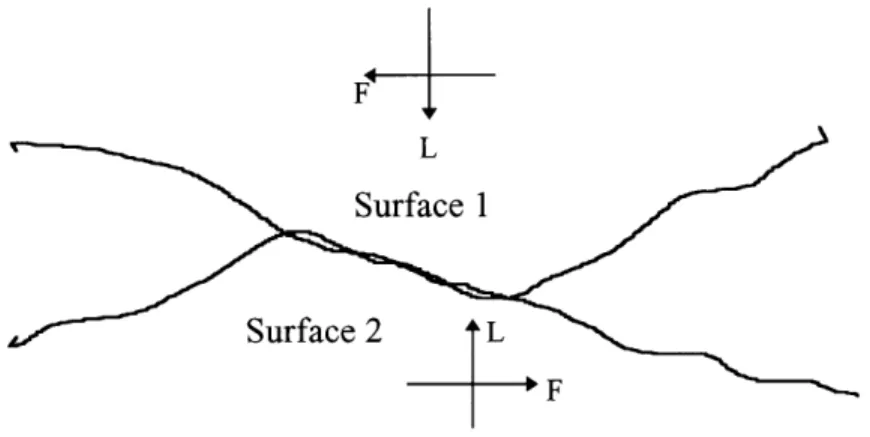
If two nearly flat surfaces coming into contact as shown in Figure 1.5 are considered, friction force arises due to the adhesion of the surfaces.
Surface 2
Figure 1.5 Schematic illustration of two nearly flat surfaces coming into contact.
Unlike the deformation of asperities, this friction force is a function of the adhesion between the two opposing surfaces. One of the following two incidences must take place for the adhesion force to occur: either the atoms are brought together in close proximity for interatomic interactions or two nearly flat portions of the surfaces are welded together.
Once an adhesion force is present between two surfaces, an increasing tangential force between surfaces leads to elastic deformation in the direction of sliding motion. As long as the relative displacement is small compared with the junction size (10-100 ýpm) [2], the deformation approximates plastic flow [4]. Once the displacement is greater than the size of an asperity junction, the junction is broken and sliding starts. During sliding new asperities come into contact and new junctions are formed. This cycle of junction formation, growth, and rapture occurs continuously during sliding motion. Various alterations in the sliding conditions, such as speed, distance, temperature, or time have different effects on the strength of the junctions between two surfaces. Considering all these alterations and the possible different sizes of junctions, the observed fluctuations in the coefficient of friction during adhesive sliding can be explained.
It is also possible for the adhesion force to arise at the slopes of two interacting asperities. Adhesion component of coefficient of friction is not present, or at least negligible, at the onset of sliding. This is probably due to the presence of contaminants on the surface of sliding. The adhesion between nearly flat surfaces is expected to increase after the asperities are deformed and new fresh surfaces are exposed for direct
-sliding. It is fairly difficult to determine the exact flat adhesion area since some of the normal load con be carried by the asperities and entrapped wear particles between the sliding surfaces.
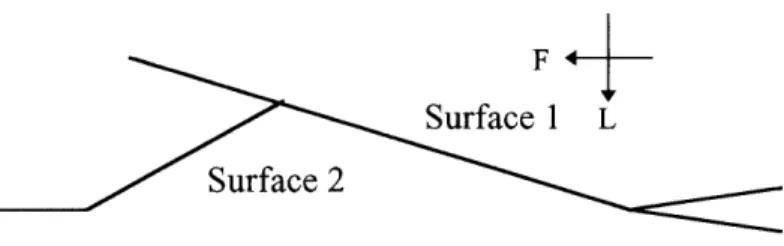
1.3.3 Plowing Mechanism
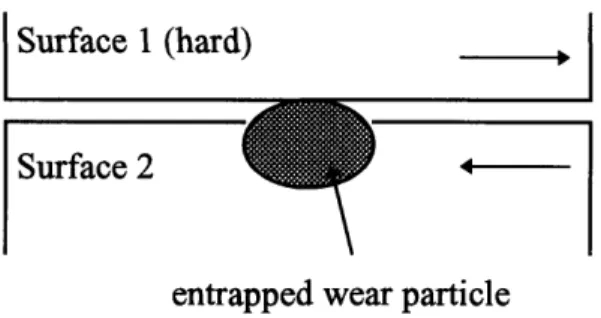
There are two causes for the plowing component of friction force during sliding motion, namely, penetration of hard asperities or penetration of wear particles that are entrapped between the sliding surfaces. Figures 1.6a and 1.6b schematically illustrate the plowing due to wear particles. Figure 1.6a shows this mechanism between surfaces of equal hardness and 1.6b between two surfaces where one surface is very hard and smooth.
Surface 1
Surface 2
entrapped wear particle
Figure 1.6a Illustration of idealized model of wear particle interaction between two sliding surfaces of equal hardness.
When two surfaces are of equal hardness, the wear particle that is entrapped between the two surfaces can penetrate both surfaces. As the surfaces move with respect to each other, grooves are formed in one or both of the surfaces.
Surface I (hard)
Surface 2
4-entrapped wear particle
Figure 1.6b Illustration of idealized model of wear particle interaction between two sliding surfaces where one surface is smooth and very hard.
In the case as illustrated in Figure 1.6b, when one of the surfaces is very hard and smooth, the wear particle simply slides along the hard surface and no plowing can occur. But, in the case when the hard surface is very rough, wear particles can anchor in the hard surface and plow the softer surface.
The main effect of plowing is increasing the total friction force. But, it also creates new wear particles, which in turn affect the subsequent wear of sliding surfaces. Plowing results in formation of ridges along the sides of plowed grooves. These ridges are later deformed by the repeated normal load and some of them become loose wear particles. These new wear particles again are entrapped between the sliding surfaces causing further increase in the coefficient of friction.
1.3.4. Stick-Slip Instabilities
When a body is slid over another under a steady pulling force, it is frequently observed that the motion proceeds sometimes at a constant or near-constant velocity and on other occasions at velocities that fluctuate widely. This oscillatory type of motion is generally referred to as "stick-slip". These fluctuations of the sliding velocity in most practical sliding systems are considered a serious nuisance, and various measures are taken to eliminate, or rather to reduce, the amplitude of the fluctuations. During stick portion of the cycle the sliding surfaces remain in static contact for a time before breaking free and
slipping relative to each other. All stick-slip processes are caused by the fact that the friction coefficient does not remain constant as a function of some other variable. This variable can be distance, velocity, time, or temperature [5,6].
2. Tribology of Diamond and Graphite
It has long been known that the friction of various carbon forms especially in the forms of diamond and graphite are low [7]. An extensive amount of research has been performed to examine friction characteristics of both materials, mostly at room temperature or above. In this section, a brief summary of early works is presented.
2.1 Diamond
Gardos and Soriano [8], Samuels and Wilks [9], Kohzaki et al. [10], Jia et al. [11], Bowden and Hanwell [12] have reported friction behavior of diamond, either natural or CVD-processed film, performed with pin-on-disk setups. Measurements indicate low values for the coefficient of friction, 0.05-0.1, with materials exposed in the atmosphere.
The friction of both natural diamond and CVD-diamond film is a complex phenomenon influenced by many parameters. Therefore, it is very difficult to compare and assess the results of various experiments by different groups. Particularly, there are generally some uncertainties concerning the shape and orientation (angle) of the stylus, and the surface finish on both pins (or stylus) and disks.
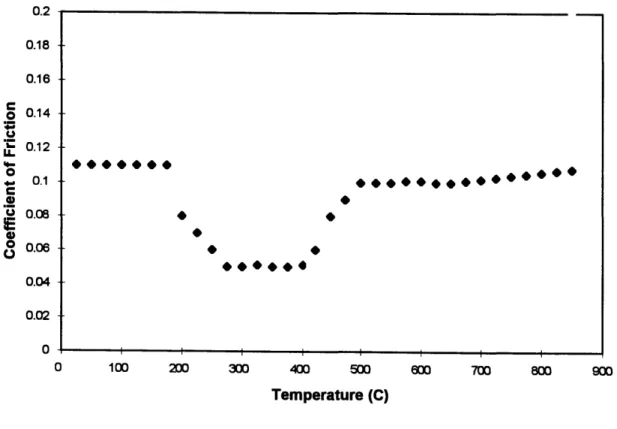
Figure 2.1 below shows coefficient of friction versus temperature measurements for CVD-processed diamond films (deposited on polycrystalline a-SiC disks) slid against similarly coated a-SiC pins over the temperature range 20-8500C based on published
data [8]. Note that a friction coefficient value of -0.1 at room temperature agrees with our values, presented later, for natural diamond pins vs CVD-diamond film disks. The dip in the coefficient of friction observed over the temperature range 200-5000C,
according to Gardos and Soriano, is due to a decrease in surface shear strength. The decrease is believed to be a result of the generation of gaseous and solid oxidation products, combined with the temperature-shear-oxygen-induced phase transformation of diamond to graphite.
0.2 0.18 0.16 0.14 0.12 0.1 0.08 0.06 0.04 0.02 0 600 700 800 900
Figure 2.1 Coefficient of friction versus temperature measurements for CVD-processed diamond films (deposited on polycrystalline oSiC disks) slid against similarly coated a-SiC pins over the temperature range 20~-8500C based on published data [8].
200 300 400 500
Temperature (C)
0 100
I I I
2.2. Graphite
Since graphite is known to be a very good solid lubricant, a significant amount of research has been performed. Mody, Chou, and Friedrich [13], Yamada, Ueda, and Tanaka [14], Petlyuk et al. [15], Khopin [16], Nishiyama et al. [17], Cameron [18] are some of the researchers who have reported friction experiments with either graphites or graphite-filled composites.
As in the experiments with diamonds, there are some variations in their findings. Generally their results indicate that graphite is a very good solid lubricant, with coefficients of friction value in the range of 0.05-0.15, which again agree with our findings at room temperature, as presented later.
Figure 2.2 shows coefficient of friction vs temperature plots for graphite-graphite (circles) and graphite-copper (squares), as reported by Cameron [18]. As may be inferred from the graphite-graphite plot, friction is virtually temperature-independent; this temperature independence has been reported by others as well. The graphite-copper plot shows a coefficient of friction variation that decreases with temperature over the range 100-1500C and increases above 1500C. According to Cameron, the decrease is
attributable to an enhanced oxidation of copper that would facilitate bonding of graphite to the copper substrate; the increase, on the other hand, results in an excessive oxidation that would be detrimental to the bonding [18]. This turn-around temperature varies among substrate materials.
0.9 -0.8 0.7 0.6 0.5 0.4 0.3 0.2 0.1 200 500 Temperature (C)
Figure 2.2 Variation of friction with temperature for graphite on itself (circles) and graphite on copper (squares) [18].
· I·· · · )I. EmEEK *000 I · · · -E
I
3. Experimental Procedure and Materials
3.1 Apparatus
The tests were performed with a rotational pin-on-disk tribometer built to operate in cryogenic temperatures ranging from 4.2 -293 K. Figure 2.1 presents a schematic cross-section of the pin-on-disk apparatus [19]. The test geometry consisted of a rotating specimen disk slid against three hemisperically-ended specimen pins, symmetrically spaced on a 51-mm bolt circle diameter. Symmetrically-spaced pins were used to make the apparatus self-aligning and to permit the simultaneous testing of three specimens under identical test conditions. By concentration the specimens were in contact with a limited number of spots, the relatively simple pin-on-disk geometry facilitates a rapid comparative evaluation of a number of material pairs under different environmental conditions. The apparatus was designed to operate at room temperature in air and at cryogenic temperatures with the specimens immersed in an appropriate cryogenic liquid. Liquid nitrogen was used to achieve and maintain the test temperature of 77 K, liquid helium that of 4.2 K.
The tribometer is capable of operating at nominal sliding speeds between 10-7to 101 s. Velocity is regulated through a computer controlled DC servo motor and a set of precision gear reducers. Normal loads are applied through placing weights on the load ring, which transfers the force through a pulley system. The useful range of loads applied was 7.5 N to 22.4 N. During a test the accumulated sliding distance was calculated using a rotational mechanical counter coupled to the apparatus drive shaft.
The specimen temperature was monitored with a constantan-chromel thermocouple imbedded in the stationary disk sample. To improve low-temperature resolution, the thermocouple was referenced at the boiling temperature of liquid nitrogen. For each measurement, the sliding speed, friction coefficient, and temperature were stored in a data file.
TEFLON BUSHING RM RING LDER T TUBE AFT ECIMEN - PIN \ CENTERING PIN
Figure 3.1 Schematic cross-section of the pin-on-disk apparatus [19].
I \
The friction coefficient is measured by strain arms which prevented the rotation of the outer friction assembly. These friction values are monitored continuously during testing using a computer-based data acquisition system. Although the use of rounded pins results in highly localized contact between the sliding surfaces, the friction coefficients obtained under these conditions are usually valid for less concentrated geometries because the friction coefficient of a sliding pair is usually independent of the apparent contact area [2].
3.2 Materials:
This section presents brief descriptions of the materials used during this investigation. The mechanical properties of these materials are generally well known at room temperature and to a lesser extent at cryogenic temperatures [20-22]. Table 2.1 presents a listing of the materials tested, both in disk and pin form.
Pin Materials Disk Materials
Natural Diamond CVD-Diamond Film
Graphite Graphite
Copper Copper
AISI 440C Stainless Steel AISI 316 Stainless Steel Alumina
Table 3.1 List of pin and disk materials tested.
It was not the intention of this project to examine all possible combinations of materials, but rather to test certain combinations that were of interest. Below is a brief description
of each material.
Natural Diamond is a unique crystalline material with the following extraordinary properties: it is the hardest known material; the best electrical insulator; and the best thermal conductor. At room temperature diamond has a thermal conductivity which is
five times greater than that of copper [23]. Diamond is also chemically inert and resistant to high temperatures, particularly in oxygen-free environments. Until recently, the only property of diamond which was of interest to researchers was its hardness. Diamond was recognized as useful for industrial applications and for the better part of this century its use has been limited to cutting tools and abrasives [24]. Recently, diamond's excellent thermal conductivity has made it one of the most promising materials for high-technology applications, e.g. as a coating material, for computer components to facilitate heat removal, and for heat exchangers to improve efficiency. Because of these reasons, diamond was chosen as one of the test materials to be benefited from many of its extraordinary properties for cryogenic applications.
Graphite is used in many tribological applications. It is a self lubricating material with high resistance to corrosion by most aggressive media except strongly oxidizing acids. It will retain its strength at very high temperatures. The temperature limitations of graphite are related to oxidation. In an oxidizing atmosphere, graphite is satisfactory up to about 5000C. Carbon graphite is a material with low thermal expansion (about 1/4 that of
steel). Thermal conductivity is comparable to aluminum. The material is dimensionally very stable during thermal excursions and is not susceptible to thermal shock. It is a low modulus material - about 10 to 15 times lower than steel. It is also brittle and requires care in handling including minimization of impact loads and tensile stress states when used in design of machine elements [25]. Both graphite pins and disks were used in the experiments.
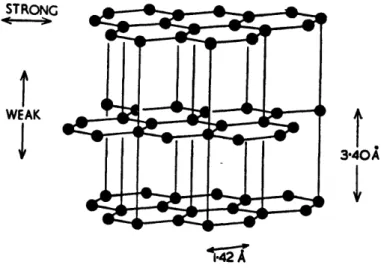
Both diamond and graphite are crystalline forms of carbon [26]. Diamond (Fig. 2.2a) is a three dimensional, covalently bonded solid; its bonding arrangement comprises four equivalent covalent bonds directed towards the four corners of a tetrahedron. By comparison, graphite (Fig. 2.2b) is a layer-lattice material consisting of three equivalent 1200 bonds in the basal plane with a fourth, hybrid resonant orbital directed perpendicular to the plane [24]. Graphite's solid lubricant behavior is attributed to the easy shear of these interplanar hybrid orbitals. Until in the 1950s, only natural diamond
was available. Since then, it has been manufactured as synthetic diamonds, and recently as thin (-lt 1m thick) films deposited on various substrates, e.g. silicon. Diamond coating by chemical vapor deposition (CVD) was developed primarily for electronic applications [27].
Figure 3.2a Crystal structure of natural diamond.
STRONG WEAK
I
3.40At
i*42 A -- qW 1,- Ink ,q IT21.Figure 3.2b Structure of diamond. The bonding between the lamellae is weak
CVD-Diamond Film coated specimens were used in the experiments as disk materials.
Diamonds synthesized by CVD appear to retain the extraordinary properties of bulk diamond. Of several methods to synthesize diamonds, the microwave plasma CVD method was used to produce diamond-coated surfaces for our cryotribological study. In the microwave method, a substrate is placed in a quartz tube and a stream of hydrocarbon gas, e.g. methane diluted by hydrogen, is converted into a film of crystalline diamond by microwave heating. Although silicon is the standard material for substrates, several other substrate materials are possible, including ceramics (silicon carbide, tungsten carbide, silicon nitride, alumina) and metals (tantalum, molybdenum, and tungsten). The diamond is deposited on the substrate at a rate of 0.3~0.5 pm/h. The substrate material used in the experiments was silicon. The CVD-diamond coated disks used in this project were provided by Drs. Koji Kobashi and Takeshi Tachibana of Electronics Research Laboratory of Kobe Steel, Ltd (Kobe, Japan).
Alumina (alumina oxide) was chosen as a representative ceramic. Previous research at
cryogenic temperatures had focused on metals. Ceramics are replacing metals to a large degree and there is interest in observing their properties in cryogenic applications.
Alumina was tested in the form of bearing balls.
AISI 316 stainless steel is nonmagnetic, has excellent corrosion resistance and high creep
strength. It was chosen because it is often used in cryogenic applications as a structural material. It was tested in the form of disks.
AISI 440C stainless steel is an alloy with 16% Cr and 1% C. It is the martensitic
stainless steel which has the highest hardness of any corrosion-resisting steel. Its high hardness is due to a hard martensitic matrix and to the presence of a large concentration
of primary carbides. It was chosen because of its hardness and was tested in the form of bearing balls.
3.3 Sample Preparation
Graphite pins were obtained as 6.35 mm (1/4 in) diameter rods and turned to their final shape using a radius form tool. Alumina oxide and AISI 440C stainless steel pins were obtained in the form of 6.35 mm (1/4 in) diameter balls. Before a test, three of the desired pins were mounted in a brass specimen holder, wiped clean with a swab soaked in methanol, allowed to air dry, and placed into the apparatus. Three natural diamond pieces, each approximately 1/3 carat of irregular shape were mounted to allow contact with the specimen discs.
The graphite disks were machined from plate stock and faced with a single point cutting tool to remove surface irregularities. The disks were then randomly abraded against 320-grit silicon carbide paper under running water; this accomplished to clean disks and to provide a consistent surface finish between tests. Since water does not wet a surface contaminated with organic contaminants, the disks were deemed clean when a water layer wetted the testing surface. The disks were then rinsed with methanol to displace the water layer and air dried on clean tissue paper. Later, the disks were placed in an oven at approximately 1000C, for overnight, to bake away any residual contaminants left on the surface.
The diamond coated disks were made from silicon wafers on which a thickness of 1-2 jtm CVD diamond coating was deposited. The surfaces of the diamond coated disks were used as received, in order to preserve as much coating as possible. To remove possible organic contaminants from the surfaces of the disks, each disk was placed in an
3.4 Testing
After the materials were placed into the tribometer they were slid against one another at various conditions of temperature, sliding speed, applied load, and distance. Two basic scenarios of testing were generally used: 1) friction vs velocity characteristics at constant temperatures; 2) friction vs temperature behavior at fixed sliding speeds.
Friction vs Velocity Characteristics at Constant Temperatures: Three temperature
environments were examined: 4.2 K, with the samples immersed in a liquid helium bath; 77 K in liquid nitrogen; and 293 K in room temperature air. At each temperature, data were collected at six sliding speeds. For each speed setting, a distance of at least 3 mm was covered to allow the measured friction to achieve a steady value [4].
Friction vs Temperature Behavior at Fixed Sliding Speeds: The constant speed selected
for each run was generally 10-5 m/s. This range of speed allows sufficient distance coverage for reliable friction readings at each temperature and yet limits the total sliding distance of the run to ~ 2 m. A slowly changing low-temperature environment was created by first transferring liquid helium or liquid nitrogen into the cryostat and then allowing the apparatus to gradually warm to room temperature. The friction behavior was monitored during both the cool-down and warm-up sequences. Both data sets show similar transition in their friction vs temperature behaviors. However, because of the lower rates of temperature change, typically below 20 K/h in the warm-up sequences,
compared with
IdT/dtl
of 60-80 K/h during cool-down sequences, the warm-upsequences generally produced more consistent data than the corresponding cool-down sequences.
The cryogenic experiments were performed by first lowering the pin-on-disk tester into its cryostat. To prevent any condensation on the test specimens during cool-down, the cryostat was vigorously purged by pumping helium gas through a tube that extended to the bottom of the apparatus. To prevent influx of room temperature air into the cryostat,
flexible rubber seals were installed between the test assembly and the cryostat mounting flange. A sliding fit was used to minimize frictional interaction between the disk's drive shaft and the rest of the apparatus. Air infiltration during the liquid-helium tests was further reduced by providing a small inflow of helium gas to maintain a slight, positive pressure in the cryostat. Heat conduction to the specimens was minimized by suspending the test specimens approximately 1 m below the cryostat mounting flange. The boil-off gas was likewise vented through the apparatus to further reduce the heat flux. The apparatus' quiescent helium boil-off rate was in the range 0.10 ~ 0.20 1/h. , this typically allowed for at least a 30 hr operation for a single helium transfer.
4. Results and Discussions
Tribological data are often unrepeatable and sometimes inexplicable. Friction by its nature is very complex. The factors that contribute to a tribological process may be divided into three classifications: those we know, those we don't, and those we can control. The first is finite, the second may not be, and the third is very finite indeed. The conditions of tribological experiments are particularly crucial. Although utmost care was given during each experiment to be consistent every time, often ambient conditions, e.g. room temperature, air humidity, cleanliness of the air, have kept in to make a difference. When natural variation of the structures and composition of the materials tested are added to the equation, large variability in results were sometimes encountered.
The data gathered will be presented according to two classifications: friction vs velocity experiments; and friction vs temperature experiments.
4.1 Friction vs Velocity Experiments
The figures presented in this section show data taken at discrete sliding velocities at the three reference temperatures specified, namely, 4.2 K, 77 K, and 293 K. The data presented are the arithmetic mean of two trials for each material pair. The two trials agreed to within 10 % of each other at all points for all materials. The data taken at each trial represents the average value of at least 100 friction measurements at each sliding speed. The sliding speeds tested ranged from 10-6 m/s to 10-1 m/s. For each speed setting, a distance of at least 3 mm was covered to allow the measured friction to achieve a steady value. The applied load was 14.3 N.
Figures 4.1, 4.2 and 4.3 show the friction vs velocity behavior for natural diamond pins on CVD-diamond coated disks, AISI 440C stainless steel pins on CVD-diamond coated disks, and graphite pins on CVD-diamond coated disk, respectively. The CVD-diamond
10, 10i 10, 10-2
Sliding Speed (mis)
10-1"
Friction vs velocity plot for natural diamond pins on CVD-diamond film. 0.12 0.1 0.08 0.06 0.04 0.02 0 10` Figure 4.1
293 K
77 K
10i 104 10i 10-2 10-1
Sliding Speed (mls)
Friction vs velocity plot for AISI 440C stainless steel pins on CVD-diamond
0.35 - 0.3-0.25 -0.15 0.05. 10, Figure 4.2 film. __ I
0.12 0.1 -0.08 0.06 0.04 0.02 0 10- 105 104 10,
Sliding Speed (mis)
10-2
Figure 4.3 Friction vs velocity plot for graphite pins on CVD-diamond film.
-1 I ' ·I 4.2 K 2377K 293 K
I
ccoated disk results, with all pin materials, show near constant friction coefficients at each temperature tested. For the natural diamond pins sliding on CVD-diamond at 4.2 K, the coefficient of friction is around 0.09, at 77 K around 0.06, and at 293 K around 0.05 at all sliding speeds tested. For the graphite pins sliding on CVD-diamond at 4.2 K, the coefficient of friction is around 0.08, at 77 K around 0.075, and at 293 K around 0.07 at all of the sliding speeds tested. And for AISI 440C pins sliding on CVD-diamond at 4.2 K, the friction coefficient is around 0.22, at 77 K around 0.215, and at 293 K around 0.235 at all test speeds. It can be seen that any dependence the friction has on the sliding velocity is weak or none. In every case the variation in the friction coefficient is no greater than 6 %. These results can be explained in light of the 3rd quantitative law of friction. The 3rd law states that friction is independent of sliding velocity. The weak dependence may be explained as a result of the dependence of the strength of some materials to the rate of application of the stress. This dependence of strength on the rate of stress is small, but it can account for the weak dependence of the friction on the
sliding speed.
Figures 4.4, 4.5, and 4.6 show friction vs velocity behavior for graphite disks slid against natural diamond pins, alumina pins, and graphite pins, respectively. As can be seen from the figures every pin material slid against graphite disks show a positive friction behavior with increasing sliding speeds at all temperatures tested. For the natural diamond pins sliding on graphite disk, the coefficient of friction climbs from 0.039 to 0.058 at 4.2 K, from 0.051 to 0.075 at 77 K, and from 0.047 to 0.07 at 293 K with increasing sliding speeds. For the alumina pins sliding on graphite disk, the coefficient of friction increases from 0.031 to 0.046 at 4.2 K, from 0.041 to 0.059 at 77 K, and from 0.038 to 0.056 at 293 K. The situation is similar for graphite pins sliding on graphite disks, where the friction coefficient climbs from 0.038 to 0.057 at 4.2 K, from 0.045 to 0.068 at 77 K, and from 0.052 to 0.076 at 293 K with increasing sliding velocities. An increase of about 50 % in coefficient of friction with sliding speeds for graphite disks can be attributed to the continuous creation of wear particles that are later entrapped between the sliding surfaces. Since graphite is a soft material, when it is slid against hard materials like
10. 10- 103 10-2
Sliding Speed (mis)
10-1
Friction vs velocity plot natural diamond pins on graphite disk. 0.12 0.1 0.08 0.06 0.04 0.02 0 106 Figure 4.4
I I I I
104 103
Sliding Speed (mis)
Figure 4.5 Friction vs velocity plot for alumina pins on graphite disk. 0.12 0.1 0.08 0.06 0.04 0.02 0 106 10-2
77 K
293 K
4.2 K
U
L 10-10 10 10- 10"2
Sliding Speed (mis)
Friction vs velocity plot for graphite pins on graphite disk. 0.12 0.1 0.08 0.06 0.04 0.02 0 le 10' 10 -1 Figure 4.6
natural diamond and alumina, the hard pins plow the surface of graphite. As a result of this plowing, graphite is worn at a high rate and wear particles are generated during sliding. When the sliding speed is increased, the rate at which those wear particles are generated is also increased. This results in more wear particles to get entrapped between the sliding surfaces and therefore in a greater coefficient of friction. In the case of graphite disks slid against graphite pins, again wear particles are generated, this time from both surfaces, the disk as well as the pin. Here, adhesion also plays a major role, since pin and disk are of same material, it is much easier for an adhesive junction to be formed between the sliding surfaces due to the chemical compatibility of the opposing surfaces.
Figure 4.7 shows friction vs velocity plot for natural diamond pins slid against AISI 316 stainless steel disks. The friction coefficient stays fairly constant with increasing sliding velocity for tests at 4.2 and 77 K. But on the other hand, 293 K experiments show an increase in the friction coefficient with increasing sliding speeds. The friction coefficient goes from about 0.035 at a sliding speed of 10-6 m/s to about 0.061 at 10"1 m/s, which is
an increase of about 75 %. There could be several possible reasons for this different friction-velocity behavior at different test temperatures. Stainless steels are crystalline solids and the shear strains produced during metallic friction are usually confined to a thin (~ 100 gpm deep) surface layer; the mechanical properties of these near surface layers are often markedly different from the crystal's bulk mechanical properties [28,29]. The second reason could be: because of the large incremental strains produced during each asperity encounter the junction's flow properties could change markedly from the inception of the asperity contact, its growth to full strength, and subsequently separation. And the final reason could be, the existence of broad transitions between a metal's deformation-rate and temperature-dependent flow properties greatly limits a single friction-velocity characteristics which would be valid for a whole range of temperatures.
10- 10-4
10-Sliding Speed (mis)
10-2 10"1
Friction vs velocity plot for natural diamond pins on AISI 316 stainless steel 0.12 0.1 0.08 0.06 0.04 0.02 0 10" Figure 4.7 disk.
4.2 Friction vs Temperature Experiments
The figures presented in this section show friction vs temperature curves for different material pairs over the temperature range 4.2 K - 293 K at a sliding speed of 10-5 m/s
and a normal load of 14.3 N. Data was taken at about 3 K intervals and the total sliding distance was about -2.0 m.
On Figures 4.8 and 4.9, friction vs temperature plots for natural diamond pins on graphite disk and alumina pins on graphite disk, respectively, can be seen. For both material pairs, below approximately 80 K, a roughly constant friction value is exhibited. In the case of natural diamond pins slid against graphite disk, this value is around 0.045 and in the case of alumina pins slid against graphite, it is around 0.035. In both material combinations, between 80 K and approximately 250 K, the friction coefficient undergoes a rapid transition to much higher values. For natural diamond-graphite, this range is 0.05-0.1 and for alumina-graphite pair 0.04-0.09. This irregular variation in the friction trace is attributed to macroscopic stick-slip, typically observed in this temperature range [30,31,32]. For both cases, the coefficient of friction goes back to a much lower value with the temperature increasing from 250 K to room temperature of 293 K. Natural diamond-graphite pair reaches a friction coefficient of 0.05 and alumina-graphite friction coefficient of about 0.04.
Figure 4.10 shows friction vs temperature curve for graphite pins slid against graphite disks. This curve is similar to the ones of natural diamond and alumina pins with one difference though. The peak of friction coefficient here is much smaller than the other two cases. Here, the coefficient of friction starts at 0.04 and stays around that value for a temperature range of approximately 4.2 K-85 K. Between 85 K and 200 K it undergoes a smaller transition to higher values, namely, from 0.05 to 0.65. The friction coefficient goes back to a smaller value of about 0.05, once room temperature of 293 K is reached.
0.12 0.1 0.08 0.06 0.04 0.02 0 0 50 100 150 200 250 300 Temperature (K)
Figure 4.8 Friction vs temperature plot for natural diamond pins on graphite disk
0.12 0.1 0.08 0.06 0.04 0.02 C 300 0 50 100 150 Temperature (K)
Friction vs temperature plot for alumina pins on graphite disk (v= 105m/s).
0.12 0.1 0.08 0.06 0.04 0.02 -100 200 250 Temperature (K)
Friction vs temperature plot for graphite pins on graphite disk (v=10'5m/s). 300 I · ( 1 · r Figure 4.10 (LC~L·IIL~
~C~Yhr
For natural diamond, alumina, and graphite pins slid against graphite disks, there seems to be a correlation between friction and hardness of materials at different temperatures. The friction coefficient is lower in all three cases at lower temperatures. The hardness of materials increases with a decrease in temperature, this corresponds to friction being inversely proportional to hardness, for each particular material.
Figures 4.11, 4.12, and 4.13 show friction coefficient versus temperature plots for natural diamond pins, graphite pins, and AISI 440C stainless steel pins slid against CVD-diamond film, respectively. The applied load was 14.3 N, the sliding speed was 10-5 m/s,
and the sliding distance was ~2.0 m. From the figures we can see that there is a trend of friction decreasing with temperature, with the exception of AISI 440C pins. In the case of natural diamond slid against CVD-diamond film, the coefficient of friction starts at a "pretty" high value of 0.09 at 4.2 K. The friction coefficient undergoes a rapid decrease from 4.2 K to about 77 K, at which point it reaches a value of 0.06. From then on to about 240 K, it maintains this value and between 240 K and 293 K it goes down to a value of about 0.05. There is evidence that structural and chemical similarity and compatibility leads to more severe frictional behavior [33]. Therefore, it was expected that natural diamond due to its compatibility with the CVD-diamond film would have a high friction characteristic, but our results appear to be quite the opposite, natural diamond has very low friction, namely around 0.05 at most of the temperature range tested. While we would expect the adhesion between the diamond film and natural diamond to be strong which would provide for a high friction coefficient, its high hardness could account for the low friction observed.
As can be seen in Figure 4.12, graphite pins on CVD-diamond film disks show a fairly constant friction coefficient throughout the temperatures tested, namely around 0.07~0.08. The friction values are not as stable as the natural diamond-CVD diamond film pair though. Even though it is a small variation, the friction coefficient shows some unstability and variation, especially between 50 K-250 K. This can be attributed by the
N·
S+ 9.
150
Temperature (K)
Figure 4.11 Friction vs temperature plot for natural diamond pins on CVD-diamond film disk (v=105m/s). 0.12 0.1 0.08 0.06 0.04 0.02-0 100 200 300 I
I
0.12 0.1 - 0.08-0.06 0.04 0.02 100 150 Temperature (K) Figure 4.12 (v= 105m/s).
Friction vs temperature plot for graphite pins on CVD-diamond film disk
200 250 300
I _ _ T 1
+
I
0.35-0.3 -0.2 15. 0.05 100 150 Temperature (K)
Figure 4.13 Friction vs temperature plot for AISI 440C stainless steel pins on CVD-diamond film disk (v=10"5m/s).
300
*
ww
W
r
+
particles are generated and those particles are entrapped between the sliding surfaces, thereby increasing the friction. As the sliding continues, those particles are either plastically deformed or kicked away from the sliding path, hence reducing the friction. This process of wear particles being generated and later eliminated from the sliding surface could account for the variation in the coefficient of friction.
Figure 4.14 shows friction-temperature plot for natural diamond pins slid against AISI 316 stainless steel disks. During the low-to-moderate-temperature transition the friction coefficient passes from a low, velocity-independent value to a much higher value. This low-temperature transition is also reported by Bowden and Childs for the face-centered-cubic (fcc) metals: gold, silver, copper and nickel, and for the body-centered-face-centered-cubic (bcc) metals: tantalum and tungsten [31]. This transition is attributed to the marked decrease in fcc metal's initial strain hardening rates above the metal's frictional transition temperatures [31]. As can be seen from Figure 4.14, during the moderate-to-high-temperature transition the friction coefficient goes from high to low friction values. This behavior also appeared in tribological literature [34,35]. The high-temperature transition is attributed to thermal softening that occurs in a specimen's near-surface layers as the sliding temperature increases. Reduced friction coefficients are observed when the interfacial shear strength decreases more rapidly with temperature than the junction's penetration hardness [34].
0.12 0.1 0.08 0.06 0.04 0.02 0 Figure 4.14 50 100 150 200 250 300 Temperature (K)
Friction vs temperature plot for natural diamond pins on AISI 316 stainless steel disk (v= 105m/s).
It is important to realize what kind of effect hardness of materials tested could have on friction. If one or both of the sliding materials is soft, the real area of contact Ar will be large. But in this case, the material at the interface which must be sheared is a soft material for which the shear strength, s, value is low. Conversely, if a hard material is slid on a hard material, the real area of contact Ar will be small and shear strength, s, will
be large. Consequently, the friction for a soft material will not be very different from that observed for a hard material.
Table 4.1 Summary of friction coefficient values for the materials and temperatures tested.
Materials
Natural Diamond Pins on Graphite Disk Alumina Pins on Graphite
Disk
Graphite Pins on Graphite Disk
Natural Diamond Pins on CVD-diamond Film Graphite Pins on
CVD-diamond Film AISI 440C SS Pins on
CVD-diamond Film Natural Diamond Pins on
AISI 316 SS Disk Friction Coefficient at 4.2 K at 77 K at 293 K 0.042 0.055 0.05 0.032 0.042 0.040 0.04 0.047 0.053 0.09 0.06 0.05 0.08 0.074 0.07 0.22 0.216 0.234 0.045 0.075 0.035
5. Conclusions
In this research, we examined friction behavior of various hard materials of interest to cryogenic applications slid against graphite and CVD-diamond film. The range of temperatures investigated was 4.2 K to 293 K, with particular emphasis on 4.2 K, liquid helium temperature, 77 K, liquid nitrogen temperature, and 293 K, room temperature. The examinations led to the following conclusions:
Friction vs Velocity Experiments
(1) Materials whose friction coefficients increase with sliding speed are widely proposed as a means to insure sliding stability. We found through our investigation that natural diamond, alumina, and graphite pins slid against graphite disks show this kind of relationship. Graphite, thanks to its desirable frictional properties, is widely used as friction-reducing coatings in many applications. Our findings suggest that it can also be used in cryogenics applications.
(2) In the case of natural diamond, graphite, and AISI 440C stainless steel pins slid against CVD-diamond film, the coefficient of friction is virtually velocity-independent.
(3) For natural diamond pins slid against AISI 316 stainless steel, friction coefficient stays fairly constant with increasing sliding velocities fro tests at 4.2 K and 77 K. But, 293 K experiments show an increase in the friction coefficient with increasing sliding speed. This different friction-velocity characteristics may be due to the existence of broad transitions between a metal's deformation-rate and temperature-dependent flow properties which greatly limits a single friction-velocity characteristics for any test temperature.
Friction vs Temperature Experiments
(1) In our investigations, we have found that experiments involving natural diamond, graphite, and AISI 440C stainless steel pins slid against CVD-diamond film in a temperature range of 4.2 K to 293 K show a fairly constant friction behavior. Only in the case of natural diamond slid against CVD-diamond film, the coefficient of friction starts at a high value of 0.09 at 4.2 K and becoming constant at about 0.05 between 77 K and 293 K. For graphite pins slid against CVD-diamond film, we have slightly different characteristics. Even though the friction coefficient varies in the of 0.07 ~ 0.08, a more unstable behavior is observed. This can be attributed either to stick-slip between graphite and CVD-diamond film or to wear particles being generated and later eliminated continuously at the sliding interface. But in any case both material pairs, especially natural diamond paired with CVD-diamond film, seems to be a promising combination for applications where stable friction behavior is desired.
(2) All materials slid against graphite disks show a peak friction coefficient value at a temperature around 100-200 K. For these materials there seems to be a correlation between friction and hardness of materials at different temperatures. The friction coefficient is lower at lower temperatures. The hardness of materials increases with a decrease in temperature, this corresponds to friction being inversely proportional to hardness, for each particular material.
(3) For natural diamond pins slid against AISI 316 stainless steel disks, during the low-to-moderate-temperature transition the friction coefficient passes from a low, velocity-dependent value to a much higher value. This behavior could be attributed to the marked decrease in fcc metal's initial strain hardening rates above the metal's frictional transition temperatures. During the moderate-to-high-temperature transition the friction coefficient goes from high to low values. This behavior is attributed to thermal softening that occurs in a specimen's near surface layers as the sliding temperature increases.
References
[1] Lubrication (Tribology) Education and Research - A report on the present position and industry's needs, Her Majesty's Stationery Office, London (1966).
[2] E. Rabinowicz, Friction and Wear of Materials, John Wiley, New York (1965).
[3] Horst Czichos, Tribology, A System Approach to the Science and Technology of Friction and Wear, Elsevier Scientific Publishing Company (1978).
[4] E. Rabinowicz, "Autocorrelation analysis of the sliding process," J. Appl. Phys. 27, 131-135 (1956).
[5] E. Rabinowicz, "A study of the stick-slip process," Friction and Wear: Proc. Symp. on Friction and Wear, Detroit, 1957 Elsevier, New York (1959) 149-164.
[6] E. Rabinowicz, "The intrinsic variables affecting the stick-slip process, " Proc. Phys. Soc. London, 71 (1958) 668-675.
[7] F.P. Bowden, and D. Tabor, Friction and Lubrication, Latimer Trend & Co. Ltd., Whitstable (1967).
[8] M.N. Gardos, and B.L. Soriano, "The effect of environment on the tribological properties of polycrystalline diamond films," J. Mater. Res., Vol. 5, No. 11 (Nov. 1990). [9] B. Samuels, and J. Wilks, "The friction of diamond sliding on diamond," J. Mater. Science, 23 2846-2864 (1988).
[10] M. Kohzaki, K. Higuchi, S. Noda, and K. Uchida, "Tribological characteristics of polycrystalline diamond films produced by chemical vapor deposition," J. Mater. Res.,
Vol. 7, No. 7 (Jul. 1992).
[11] K. Jia, Y.Q. Li, T.E. Fischer, and B. Gallois, "Tribology of diamond-like carbon sliding against itself, silicon nitride, and steel," J. Mater. Res., Vol. 10, No. 6 (Jun. 1995).
[12] F.P. Bowden, and A.E. Hanwell, Proc. Roy. Soc. A 295 233 (1966).
[13] P.B. Mody, T. Chou, and K. Friedrich, "Effect of testing conditions and microstructure on the sliding wear of graphite fiber/PEEK matrix composites, " J. Mater. Science, V. 23, No. 12, 4319-4330 (Dec. 1988).
[14] Y. Yamada, S. Ueda, and K. Tanaka, "Effects of temperature on the friction and wear of poly(amide-imide)-based composites," J. Japan Soc. Lub. Eng., V. 33, No. 6, 458-466 (1988).

![Figure 2.2 Variation of friction with temperature for graphite on itself (circles) and graphite on copper (squares) [18].](https://thumb-eu.123doks.com/thumbv2/123doknet/14525932.532409/20.918.136.757.233.643/figure-variation-friction-temperature-graphite-circles-graphite-squares.webp)
![Figure 3.1 Schematic cross-section of the pin-on-disk apparatus [19].](https://thumb-eu.123doks.com/thumbv2/123doknet/14525932.532409/22.918.298.785.183.937/figure-schematic-cross-section-pin-disk-apparatus.webp)