Cost of quality tradeoffs in manufacturing process and
inspection strategy selection
ACHUSETTS INSTITU-OF TECHNOLOGY
by
Hadi Zaklouta
RA R IE S
Bachelor of Science in Materials Science and Engineering
Massachusetts Institute of Technology, 2009
ARCHivEs
Submitted to the Department of Materials Science and Engineering
in partial fulfillment of the requirements for the degree of
Master of Science in
Materials Science and Engineering
at the
MASSACHUSETTS INSTITUTE OF TECHNOLOGY
September 2011
© Massachusetts Institute of Technology 2011. All rights reserved.
Signature of Author...
...
Department of Materials Science and Engineering
August
8th
2011
Certified by....
C,-
...
Joel. P. Clark
Professor, Department of Materials Science and Engineering
and the Engineering Systems Division
Thesis Supervisor
Certified by...
...
Richard Roth
Director, Materials Systems La oratory
II'hesi<Co-Advisor
Accepted by...
...
Christopher Schuh
Chair, Department Committee on Graduate Students
Professor, Department of Materials Science and Engineering
Cost of quality tradeoffs in manufacturing process and inspection
strategy selection
by
Hadi Zaklouta
Submitted to the Department of Materials Science and Engineering on August 8th, 2011, in partial fulfillment
of the requirements for the degree of
Master of Science in Materials Science and Engineering
Abstract
In today's highly competitive markets manufacturers must provide high quality products to survive. Manufacturers can achieve higher levels of quality by changing their manufacturing process and/or by product inspection where a multitude of different strategies are often available. Each option has its own cost implications that must also be taken into account. By reconciling the competing objectives of quality maximization and cost minimization, a cost of quality approach serves as a useful framework for comparing available manufacturing process and inspection alternatives. Still, any rigorous comparison requires both a metric as well as a profound understanding of cost of quality tradeoffs.
The cost of quality tradeoffs in manufacturing process and inspection strategy selection are examined through a probabilistic cost of quality model explored analytically using a sample set of fundamental inspection strategies (reinspect rejects, reinspect accepts and single inspection) and applied to the case of electric vehicle battery pack assembly. From an expected value point of view a series of parametric sensitivity analyses reveal that complex tradeoffs between manufacturing process, inspection, internal-and external failure costs determine the optimal manufacturing process internal-and inspection strategy combination. In general, reinspect rejects minimizes internal failure costs, reinspect accepts minimizes external failure costs and single inspection lies in between while minimizing inspection costs. This thesis illustrates the fact that results are scenario specific and depend on product cost-, manufacturing process-and available inspection method attributes. It is also observed that manufacturing process improvement often coincides with a need to change inspection strategy choice, thereby indicating that manufacturing process and inspection strategy selection should not be performed independently of each other.
This thesis demonstrates that the traditional expected value approach for evaluating cost of quality implications of manufacturing and inspection is often misleading. Decision tree formulations and discrete event simulations indicate that cost of quality distributions are asymmetric. High internal- and external failure costs, manufacturing process non-conformance rates and inspection method error rates are contributing factors. The alternative metric of expected utility captures decision makers risk aversion to high cost outliers and changes the criteria for optimality and favors inspection strategies and manufacturing processes that minimize external failure events with increasing risk intolerance.
In the examined case of electric vehicle battery pack assembly both material- and external failure costs are very high. Analytical and discrete event simulation results indicate that for the given welding process the inspection strategy that minimizes external failure costs is optimal from an expected cost point of view as well as at high degrees of risk aversion. This result is shown to be sensitive to parameters driving the cost and probability of external failure events.
Thesis Supervisor: Joel P. Clark
ACKNOWLEDGEMENTS
I first want to thank everyone at MSL for the opportunity to work alongside them in my past two
years here. I have learned a lot from each and every one of you and I wish you the best of
success in your future endeavors. I especially want to thank Randolph Kirchain, Frank Field and
Rich Roth; you have all provided me with much advice and support in these busy years.
Rich-thank you above all for your insights, both personal, academic and research related- it is hard to
imagine where I would be where I am without your help and encouragement. Thank you,
Professor Joel Clark. It was your rewarding class and shared experiences that sparked my interest
in MSL.
I also owe much of my personal and academic success to my friends and colleagues. I would like
to thank Siamrut, Tracey and Tommy for making MSL particularly fun. My fellow MIT and
Number Six friends have been a great source of support as well and I hope we all stay in touch
after graduation.
Last but not least I wish to thank my family. Thank you mom and dad for being my role models
and always being there to support me in the past 6 years despite the long distance from home.
Fatin and Nadja: thanks for being the greatest sisters one could imagine- I love you both very
much.
Table of Contents
S
Introduction...62 Literature Review ... 8
2.1 Cost of Quality...8
2.2 Inspection Strategy...10
2.3 Metrics for manufacturing process and inspection strategy selection...11
2.4 Cost and quality tradeoffs in process and inspection strategy selection ... 11
2.5 Gaps ... 14
3 Problem Statem ent ... 16
4 M ethodology ... 18
4.1 CoQ fram ework ... 18
4.2 Analytical approach ... 20
4.2.1 Inspection strategies ... 20
4.2.2 Expected value approach ... 21
4.2.3 Cost distribution approach ... 34
4.3 D iscrete event simulation...44
5 Analytical Results ... 48
5.1 Baseline scenarios...48
5.2 Expected value param etric sensitivity... 50
5.2.1 Baseline values... 50
5.2.2 Cost Sensitivity ... 52
5.2.3 M anufacturing process conform ance rate sensitivity... 56
5.2.4 Inspection error rates sensitivity ... 58
5.2.5 Sensitivity analysis on m anufacturing process choice ... 60
5.3 CIM I distribution ... 62
5.3.1 Effect of unit costs on CIM distribution ... 64
5.3.2 Effect of manufacturing process non-conformance rate on CIM distribution ... 64
5.3.3 Effect of inspection error rates on CJM I distribution... 65
5.4 Utility Analysis ... 67
5.4.1 Expected Utility sensitivity analysis ... 68
6.1 Background ... 78
6.1.1 M otivation...78
6.1.2 Objectives...79
6.1.3 M ethodological Approach... 79
6.2 M odel Details...84
6.2.1 Assem bly Details ... 84
6.2.2 Inspection Strategy Variations... 86
6.2.3 Param eter Inputs ... 87
6.3 Results...90
6.3.1 Expected Value Analysis ... 90
6.3.2 CIM I distribution com parison... 98
6.3.3 Utility com parison: sensitivity to risk intolerance ... 98
7 Conclusion ... 100
7.1 Conclusions from analytical study...100
7.2 Conclusions from case study... 102
7.3 Im plications on decision m aking ... 103
7.4 Future w ork...103
8 References... 105
1 Introduction
Given the highly competitive nature of markets today, companies must provide high quality products or services to survive. In today's markets quality has become a crucial competitive factor. It is not surprising therefore that the provision of high quality products or services is often mentioned as a goal in most companies' mission statements.
In manufacturing industries, the general term "quality" refers to what quality management literature divides into the two complementary categories of quality of design and quality of conformance. Whereas quality of design focuses on how the product design meets consumer requirements, quality of conformance is concerned with whether the quality produced and provided to the consumer meets the intended design. Both quality levers act jointly to determine the quality perceived by the consumer. Yet while quality of design is an integral part of product quality, it only has a minor impact on the tradeoffs between manufacturing processes and inspection strategies- the subject of this thesis- and is therefore best held constant. On the other hand, quality of conformance plays a central role in manufacturing process and inspection strategy selection.
All manufacturing processes are imperfect and have an associated non-conformance rate. Manufacturers seeking to achieve higher quality of conformance have a wide range of options to choose from. These can be divided into two categories; improving produced quality of conformance via defect prevention and improving quality of conformance delivered to the customer via inspection.
Possible methods of prevention include manufacturing process change or improvement, worker training and supplier audit programs. The 1980s saw a surge of interest in developing and implementing programs geared at improving manufacturing process quality of conformance. The most renowned methodologies proposed since then include Total Quality Management (TQM), Toyota Production Systems' Kaizen and Six Sigma from Motorola.
For a fixed choice of manufacturing process, the key lever controlling the subsequent outgoing quality of conformance is inspection. The goal of inspection is to identify produced defects before they are delivered to the customer. Even within inspection itself, a wide range of strategy alternatives are available. Amongst others, these strategies may differ in the choice of inspection arrangement within a series of manufacturing processes, screening limits, inspection methods as well as inspection allocation (from 0%
to 100%).
Where many different paths towards the goal of achieving high quality exist, finding the most efficient and cost effective one can be a difficult task for manufacturers. Especially in multistage manufacturing
systems, where the interplay between manufacturing processes and inspection strategies can become very complex, manufacturing companies face the difficult task of selecting a manufacturing process and inspection strategy combination that maximizes quality of conformance at the lowest cost possible. In trying to address the competing objective of cost minimization and quality of conformance maximization, one must first understand the cost and quality of conformance tradeoffs between different inspection strategies and manufacturing process options. In addition, any metric that seeks to compare different options must reconcile the competing cost and quality of conformance objectives.
This thesis will outline the development of a single metric that captures both cost and quality implications of different manufacturing and inspection options by measuring all costs associated with different levels of quality of conformance. This metric will incorporate costs pertaining to prevention, inspection as well as consequences of imperfect quality of conformance including rework, scrap and on field failure costs. By having a single metric of comparison, one can discuss the tradeoffs in manufacturing process and inspection strategy selection.
2 Literature Review
In literature, the most prevalent approach for reconciling the competing objectives of cost minimization and quality of conformance maximization is the cost of quality (CoQ) approach [1]. A wide range of research papers in the fields of industrial or quality engineering discuss the theory behind CoQ. Meanwhile, the operations research discipline addresses specific dimensions within inspection strategy optimization for a fixed choice of manufacturing process. Most papers in this field take into account both cost and quality aspects of inspection, albeit to varying degrees. The following section will summarize research to date pertaining to both the theory of CoQ and inspection strategy optimization. This section ends with a discussion of how the literature addresses or does not address cost and quality of conformance tradeoffs as well as the metrics used for manufacturing process and inspection strategy selection.
2.1 Cost of Quality
The CoQ approach offers a way to reconcile manufacturers' two conflicting objectives of maximizing quality of conformance and minimizing cost. By attaching costs to quality of conformance, this approach transforms the dual objective into one objective of cost of quality minimization. This allows for an easier comparison of manufacturing process and inspection strategy options.
Yet there is no single definition of CoQ and its constituent cost elements. The first formal definition of cost of quality can be traced back to Jurans' Quality Control Handbook [1] and includes all the costs that would disappear if no defects were produced. Since then, the concept of CoQ has undergone a series of modifications and refinements. Crosby was the first to break down CoQ into conformance and non-conformance costs [2], where non-conformance costs are all costs required to reach a specified level of quality of conformance and non-conformance costs are the resultant costs of imperfect level of quality of conformance. In one of the few recent and thorough literature reviews on the topic of CoQ, Schiffauerova et al. [3] provide the most comprehensive overview of existing CoQ models which also include opportunity cost models, process cost models, ABC models and the prevention-appraisal-failure (P-A-F) model. These models vary in how they categorize, include and emphasize different cost elements within CoQ.
The P-A-F model is said to be the latest theoretical innovation in CoQ [4] and since its adoption by the American Society for Quality Control [5], has been used extensively [6]. It is also the model that will be referred to throughout this thesis. In his P-A-F model formulation, Feigenbaum [7] divided CoQ into the three interrelated categories of prevention, appraisal and failure costs. Here, prevention costs refer to all costs incurred in decreasing the frequency of process non-conformance occurrences. Amongst others,
these include scheduled equipment maintenance, tool replacement and investments in worker training. Appraisal costs are the costs involved in attempting to detect non-conformance through inspection or testing. The last P-A-F category, failure costs, is further divided into internal and external failure costs. Internal failure costs occur after appraisal and declarations of product non-conformance and include costs of rework attempts and scrap when rework is no longer possible. Whereas internal failure costs occur at the manufacturing plant prior to product release, external failure costs occur when a non conforming product is erroneously delivered to the consumer and fails on-field. Examples of external failure costs are warranty claims and loss of goodwill and sales. Table 1 provides examples of other costs that belong to each category [8].
Table 1: Table showing examples of prevention, appraisal, internal- and external failure costs
Prevention Appraisal Internal Failure External Failure
Design and development Receiving inspection Scrap Lost profit/sales of equipment
Quality review Laboratory inspection and Rework and repair Loss of goodwill testing
Maintenance and In-process inspection Rescheduling due to Warranty calibration of production (sensors and signals) downtime
and inspection equipment
Supplier quality audits Final inspection Overtime to cover Product recalls (100%/sampling production losses
inspections)
Quality training (seminars, Field testing (performance Downgrading Allowances workshops/lectures) tests and status reporting)
Quality improvement Inspection and test Complaint adjustment
programs equipment
Cost of support operations The cost of quality categorization referred to throughout this thesis is the P-A-F model. However for the purpose of comparing different available manufacturing processes, the prevention category is expanded to include the examined manufacturing process' cost. This modification is justified if one considers that adopting a manufacturing process with lower non-conformance rate is itself a prevention strategy with an associated cost. Although one may argue that one should therefore include only the incremental cost of process change or improvement, from a comparison point of view the results are identical.
2.2
Inspection Strategy
Inspection is a major element of appraisal in the P-A-F categorization of CoQ and a key lever controlling outgoing quality of conformance. Note that although inspection is a specific, non-destructive, form of testing, the term testing is often used interchangeably to refer to inspection.
The objective of inspection is to distinguish between conforming and non-conforming products produced by an imperfect manufacturing process with an associated non-conformance rate. Yet inspection is imperfect in that both type I and type II errors can occur. Type I error refers to false rejections of conforming quality while type II error refers to false acceptance of non-conforming quality.
Conforming Non-conforming
0 Ideal
Figure 1: inspection methods are imperfect and can result in type I or type II errors
In the broadest sense, type I error can lead to erroneous product scrapping while type II error can lead to on-field product failure. The consideration of inspection imperfection is present in most models in operations research literature and the primary goal of research in this field has been to formulate ways for optimizing inspection strategy in terms of minimizing cost of inspection and scrapping and maximizing quality of conformance being delivered to the customer.
Many studies in this field focus on a set of specific dimensions in inspection strategy optimization. Tang and Tang [9] provide a comprehensive overview of some of these explored dimensions. These include papers that discuss how to sequence independent [10-11] or dependent [1 2] multi-characteristic inspections or how many repeat inspections [13-14] to perform. Other studies seek to find the optimal batch size in acceptance sampling [15-17], ranging from 0% to 100% inspection, or the optimal choice of screening limits [18] beyond which inspected products are rejected. Only a few studies are more general in that they describe a higher level methodology for modeling inspection strategy. Fisher et al. [19] present a modular, directed graph, approach to model inspection networks that include repair nodes.
2.3
Metrics for manufacturing process and inspection strategy selection
As mentioned in section 2.1, a cost of quality metric can reconcile the competing cost and quality of conformance objectives in manufacturing process and inspection strategy selection. Papers presenting a theoretical discussion of CoQ as well as simulation or system dynamics models found in literature take a deterministic total cost of quality point of view when addressing CoQ. Similarly, empirical studies of CoQ discuss a posteriori deterministic findings of CoQ in industry. Research papers in inspection strategy literature incorporate the probabilistic nature of manufacturing non-conformance and imperfect inspection method declarations and take a CoQ approach of attaching penalty costs to internal or external failure and seek to minimize total expected cost. Yet while some of these papers include external failure in the formulation for total expected cost, others impose a six-sigma based constraint on outgoing quality of conformance in their expected cost minimization objective function [14, 20].
2.4 Cost and quality tradeoffs in process and inspection strategy selection
Cost and quality tradeoffs can be understood by examining the relationship between the different cost categories within CoQ. At a higher level one can distinguish between CoQ literature that engages in a theoretical discussion of the presumed relationships and literature that is more applied, either empirical or analytical in nature.
Within the more theoretical literature, the Lundvall-Juran curve [21] (Figure 2a) shows the classical view of CoQ tradeoffs. The basic supposition is that achieving higher quality levels requires marginally increasing conformance expenditures and that perfect quality is infinitely expensive and therefore unattainable. Meanwhile, the resulting non-conformance costs are expected to decline at a decreasing rate. The cost of quality is then the sum of conformance and non-conformance costs and has a parabolic shape with a minimum at the point where the marginal cost of conformance is equal to the marginal savings in nonconformance costs. This point is referred to as the economic quality level (EQL). Put into the context of P-A-F, the earlier version of the Lundvall-Juran curve defines conformance cost as the sum of prevention and appraisal costs and the nonconformance cost as the sum of internal and external failure costs. Yet, Plunkett and Dale [22] indicate that the x axis denoting conformance is ambiguous and could refer to either quality of conformance resulting from the process or that delivered to the customer. If the definition of quality of conformance is restricted to that which results from the manufacturing process, appraisal costs are expected to decrease with conformance level. This version of the Lundvall-Juran curve (Figure 2b) suggests an identical tradeoff between appraisal + failure costs and prevention costs as well as a parabolic cost of quality curve and an EQL.
Figure 2: a) Original Lundvall-Juran curve depicting relationship between conformance and non-conformance costs and the cost of quality minimizing point (economic quality level) b) P-A-F version of Lundvall-Juran curve
depicting presumed relationship between prevention and appraisal+failure costs
b)) " 0
k
ecnoi q---- cn Im qualguic ".-mzI % %j~ C.00The notion of EQL is challenged by the more recent view of Total
Quality
Management (TQM).Advocates of TQM argue that zero defects is the optimal quality level [22-23]. This zero defect viewpoint is depicted in Figure 3. Relating this back to the Lundvall-Juran curve they suggest that the per
conforming item cost of attaining perfect process quality is not infinite and that at higher levels of process quality of conformance, the combined cost of prevention and appraisal is marginally decreasing with quality of confralify o lpforancets needed [24]. Fine [25] and Li et. al. [26] reconcile the classical and the TQM viewpoints by showing that the consideration of quality learning over time favors continuous improvement (see Figure 4). In their generic model of CoQ, quality learning leads to a reduction of both prevention and appraisal costs thereby shifting the EQL to higher values and eventually reaching the zero defect level. This thesis, however, does not consider quality learning and will limit its
Cost of Quality =
prevention + appraisal +failure
% C
oc Process quality of conformance 10'*
Figure 3: TQM perspective on the relationship between failure costs and prevention+appraisal costs indicating that zero defects is the cost minimizing process quality of conformance level
EQLtji EQLVr't)
Figure 4: Fine's illustration of how quality learning decreases prevention and appraisal costs thereby shifting the economic level of quality to higher values over time
The more applied literature on CoQ tradeoffs consists of simulation based models or empirical studies. Simulation tools [27-28] and system dynamics models [29] have been developed to estimate the breakdown of CoQ for specific companies. DeRuyters et al. [28], for example, applied simulation to study total cost of quality in an automotive stamping plant and Kiani et al. [29] applied system dynamics to a printing company case study. Using a system dynamics model, Burgess [30] reconciles the classical and
the TQM views of CoQ by suggesting that the classical view may hold under certain time constraints. Meanwhile, the literature pertaining to CoQ tradeoffs is abundant with empirical studies. These studies apply regression on data obtained from industry to discern the relationships between the different cost elements in CoQ. Omachonu et al.[31] analyzed data from a wire and cable company to establish an inverse correlation between appraisal cost plus prevention cost and failure costs as well as a positive correlation between appraisal plus prevention costs with quality. Foster [32] observed similar trends in the auto parts manufacturing industry. Ittner et al. [33] collected cost of quality data over time from 21 companies in 5 different industry sectors to demonstrated that prevention and appraisal costs went down with time as quality improves autonomously.
When the manufacturing process is fixed, the tradeoffs in inspection strategy selection are between appraisal, internal failure and external failure costs. Perhaps it is because most attention is given to the application of circuit board assembly [34-35], a product with relatively mild on-field failure cost implications, that there is a strong interest in studying the effects of internal failure cost on inspection strategy selection. Greenberg et al. [14] demonstrate that under an outgoing quality of conformance constraint repetitive testing of rejected items is favored over repetitive testing of accepted items when the internal cost to test cost ratio is high and the manufacturing non-conformance rate is low enough for the outgoing quality of conformance constraint to be non-binding. Conversely, when the constraint is binding, repetitive testing of accepted items is favored while when the ratio of internal failure to test cost is low, no repetitive testing is favored.
2.5
Gaps
The metrics chosen in literature to reconcile the cost and quality of conformance objectives in manufacturing process and inspection strategy selection lie within the realm of CoQ. Research papers are divided between those that model or measure CoQ from a deterministic total cost perspective and those that take an expected value approach. Yet no papers discuss the implications of statistical variability on decision making. One can expect that each manufacturing process and inspection strategy option results in a unique cost of quality distribution the asymmetry of which is amplified by the probabilistic occurrence of internal and external failure. Consequently, the effect of decision maker's risk tolerance to this asymmetry in the cost distribution is not addressed in literature. This thesis seeks to bridge this gap in literature by examining the drivers of this asymmetry and its effect on selection of manufacturing process and inspection strategy for different risk aversion profiles.
As mentioned in section 2.4, examining the relationship between the constituents of CoQ as outlined by the P-A-F model allows for an exploration of the cost and quality of conformance tradeoffs in
manufacturing process and inspection strategy selection. However, there have been surprisingly few analytical attempts at modeling these tradeoffs. Most theoretical models of CoQ apply generalized functional forms to the different components of CoQ. Only a few authors, namely Weheba and Elshennawy [36], have mathematically incorporated inspection errors into CoQ models. In this particular case the authors limit their analysis to exploring the economic gains of process improvement options for a fixed inspection strategy. Even within the abundance of analytical inspection strategy optimization models found in literature, there is a lack of sensitivity analyses performed on parameters driving inspection strategy selection when the choice of manufacturing process is fixed. This thesis will model the cost and quality tradeoffs and explore driving parameters in both manufacturing process and inspection strategy selection. It will do so both from an expected cost point of view as well as from a perspective taking cost distribution asymmetry and decision makers' risk aversion into account.
3
Problem Statement
In selecting manufacturing process and inspection strategy, decision makers must first understand the cost and quality of conformance tradeoffs of all available options. This understanding can be achieved by examining the tradeoffs within a cost of quality framework. For the purpose of comparing different manufacturing process and inspection strategy options it is also necessary to use a metric that captures the risk implications of each. The objectives of this thesis can be summarized in three questions.
e For a given choice of manufacturing process, what cost of quality tradeoffs exist among different inspection strategies?
For a fixed choice of manufacturing process, inspection is implemented with the goal of preventing external failure occurrences. Due to the cost and error characteristics of inspection, each inspection strategy will have a unique balance of appraisal, internal and external failure costs. Understanding the relationship between these components of cost of quality across different inspection strategies will allow manufacturers to identify the strategy that minimizes cost of quality, thereby reconciling the objectives of minimizing cost and maximizing the quality of conformance delivered to the customer.
* What is the value and impact of process change or improvement on inspection strategy selection?
Oftentimes, manufacturers have a range of manufacturing process technologies available to choose from. Alternatively if only one manufacturing process is available, process improvements options may exist. Such options decrease the process non-conformance rate at a given cost and may include increased maintenance, more frequent tool replacement or investment in additional equipment features. The suboptimal exercise of choosing an inspection strategy for a fixed choice of manufacturing process can now be expanded to include the flexibility of changing or improving the manufacturing process. When this flexibility exists, it becomes necessary to quantify its value as well as its effect on the choice of inspection strategy.
e Given that process quality of conformance and inspection errors are probabilistic in nature, is expected value a sufficient metric for manufacturing process and inspection strategy selection? If not, what metric should one use and how does it affect decision making?
The probabilistic characteristic of imperfect manufacturing processes and inspection implies that the cost of quality output of any cost model developed to aid in manufacturing process and inspection strategy selection will have the form of a distribution. Every combination of manufacturing process and inspection
strategy will have a unique range of possible cost outcomes which include occurrences of internal or external failure. Particularly in cases where these failure costs are high relative to inspection costs, the cost of quality distribution associated with any manufacturing process and inspection strategy combination will be highly asymmetric. High asymmetry implies that the risk-neutral expected cost approach prevalent in CoQ or inspection strategy optimization literature can be misleading as it does not fully reflect the risk exposure to such high cost events. A metric that more accurately captures a decision makers' risk aversion profile is the expected utility approach. It is necessary for decision makers to
understand when the expected cost approach is insufficient and how the consideration of risk aversion can change the selection of manufacturing process or inspection strategy.
4
Methodology
4.1
CoQ framework
As mentioned in section 2.1, this thesis reconciles the manufacturers' conflicting objectives of cost minimization and quality of conformance maximization into one objective of cost of quality minimization. This can be achieved by implementing the cost of quality approach of assigning costs to quality of conformance in accordance with Feigenbaum's prevention-appraisal-failure (P-A-F) cost categorization [7].
To compare inspection strategies for a fixed choice of manufacturing process, the P-A-F cost of quality elements that must be considered are appraisal, internal failure and external failure costs. These elements are directly affected by the choice of inspection strategy and can be used for inspection strategy comparison. More specifically, the metric we will be using for inspection strategy comparison when the manufacturing process is fixed includes the sum of all three cost of quality elements defined as the cost beyond perfect manufacturing (CBPM) where,
CBPM(nco)=Cappraisal (nco)+Cintemal failure (fco)+Cextemal failure (nco)
1
CBPM(nco) captures the costs incurred to produce nco delivered conforming units beyond their
manufacturing and material costs. These additional costs are incurred as a result of implementing imperfect inspection on the outputs of an imperfect manufacturing process. If the manufacturing process were perfect, CBPM=O as no inspection would be implemented and there would be no costs related to internal or external failure. In the generic expression in equation 18 appraisal costs are inspection costs, internal failure costs consist of both rework and scrap costs and external failure costs include costs associated with loss of goodwill and sales as well as warranty if the product is backed by a warranty agreement.
When manufacturing process change or implementing process improvement are options the manufacturer can pursue alongside inspection strategy selection, the manufacturing process cost of all delivered conforming items, previously excluded in the CBPM formulation, must also be considered in any comparison. As mentioned earlier, if the cost difference between manufacturing processes is used instead, the comparative result will be the same. Note that in the case where process improvement is pursued, the required investments can be spread over the manufacturing process costs of all produced items. The metric used in this thesis for simultaneously comparing manufacturing process and inspection strategy is the cost of imperfect manufacturing and inspection (CIMI) and is the sum of both CBPM and an additional term, the cost of perfect manufacturing (CPM). i.e.
CIMI(nco)=C PM (nco)+CBPM (nco)
2
where
CPM(nco)=c, -nco
3 and cpis the unit manufacturing process cost.
While the goal is to get at the CBPM of nco units, the most direct calculation can be done by holding the number of manufacturing process runs constant. For a given number of manufacturing process runs, different combinations of inspection strategies and manufacturing process will result in different proportions of scrapped items, conforming items sent to the customer and non-conforming items sent to the customer. Because the number of delivered conforming items, neo, will be different in each case, we need a normalization factor that can convert the CBPM and CIMI results to a cost per nco basis. Hence the normalization factor used in this thesis is the number of conforming units delivered to the customer,
nco. Inherent in this choice of normalization is the assumption that delivered non-conforming items are replaced with conforming counterparts. Equations 1 and 2 can be rewritten on a per delivered conforming unit basis as,
CBPM(nco)
cbpmco=
4 and, cimico=cp+cbpmco 5Equation 4 captures the cost consequences of imperfect inspection strategies when a manufacturing process is fixed while equation 5 allows for the comparison of different combinations of inspection strategy and manufacturing process. Note that because the difference between the two equations is merely a constant (cy) when the manufacturing process is fixed, cimico also serves as a metric for comparing inspection strategies when the manufacturing process choice is fixed.
Any attempt to analyze cimico must capture the scenario specific probabilistic implications of manufacturing process non-conformance rate and inspection errors. In reality, cimico is a random variable and a more detailed, probabilistic model will serve to explore the cimico tradeoffs and implications of different inspection strategies and manufacturing processes both from an expected cost and cost distribution perspective. This can be done analytically for relatively simple inspection strategies or via a discrete event simulation for more complicated strategies. This chapter will present the analytical
and simulation formulations of the cost model for a set of three different inspection strategies, a one stage manufacturing process and a single component product consisting of one manufactured part.
4.2
Analytical approach
An analytical approach for modeling cimico probabilistically is tractable for relatively simple inspection strategies. The mathematical formulations developed in this chapter for a chosen set of inspection strategies provide insight into both the expected cost and cost distribution tradeoffs and implications of different manufacturing process and inspection strategy options.
4.2.1 Inspection strategies
As mentioned in section 0, inspection strategy can refer to a multitude of variations explored in literature. Explored dimensions of inspection strategies include but are not confined to
e multi-characteristics inspection [12]
e optimal sequencing of inspection stations [37] * repetitive inspection [38]
* optimal inspection allocations including acceptance sampling [16]
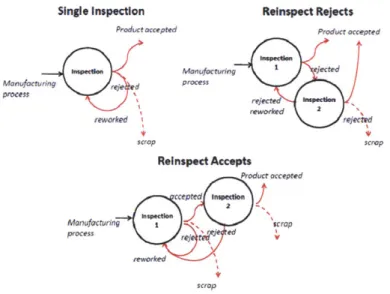
In this thesis the analytical examination of cimico tradeoffs in manufacturing process and inspection strategy selection is restricted to a set of three fundemental inspection strategies, variations of which can be found in Ding et al. [13]. Along with the obvious no inspection option, the three modeled inspection strategies serving as a platform for discussion are reinspect rejects, reinspect accepts and single
inspection (see Figure 5).
Single Inspection Reinspect Rejects
Product accepted Product accepted
hpection
inpectho Manufacturing jeI cted Manufacturing re d process processle hptIm rejected inspectio reworked 2 reworked rejected scrop scrop Reinspect Accepts Product accepted ccepted tnpeton Manufacturing scrap process te ee ed reworked scrop
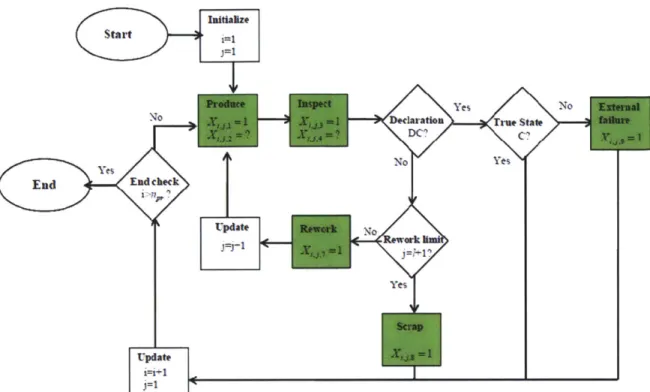
In the case of the single inspection, a post manufacturing process inspection step declares the produced item conforming or non-conforming subject to the respective inspection error rates. Here, an item declared conforming is delivered to the customer whereas an item declared non-conforming is rejected and reworked before being re-inspected. This process-inspection cycle is limited by the maximum allowable rework iterations. If the item is declared non-conforming after being reworked for the last allowable time, the item is scrapped. In the reinspect rejects strategy, the second inspection is implemented on the products declared non-conforming by the first inspection step. It takes two declarations of non-conformance before the item is rejected to be reworked or, alternatively, scrapped if the allowable rework limit is reached. In this strategy an item can be declared conforming and delivered to the customer at either inspection step. In contrast to the reinspect rejects strategy, the reinspect accepts strategy requires two consecutive declarations of conformance to accept and deliver an item to the customer. However, a non-conformance declaration by any of the two inspection steps can result in rejection to be reworked or scrapped.
The three inspection strategies explained above are interesting to explore because they demonstrate contrasting objectives. A reinspect accepts strategy seeks to minimize type II error and external failure whereas a reinspect rejects strategy emphasizes minimizing type I error and internal failure. As opposed to the two-tier inspection strategies, the single inspection strategy minimizes inspection costs.
4.2.2 Expected value approach
The cimico tradeoffs and implications specific to each inspection strategy mentioned in section 4.2.1 can be modeled from an expected value perspective by taking the expected values of equations 4-5. In equations 4-5, the number of conforming items delivered, nco, is related to the number of scrapped items,
ns, non-conforming items delivered, nnco, and manufacturing process runs, ny, through the relation,
npr =co + fnco + ns
6 More specifically, the three variables N = (nco, nnco, ns) are mutually exclusive discrete random variables that follow a multinomial joint probability mass function with parameters npr and p = (Pco, Pnco, Ps) where nyr is the fixed number of trials and p is the vector of event probabilities which sum
to 1.
Equation 1 illustrates that the cost beyond perfect manufacturing incurred in achieving ne0 delivered
conforming units consists of appraisal, internal failure and external failure costs specific to the choice of inspection strategy being modeled. More specifically,
I
CBPM(nco) = ns - cs + nnco cnco + ci + In, L- ' CR
j k=1
7 In equation 7, the cost beyond perfect manufacturing incurred in producing neo delivered conforming items consists of the total costs of scrap, external failure, inspection and rework. Here ns and nnco are the number of items being scrapped or delivered non-conforming. Meanwhile, nr11 is the number of items
being inspected by inspection method ij times and nRk is the number of items being reworked k times with 1 as the specified rework limit. Note that the limits on i andj are subject to the number of inspection methods available and the maximum possible inspection iterations of each. In equation 7, c1, is the unit
cost of inspection method i, cR is the unit rework cost while c, and Cnco are the unit costs of scrap and external failure respectively. In the model presented in this thesis we assign no salvage value. Hence the unit scrap cost is defined to be the sum of unit manufacturing process and material cost (equation 8). Unit external failure cost is the sum of the scrap value and any additional external failure premium which may include an allocation for loss of goodwill or sales (equation 9).
CS = C, + Cm
8
Cnco = (Cy + Cm) + Cf
9 In equation 7 ns, nnco, n1 1 and nRk are clearly dependent random variables; yet they can be treated
separately by considering their marginal probability distributions. In doing so these random variables behave as binomially distributed random variables ns~- B(npr, Ps), ls~- B(npr, Ps), nli1 1 ~- B (npr, Pi
and nRk B(npr, pk) resulting from a constant specified number of Bernoulli trials each (npr).
Furthermore, although the unit costs in equations 3 and 7 are modeled as constants, there may be situations where modeling them as random variables is necessary.
Substituting equations 7-9 into equation 4-5 allows us to express cimico as
CBPM(nco) (ns + nnco) - (C, + Cm) + nnco -c- + Z
L;
ni -c>, + =I nRk CRcimico = c, +=c,± n
nco c
10
Note that in equation 10, ne0 is also a binomially distributed discrete random variable, nco~ B(npr,
Pco)-Hence equation 10 is the generic expression for cimico where nSnnconco nI,nRk are all random variables. The expected value of cimico for any available inspection strategy and manufacturing process option is difficult to determine because the quantity is a quotient of dependent random variables.
However, two approximations will allow us to approximate the expectation of the quotient as the quotient of the expectations, i.e.
ECBPM(nco) E [CBPM(nco)]
nco E[nco]
11
The first simplifying approximation is that P(nco = 0) = 0. This approximation can be justified by considering the multinomial joint probability mass function' and the convergence of P(nco = 0) to zero in the limit for large number of trials nyr and when pco is close to unity. The second approximation is the second-order Taylor series approximation of CBPM(nco) around nco = E [nco]
rico
CBPM(nco) CBPM(nco) CBPM(nco) -(nco - E[nco]) CBPM(nco) - (nco - E[nco])2 +
nco E [nco] 2 E[nco]3
12
Giving us,
rCBPM(nco)
E[CBPM(nco)] Cov(nco, CBPM(nco)) E[CBPM(nco) -(nco - E[nco ])2]E nco CO) E [nco] E[nco]2 + E[nco]3
13 Notice that there is a truncation error in equation 13 due to truncation of the series approximation. As equation 13 indicates, the approximation in equation 11 is reasonable for large values of E [nco] relative
to Cov(CBPM(nco), nco). Again, this is true when ny, is large and pco is close to unity, two conditions
assumed for our analyses.
The approximation in equation 11 allows us to express equation 10 using the definition of expectations of binomially and multinomially distributed random variables, E[x1] = npr -pi. Equation 10 becomes,
E[cimi] = (P + p, ) - (P + CM) + P,,c, c + Z p 'c - + E yPRk CR
1-Pnco - Ps
14
Here the numerator is effectively the expected value of the cost of any produced item beyond perfect manufacturing, cbpm, and is normalized by the expected fraction of conforming and delivered items. Examining the interplay between the manufacturing process, scrap, external failure, inspection and rework cost components of cimico allows for the exploration of tradeoffs involved in manufacturing process and inspection strategy selection.
Equation 14 is a generalized formulation for the expected values of cimic, and can be applied to model any manufacturing process and inspection strategy combination. Yet the probabilities Pnco, Ps Pi1 1 and
PRkare specific to the inspection strategy being modeled and are functions of manufacturing process
non-conformance rate, inspection error rates and rework limit. The expressions for expected Pnco, Ps, PIrj, PRk and cbpmco specific to the inspection strategies outlined in section 4.2 are derived in detail in the remainder of this section. In arriving at these expressions, several simplifying assumptions are made:
* Rework non-conformance rate is equal to that of the original manufacturing process
* Rework non-conformance rate is independent of rework iteration performed on a given item * Non-conformance rate is independent of the overall number of process or rework runs * Inspection error rates are independent of previous inspection declarations
* All unit costs being modeled are constants and are independent of production volume
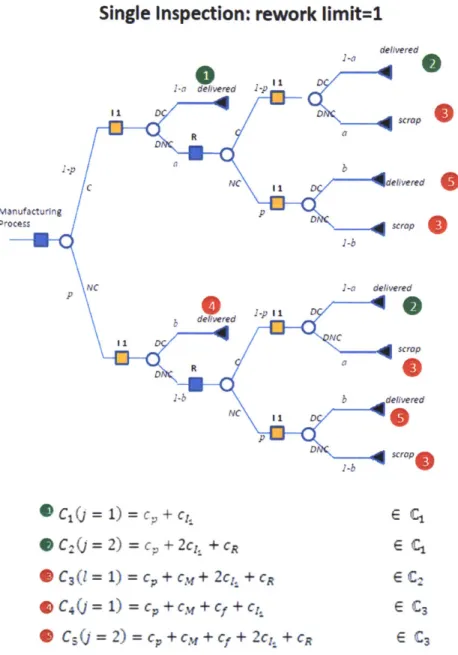
a) SINGLE INSPECTION
The single inspection derivation of E[cimico] for a given manufacturing process with unit process cost c, and process non-conformance rate p is described first. The parameters describing a single inspection
method are its unit inspection cost crand type I and type II inspection errors given by a, = P(DNCIC)-declared non-conforming given conforming- and b1 = P(DCINC)- declared conforming given
non-conforming- respectively. Figure 6 depicts the flow diagram representation of the single inspection strategy that can be used to arrive at E[cimico,singje] by considering all possible manufacturing process or rework quality of conformance outcomes and inspection declarations.
Single Inspection flow diagrat
I I spection I
c Mc
- - noforming product
resced namorke --..- Conforimng product below rebork itm
Figure 6: Flow diagram representation of a single inspection strategy indicating correct and erroneous inspection declarations. True quality of conformance states are indicated by conforming (C) or non-conforming (NC) whereas conditioned inspection quality of conformance declarations are indicated by declared conforming (DC) or declared
A manufactured item is produced with probability p of being of non-conforming quality. As Figure 6 illustrates, upon inspection and conditioned on its true quality of conformance state (C or NC), the item is either declared conforming (DC) or declared non-conforming (DNC). If declared conforming, it gets sent to the customer whereas if it is declared non-conforming, it gets reworked with a probability p of becoming of conforming quality. As mentioned above, the inspection error rates and rework non-conformance rate are modeled as independent of the number and outcomes of prior inspection and rework iterations. This allows us to derive an expression for the probability of being declared non-conforming (i.e. rejected) and sent to rework at any individual inspection iteration,
j.
If xj is an indicator variable indicating the occurrence of thejth inspection iteration, the probability of being rejected given xj =1 is an unconditional probability given the assumed independence between inspection and rework iterations. Hence,Prixj=1 = P(DNC n CIxj = 1) + P(DNC n NCIxj = 1)
= P(DNC n C) + P(DNC n NC)
= P(DNCIC) - P(C) + P(DNCINC) - P(NC)
= ai - (1 - p) + (1 - bi) -p
15 Note that by definition the probability of the jth inspection iteration occurring is defined as the probability
of the previous inspection iteration occurring and declaring the item non-conforming.i.e.
P(x; = 1) = Prnxj_,=1
= Prix,, -P(x;_1 = 1)
16 Using equation 15 and expanding on the recursive expression in equation 16 we get
i=1
P~jl= 1)
=71Prlxi=1
= [ai - (1 - p) + (1 - b1) - p]i-1
17 where by definition P(x1 = 1) = 1; i.e. all items undergo the first inspection iteration. This expression is
equivalent to the probability of at leastj inspection iterations occurring and at least the (j-1)th rework occurring. Hence for the single inspection strategy,
p = [ai (1 - p) + (1 - bi) p]j-l
18
PRk p)+(1-bi) p]kk[a(
If / is the maximum allowable number of reworks an item can undergo, the probability of scrapping an item is equal to the probability of being at the 1+1 inspection iteration and declaring an item non-conforming.
Ps = Prnxi,1=1
= Prixl+,=1 P(xl+1 = 1)
20
Equation 17 allows this to be rewritten as
Ps = Prlxl+1=i
1
Prxi== [a- (1-p) + (1 - bi) - p]1
21
While declaring a conforming or non-conforming item non-conforming leads to rework and potentially scrapping, declaring a non-conforming item conforming leads to non-conforming items being sent to the customers and resulting in external failure events. Again assuming independence between inspection and rework iterations and using Bayes theorem, the probability of falsely accepting a non-conforming item at any one inspection iteration is equal to
Pfalx;=1 = P(DC n NCx; = 1)
= P(DCINC) - P(NC)
b- p
22
Because type II error can occur at any inspection iteration the probability of external failure is equal to the sum of the probabilities of being non-conforming and declared conforming at all possible inspection iterations j=1....l+1 1+1 Pnco
=
P(DC n NC n x = 1) j=1 1+1 = P(DC n NClx; = 1) -P(x= 1) j=1 23 Substituting equations 17 and 22 into expression 23 we getl+1
Pnco = b1 - p - [ai - (1 - p) + (1 - bi) p]i-1
j=1
24
For the single inspection strategy substituting equations 18, 19, 21 and 24 into the generic formulation of
E[cimico,singie) = cP +
~~
~_
in-Z -+±-'
(Cp + CM) + a *Cf+
C j + L CR 25 wherec(bi,
p)
=b
1-p
f#(ai,bi,p) = a -(1-p) + (1 -b) -pHere a is the unconditional probability of being declared conforming and being of non-conforming quality at any inspection iteration. Meanwhile fl is the unconditional probability of being declared non-conforming at any inspection iteration.
The expression for E [cimico,RR] , E [cimico,RA] as well as E
[cimico,no
inspect] can be derived in a manneranalogous to that used to derive
E[cimico,singlel-b) REINSPECT REJECTS
Rdnspect Rejects flow diagram
accepted Ieni t* be prodied I ot 0 Manu~~ctinL. M011, let 1.03 1
"12
J
-1
I Key - - Good decioion --- Erroneous deciion - -- irnntorriinr frNllrt - Conformnig productFigure 7: Flow diagram representation of a two-tier reinspect rejects strategy indicating correct and erroneous inspection declarations. As in Figure 6, true quality of conformance states are indicated by conforming (C) or
non-conforming (NC) whereas conditioned inspection quality of conformance declarations are indicated by declared conforming (DC) or declared non-conforming (DNC)
26
27
1.6,
II
The parameters describing the two-tier reinspect rejects strategy are the two unit inspection method costs
c1 and c1 2 as well as type I and type II inspection errors of the two inspection methods given by a1and b1
and a2 and b2 respectively. Figure 7 depicts the flow diagram representation of the reinspect rejects
strategy that can be used to arrive at E[cimico,RR]- Just as in the single inspection strategy, a manufactured item is produced with probability p of being of non-conforming quality. The first inspection method declares the item conforming (DC1) or non-conforming (DNC1). If the item is declared
conforming it is accepted and sent to the customer whereas if it is declared non-conforming it is rejected and re-inspected by the second inspection method. In the latter case, the second inspection method declares this item conforming (DC2) or non-conforming (DNC2) conditioned on its quality of
conformance and independent of the first inspection methods' declaration. If declared conforming the item is delivered to the customer, whereas if it is declared non-conforming it is rejected and reworked if within the rework limit, scrapped otherwise. The same independence assumptions between different rework and inspection iterations are made as for the single inspection strategy.
If x is the indicator variable indicating the occurrence of the jth two-tier inspection iteration, the probability of being declared non-conforming twice and sent to rework can be expressed as
Prix;=i = P(DNC2 n DNC1 n CIxj = 1) + P(DNC2 n DNC1 n NCx; = 1) = P(DNC2I(DNC1 n C)) P(DNC1 n C) + P(DNC2I(DNC1 n NC)) - P(DNC1 n NC) = P(DNC2) P(DNC1|C) P(C) + P(DNC2) - P(DNC1|NC) - P(NC) = P(DNC2) P(DNC1) - P(C) + P(DNC2) -P(DNC1) -P(NC) = a2 -a1 - (1 - p) + (1 - b2)- (1 - b) -p 28 Hence, analogous to equations 17, the probability of the jth inspection iteration occurring is
j-1
P(xyl = 1) = Prix=1
= [a2 - ai - (1 - p) + (1 - b2) - (1 - bi) - p]''l
29 where by definition P(x1 = 1) = 1; i.e. all items undergo the first inspection iteration. And the
probability of scrap is the probability of being at the l+1th inspection iteration and declaring an item non-conforming Ps = Prnxi+1=1 = Prixi+i=i P(XI+1 = 1) = Prlxl+1=1 Prxi=l i=1 = [a2 - ai - (1 - p) + (1 - b2). (1 - bi) - p]1+1 30 Equation 29 is equivalent to the probability of at least (j- 1) rework iterations occurring,
PRk =
[a
2-a(1-p)
+
(1
-b2)(1
b
1)
p]k
31
as well the probability of at leastj inspection iterations occurring. Because the first inspection method is implemented on an item at the beginning of any inspection iteration, the probability of an item incurring at least
j
iterations of the first inspection method ispre = [a2 -a (- p) + (1 - b2 ) -(1 - bi) - p]j-1
32
The probability of at least
j
iterations of the second inspection method occurring is equal to the probability of the item being declared non-conforming by the first inspection method and at leastj
inspection iterations occurring
PI2 1 = P(DNC1 n NC n x; = 1) + P(DNC1 n C n x; = 1) =
[P(DNC
1 n NCx; = 1) + P(DNC1 n Clx; = 1)] - P(x; = 1) = [P(DNC1 n NC) + P(DNC1 n C)] P(x; = 1) = [P(DNC1INC) -P(NC) + P(DNC1 |C) - P(C)] - P(x = 1) i-1 = [(1 - bi) p + ai(1-
p)] - pr j=1 i=1 =[(1
-bi)
p + ai(1
- p)][a
2 - ai - (1 - p) + (1 - b2) -(1 - b1) - p]j-l 33Whereas in the reinspect rejects it takes two consecutive non-conformance declarations to reject an item at any inspection iteration
j,
the type II error can occur at one of the two consecutive inspection methods. Hence the probability of external failure is equal to the sum of the probabilities of being non-conforming and declared conforming over all inspection methods and inspection iterations j=1 .... 1+1.1+1 1+1 Pnco = P(DC1 n NC n x; = 1) + I P(DC2 n DNC1 n NC n xj = 1) j=1 j=1 1+1 =
~
P(xj = 1)[P(DC
1 n NCx; = 1) + P(DC2 n DNC1 n NCIx; = 1)] 1+1= P(x; = 1) P(NC) - [P(DC1INC) + P(DC2IDNC1 n NC) -P(DNC1INC)]
j=1 1+1
= P(x = 1) p - [bi + b2 - (1 - bi)]
1+1
a2 - (1 - p) + (1 - b2)'- (1 - bi) -pi-1 - p - [bi + b2 - (1 - bi)] j=1
For the reinspect rejects strategy substituting equations 30-34 into the generic formulation of E[cimico] given in equation 14 one gets
(~cm + + a p - ;i1-'). -(c, + cm) + a -%+1 -c-T,+-1 1 +rj2 1 -f1' -crj + #k ' CR E[ciMic,a] - c, + 1 a E;i =- -1 - pr+1 35 where, a(p,b1,b2) = p [b1 + b2 - (1- b1)] 36
f#(ai, bi, a2, b2, p) = a2 - ai (1 - p) + (1 -b 2) -(1 -bi) p
37
y(p, a,, bl) = (1- bi) -p +ai (1 -p)
38 Here again a is the unconditional probability of being declared conforming and being of non-conforming quality from either inspection method at any inspection iteration. Meanwhile
fl
is the unconditional probability of being declared non-conforming by both inspection methods at any inspection iteration. y is the unconditional probability of being rejected by the first inspection method and thereby sent to thesecond at any inspection iteration.
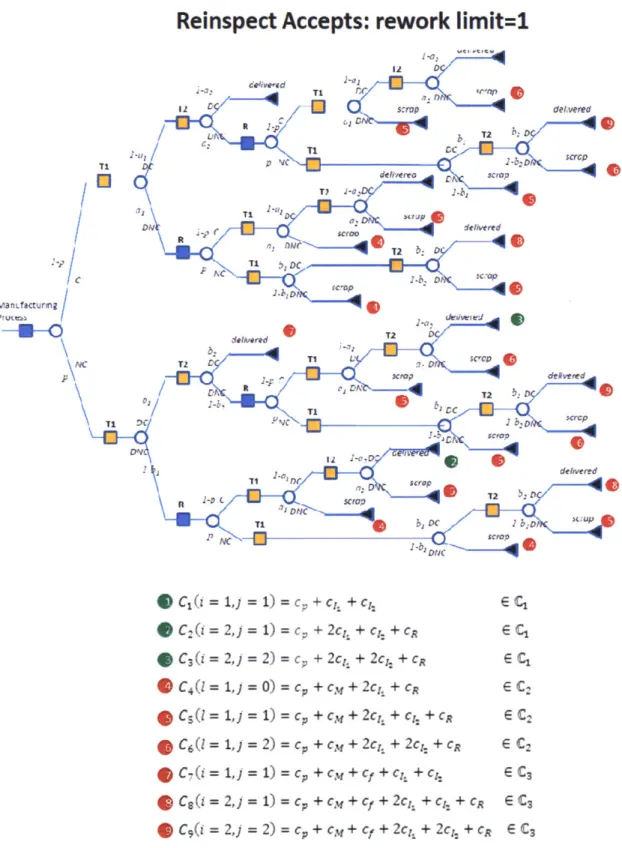
c) REINSPECTACCEPTS
Reinspect Accepts flow diagram
Key Dehvered to
--- Good decision
- Erroneomu decision
Item to be - - - Non-confoming product
produced -nComg produceto
C NC
accepted X M
Figure 8: Flow diagram representation of a two-tier reinspect accepts strategy indicating correct and erroneous inspection declarations. As in Figure 2, true quality of conformance states are indicated by conforming (C) or
non-conforming (NC) whereas conditioned inspection quality of conformance declarations are indicated by declared conforming (DC) or declared non-conforming (DNC)

![Figure 18: Inspection Strategy Decision Space indicating E[cimico] minimizing inspection strategies for scenarios A- A-D as a function of product material cost and additional external failure cost](https://thumb-eu.123doks.com/thumbv2/123doknet/14503522.528291/52.918.146.757.523.984/inspection-strategy-decision-indicating-minimizing-inspection-strategies-additional.webp)
![Figure 19: Inspection Strategy Decision Space indicating E[cimico] minimizing inspection strategies for scenarios A- A-D as a function of unit manufacturing process- and inspection costs](https://thumb-eu.123doks.com/thumbv2/123doknet/14503522.528291/54.918.110.842.346.845/inspection-strategy-indicating-minimizing-inspection-strategies-manufacturing-inspection.webp)
![Figure 20: inspection strategy E[cimi, 0 ] as a function of manufacturing non-conformance rate p for scenarios A-D Several trends can be observed from analyzing inspection strategy sensitivity to non-conformance rate.](https://thumb-eu.123doks.com/thumbv2/123doknet/14503522.528291/56.918.111.784.361.847/inspection-manufacturing-conformance-scenarios-analyzing-inspection-sensitivity-conformance.webp)
![Figure 21: Inspection Strategy Decision Space indicating E [cimic] minimizing inspection strategies for scenarios A- A-D as a function of inspection method type I and type II error rates.](https://thumb-eu.123doks.com/thumbv2/123doknet/14503522.528291/58.918.168.719.392.857/inspection-strategy-decision-indicating-minimizing-inspection-strategies-inspection.webp)
