HAL Id: hal-02882085
https://hal.archives-ouvertes.fr/hal-02882085
Submitted on 26 Jun 2020HAL is a multi-disciplinary open access archive for the deposit and dissemination of sci-entific research documents, whether they are pub-lished or not. The documents may come from teaching and research institutions in France or abroad, or from public or private research centers.
L’archive ouverte pluridisciplinaire HAL, est destinée au dépôt et à la diffusion de documents scientifiques de niveau recherche, publiés ou non, émanant des établissements d’enseignement et de recherche français ou étrangers, des laboratoires publics ou privés.
Mass-resolved electronic circular dichroism ion
spectroscopy
Steven Daly, Frederic Rosu, Valérie Gabelica
To cite this version:
Steven Daly, Frederic Rosu, Valérie Gabelica. Mass-resolved electronic circular dichroism ion spec-troscopy. Science, American Association for the Advancement of Science, 2020, 368 (6498), pp.1465-1468. �10.1126/science.abb1822�. �hal-02882085�
This is the author post-print of an article published in final form in Science (2020), 368, 1465-1468 (DOI: 10.1126/science.abb1822)
1
Mass-Resolved Electronic Circular Dichroism Ion Spectroscopy
Steven Daly,1 Frédéric Rosu,2 Valérie Gabelica1*
1Université de Bordeaux, Inserm & CNRS, Laboratoire Acides Nucléiques: Régulations
Naturelle et Artificielle (ARNA, U1212, UMR5320), IECB, 2 rue Robert Escarpit, 33607 Pessac, France.
2 Université de Bordeaux, CNRS & Inserm, Institut Européen de Chimie et Biologie (IECB,
UMS3033, US001), 2 rue Robert Escarpit, 33607 Pessac, France. *Correspondence to: [email protected].
Abstract: DNA and proteins are chiral: their three-dimensional structure cannot be
superimposed with its mirror image. Circular dichroism spectroscopy is widely used to characterize chiral compounds, but data interpretation is difficult in the case of mixtures. We recorded the electronic circular dichroism spectra of DNA helices separated in a mass
spectrometer. We studied guanine-rich strands having various secondary structures,
electrosprayed them as negative ions, irradiated them with a UV-vis nanosecond OPO laser, and measured the difference in electron photodetachment efficiency between left and right circularly polarized light. The reconstructed circular dichroism ion spectra resemble their solution
counterparts, thereby allowing us to assign the DNA helical topology. The ability to measure circular dichroism directly on biomolecular ions expands the capabilities of mass spectrometry for structural analysis.
One Sentence Summary: We introduce a new dimension of ion spectroscopy to probe the
chirality of biomolecules separated in a mass spectrometer.
Two centuries ago, the interaction of polarized light with crystals revealed that many molecules come in two forms, non-superimposable with their mirror image (1). The activity and toxicity of natural or synthetic molecules often depend on their chirality (2). Identifying which mirror image is present in a sample is thus crucial. Furthermore, because biomolecules such as DNA or
proteins consist of repetitive chiral subunits, they can form helical structures, as in the iconic DNA double helix (3, 4). Characterizing the types of helical structures formed by biomolecules is therefore also essential for structural biology.
Mass spectrometry (MS) is a widely used analytical method, with expanding impact in structural biology (5, 6). MS excels at separating and quantifying complex mixtures, and additional
structural characterization can be obtained using tandem mass spectrometry (7), ion mobility spectrometry (8) or infrared ion spectroscopy (9-11). However, mass spectrometry-based measurements are typically blind to chirality. Characterizing chiral compounds by mass
spectrometry currently requires a physical interaction with other chiral molecules (12), either by separation on chiral phases in front of the mass spectrometer or by forming complexes with chiral auxiliaries in the gas phase (13).
2
Another way to characterize chiral biomolecules is through interaction with chiral light. In solution, DNA and proteins are conveniently characterized by circular dichroism (CD), which measures the difference of absorption between left- and right-circularly polarized light. Electronic CD is particularly useful to characterize the different types of helices formed by nucleic acids (14) or the secondary structures formed by proteins (15). The structural
interpretation relies on spectral databases of known structures. However, the interpretation of CD spectra becomes difficult for samples wherein multiple species or structures coexist, because the resulting spectrum is the weighted average of all contributions.
Here we report how to record electronic circular dichroism spectra on DNA helices separated in a mass spectrometer. Although CD and MS were combined before (16-18), the previous methods were based on resonant multiphoton ionization (REMPI), and were thus applicable only to volatile neutral small molecules (< 200 Da). Here we used electrospray to produce gas phase polyanions of intact DNA multi-helices (> 5000 Da), and interrogated them with circularly polarized UV light directly inside the mass spectrometer.
Our mass analyzer is a quadrupole ion trap (Paul trap) with two opposite holes (1.7 mm diameter) in the ring electrode. We reasoned that this configuration would minimize risks of reflection of the laser beam inside the mass spectrometer, which could possibly alter the circular polarization. The electrospray source was operated in the negative mode to produce multiply charged anions. We used gentle ion transfer conditions to prevent gas-phase restructuring and thus maximize the chances of preserving the solution secondary structures.
We analyzed several DNA G-quadruplex tetra-helical structures (parallel right-handed tetramer TG4T [(dTGGGGT)4(NH4+)3], parallel left-handed intramolecular ZG4
[dT(GGT)4TG(TGG)3TGTT(NH4+)3] (19), right-handed antiparallel intramolecular 5YEY
[d(GGGTTA)2GGGTTTGGG(K+)2] (20)) and the silver-mediated parallel G-duplex GAgG
([(dG11)2(Ag+)11] (21)). These structures were chosen because they have remarkably different
electronic CD spectra in solution in the range 220-300 nm (Fig. S1). Also, these structures are stabilized by spines of central cations, which maximizes the likelihood to preserve the hydrogen-bonding and stacking arrangement in the gas phase while minimizing rearrangements due to self-solvation (21). The preservation of the known solution shapes was confirmed by the good agreement between helium momentum transfer collision integrals measured in ion mobility spectrometry and those calculated for gas-phase structures obtained by molecular dynamics at the semi-empirical level (Fig. S2). For TG4T, infrared ion spectroscopy also supported the preservation of G-quartets (22). We can thus safely assume that these molecular systems have the same base stacking arrangement in the gas phase as in solution.
When coupled to mass spectrometry, ion spectroscopy is an action spectroscopy (and not an absorption spectroscopy): one records the effect of the laser irradiation on the ions. Another reason for selecting DNA as the first test case is that, when irradiating DNA polyanions between 220-300 nm, the resulting action is electron photodetachment (ePD) (23, 24). This action has two advantages compared to fragmentation: (i) there are few product ions to quantify, which in terms of statistics will increase the chances to detect significant differences in product ion yields between the two polarizations, and (ii) ePD is monophotonic (25), and thus the normalization for fluctuations of the laser power is simply linear for all wavelengths. We verified this linear relationship, and for all spectroscopy experiments we selected the pulse energy ranges in which only linear electron photodetachment was observed (Fig. S3).
3
Nanosecond laser pulses were generated using wavelength-tunable OPO laser (nanosecond pulses, ≤ 100 µJ transmitted to the trap). To generate circularly polarized laser pulses, the beam passes through an air-spaced Rochon prism, which gives pure linearly polarized light. Next, the laser passes through an achromatic broadband quarter wave plate (Fig. 1, more details in
supplementary materials and methods and Figs. S4‒S6). The angle of the fast axis of the quarter wave plate relative to the polarization direction set by the Rochon prism determines the final polarization state of the laser pulse. The laser enters in the ion trap through a fused silica window in the vacuum manifold. The percentage of circular polarization was greater than 95% (Fig. S7, Table S1). The ions are randomly oriented inside the Paul trap.
Fig. 1. Experimental setup for generating circularly polarized laser pulses (full details in
supplementary material), and typical mass spectrum following isolation of D
-[(dTGGGGT)4.(NH4+)3]5- ions and irradiation with left circularly polarized (LCP) light at 260
nm.
To measure their circular dichroism, ions of a given mass-to-charge ratio are isolated, irradiated by a single laser pulse of the selected wavelength, polarization and pulse energy, then mass analyzed (Fig. 1). Mass spectra and pulse energy are averaged for 90 seconds. The polarization state of the laser pulse is then changed by rotating the quarter wave plate, and the mass spectrum and pulse energy acquired for another 90 seconds. This process is repeated 10 times for each polarization. The relative electron detachment yield for each mass spectrum is calculated as follows:
4
IePD is the integrated intensity of the peak due to electron detachment, Itotal is the total integrated
intensity (precursor + ePD product), λ is the wavelength, and Etrans is the transmitted pulse
energy determined from the reflected pulse energy by calibration (Fig. S8). We then calculate the average value of the relative electron detachment yield for left- and right-handed circular
polarizations. The circular dichroism monitored by electron photodetachment is expressed as an asymmetry factor, approximated by:
𝑔 2 ∗ (2)
The gas-phase CD spectra are reconstructed by plotting the asymmetry factor 𝑔 as a function of the wavelength. To facilitate the visual comparison, the solution CD spectra are plotted as ∆𝐴/𝐴̅, A being the absorbance, hence their shape differs from the ones traditionally displayed in molar circular dichroism.
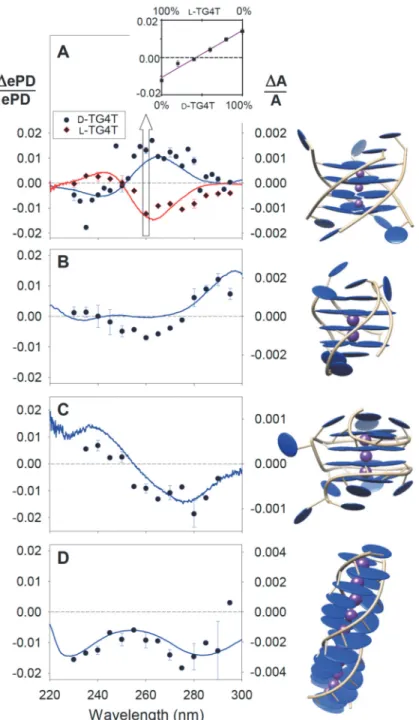
To unambiguously prove that the gas-phase CD effect comes from the sample and not from an instrumental artifact, we performed the experiment on D-[(TGGGGT)4(NH4+)3] formed from the
natural DNA backbone (all D-sugars), and from its enantiomer (all L-sugars). The gas-phase CD
signals have opposite signs (Fig. 2A). The magnitude is not exactly reversed, however. At 260 nm, we recorded a series of CD measurements by varying the relative concentration of the two enantiomers (D:L) in solution from only D to only L (Fig. 2A, inset). We obtained a straight line
(r²=0.975), showing that the differences in ePD with left- and right-circularly polarized light are reporting on circular dichroism and suggesting that the technique could be suitable for
quantification. The line did not pass exactly through 0 when the proportions were 50:50,
indicating the presence of residual instrumental artifacts, likely due the fact that the polarization is only ~95% circular. In the future, using an achiral internal standard could further reduce the uncertainty. Furthermore, if such imperfections vary with the wavelength, it would induce some distortion in the CD spectra that might hamper structural assignment. We thus compared the solution and phase CD spectra for other typical DNA helices (Fig. 2B—D; symbols for gas-phase CD, lines for solution CD). The solution and gas gas-phase CD spectral shapes are similar in terms of sign and position of the maxima and minima. This suggests that the following
conditions are met: (i) The base stacking pattern existing in solution is preserved in the gas-phase ions. (ii) The gas-phase action reflects the absorption, in terms of sensitivity to the circular polarization. In other words, the electronic excited states that are responsible for the CD effect also trigger electron photodetachment. (iii) Possible distortions due to imperfections in the
polarization do not preclude assigning the base stacking arrangement based on the spectral shape. As a result, the gas-phase CD spectra can unambiguously discriminate between the different guanine-rich oligonucleotide structures.
5
Fig. 2. Gas-phase circular dichroism spectra (ePD/ePD, symbols) compared to solution phase spectra (A/A lines). (A) TG4T: natural right-handed D-[(TGGGGT)4•(NH4+)3]5- (blue) and its
mirror image L-[(TGGGGT)4•(NH4+)3]5- (red). Inset: Gas phase circular dichroism measured at
260 nm for [(TGGGGT)4•(NH4+)3]5- ions prepared from 5 µM solutions with varying ratios of D
-TG4T and L-TG4T. Error bars show the 95% confidence interval, calculated from the standard
error (3 replicas, except at 260 nm with 5 replicas). (B—D) gas-phase and solution phase CD spectra for the antiparallel G-quadruplex 5YEY5- (B), the left-handed G-quadruplex ZG46- (C)
and the G-duplex GAgG5- (D). The illustrations showing helicity were generated using Chimera
from protein data bank coordinates (entries 2O4F, 5YEY, 6GZ6, and 4JRD, respectively), and the gas-phase structures are shown in Fig. S2.
6
The gas and solution phase asymmetry factors mainly differ by their magnitude, which is consistently larger in the gas phase (up to 2%) than in solution (<0.4%). This has been observed previously for small neutral molecules measured by REMPI (17, 26-28), where magnitudes of up to 25% have been observed (28). High CD signals are also observed in photoelectron circular dichroism (PECD) (29, 30), but in that case the measured property is the angular distribution of the photoelectrons. Here, we measure the electron detachment yield, and ePD results from a resonant excitation above the detachment threshold (24, 25). Given that solution-phase spectra result from the CD in absorption, we conclude that the gas-phase CD effect in photodetachment yields is also due to the resonant absorption of circularly polarized light by a chiral molecule. It is thus puzzling that the CD spectral shapes are similar although the magnitudes differ.
Here we consider possible explanations. In small molecules, the solvent can affect the magnitude of circular dichroism (31), and thus changes in the dielectric environment from water to vacuum may change the magnitude of the CD spectrum. To test this hypothesis, we recorded solution CD spectra of D-TG4T in mixtures of water up to 50% isopropanol (dielectric constant varying from
80.4 to 44.3). The mass spectra show that the G-quadruplex is intact, and no larger multimers are present (Fig. S9). No significant change in the value of ∆𝐴/𝐴̅ was observed (Fig. S10),
suggesting the dielectric environment plays only a small role. We also recorded the gas-phase CD for the 5-, 6- and 7- ions of D-TG4T, reasoning that if intramolecular electric dipoles
influence the electron ejection dynamics, the effect would increase with the charge state. We observe no significant change in either magnitude or shape of the CD spectrum as a function of the charge state (Fig. S11). We thus hypothesize that the origin of the larger gas-phase
magnitude comes from the different definition of asymmetry factors. In the gas phase, absorption is revealed by electron detachment. If not all states that absorb result in electron detachment (25,
32) while most states that are responsible for CD do, the denominator of the asymmetry factor is
smaller in gas phase CD action spectroscopy, and thus the asymmetry factor is larger. The electronic states responsible for the CD effect being most likely to be delocalized on the entire DNA helices, this may result in more efficient auto-detachment after resonant excitation. Thus, although future work is needed to elucidate the origins and dynamics of electron
photodetachment from DNA polyanions, for example by measuring the photoelectron circular dichroism, the electron photodetachment action serendipitously revealed itself especially well-suited to probe DNA higher-order structures by ion spectroscopy.
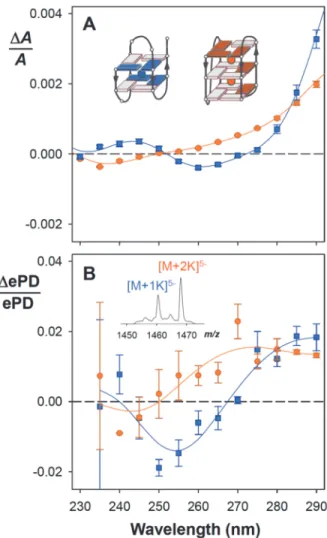
All experiments above were carried out on pure samples, and tandem mass spectrometry was used to select a charge state. Below we show an application leveraging mass separation to obtain the CD spectra of individual components from a mixture. Human telomeric sequences, consisting of TTAGGG repeats, can form several G-quadruplex topologies (33). At sub-millimolar
potassium concentrations, complexes with 1 K+ (2 G-quartets) and 2 K+ (3 G-quartets) coexist
(34). The 2-K+ complex is fully formed at high KCl concentrations, but 1-K+ complexes cannot
be isolated in solution. We previously reconstructed solution CD data for individual K+ binding
stoichiometries (Fig. 3A) by deconvoluting the solution CD signal of a K+ concentration series,
having determined the amount of each complex in separate mass spectrometry measurements. Here we applied mass-resolved CD ion spectroscopy directly on the mixture. Because the [M+1K]5- and [M+2K]5- complexes are close in m/z, they could be co-isolated (inset of Fig. 3B),
and as their m/z differs, the ePD efficiencies of both species could be monitored in a single experiment (this is also how we envisage using internal standards in the future). Each spectrum was averaged over 180 s. Although the magnitudes of gas-phase CD signals (Fig. 3B) differ from their solution counterparts, their position and sign allow to infer the G-quadruplex stacking
7
topology using the same rules as in solution (35): the 2-K+ complex has positive CD signals at
290 and 260 nm and a negative signal at 240 nm (signature of coexisting homo- and hetero-stacking), whereas the 1-K+ complex has positive signals at 290 and 240 nm and a negative
signal at 260 nm (signature of heterostacking).
Fig. 3. Application of mass-resolved circular dichroism to a mixture of conformations adopted
by the human telomeric DNA sequence dTAGGG(TTAGGG)3. (A) Deconvoluted solution CD
spectra for the three-quartet (2 K+, orange circles) and two-quartet (1 K+, blue squares)
complexes coexisting at KCl concentrations between 0 and 1 mM (34). The error bars are the standard uncertainties propagated from the original data; the lines were obtained by Savitzky-Golay smoothing. The insets show the stacking topologies deduced from the K+ stoichiometry
and the CD spectral shapes (light grey/dark color: anti/syn glycosidic bond angles, respectively). (B) Gas-phase CD spectra for the complexes [M+1K]5- (orange circles) and [M+2K]5- (blue
squares) co-isolated from a solution containing 400 µM KCl. The error bars are the standard uncertainties from the replicates (listed in supplementary Table S2); the lines were obtained by Savitzky-Golay smoothing. The inset shows the two co-isolated parent ions.
8
In conclusion, we demonstrated that it is possible to measure the circular dichroism of large DNA polyanions in the gas phase while exploiting the physical separation of components inside the mass spectrometer. The similarity between solution and gas-phase spectra allowed us to distinguish the secondary structures of G-rich DNA, thereby extending the scope and capabilities of structural mass spectrometry. In the future, proteins and their aggregates can be studied by the same approach, but overcoming signal-to-noise challenges will likely require using internal standards and alternative circularly polarized light sources giving access to shorter wavelengths. For positive ions and small molecules in general, cold mass tagging could provide alternative monophotonic action channels that may be less dependent on the nature of the excited state. Our demonstration of feasibility thus opens new avenues to study diverse classes of chiral molecules while leveraging the separation capabilities of contemporary mass spectrometry.
References and Notes:
1. F. Arago, Mém. Class Sci. Math. Phys. Inst. Impérial France 1, 93-164 (1811). 2. S. W. Smith, Toxicol. Sci. 110, 4-30 (2009).
3. J. D. Watson, F. H. C. Crick, Nature 171, 737-738 (1953). 4. R. E. Franklin, R. G. Gosling, Nature 171, 740-741 (1953).
5. I. Liko, T. M. Allison, J. T. Hopper, C. V. Robinson, Curr. Opin. Struct. Biol. 40, 136-144 (2016).
6. P. Lossl, M. van de Waterbeemd, A. J. Heck, EMBO J. 35, 2634-2657 (2016). 7. F. W. McLafferty, Science 214, 280-287 (1981).
8. D. E. Clemmer, M. F. Jarrold, J. Mass Spectrom. 32, 577-592 (1997). 9. E. Garand et al., Science 335, 694-698 (2012).
10. J. Seo et al., Nat. Chem. 9, 39-44 (2017).
11. M. Z. Kamrath, T. R. Rizzo, Acc. Chem. Res. 51, 1487-1495 (2018). 12. H. Awad, A. El-Aneed, Mass Spectrom. Rev. 32, 466-483 (2013).
13. W. A. Tao, F. C. Gozzo, R. G. Cooks, Anal. Chem. 73, 1692-1698 (2001).
14. J. Kypr, I. Kejnovska, D. Renciuk, M. Vorlickova, Nucleic Acids Res. 37, 1713-1725 (2009).
15. A. J. Miles, B. A. Wallace, Chem. Soc. Rev. 35, 39-51 (2006).
16. R. Li, R. Sullivan, W. Al-Basheer, R. M. Pagni, R. N. Compton, J. Chem. Phys. 125, 144304 (2006).
17. U. Boesl von Grafenstein, A. Bornschlegl, ChemPhysChem 7, 2085-2087 (2006). 18. A. Hong et al., Angew. Chem. Int. Ed. 53, 7805-7808 (2014).
19. W. J. Chung et al., Proc. Natl. Acad. Sci. USA 112, 2729-2733 (2015). 20. C. Liu et al., Chem. Sci. 10, 218-226 (2018).
21. S. M. Swasey, F. Rosu, S. M. Copp, V. Gabelica, E. G. Gwinn, J. Phys. Chem. Lett. 9, 6605-6610 (2018).
22. V. Gabelica et al., J. Am. Chem. Soc. 130, 1810-1811 (2008). 23. V. Gabelica et al., Anal. Chem. 78, 6564-6572 (2006).
24. F. Rosu et al., J. Phys. Chem. A 116, 5383-5391 (2012).
25. S. Daly, M. Porrini, F. Rosu, V. Gabelica, Faraday Discuss. 217, 361-382 (2019). 26. P. Horsch, G. Urbasch, K. M. Weitzel, D. Kroner, Phys. Chem. Chem. Phys. 13,
2378-2386 (2011).
9
28. J. Lepelmeier, K. Titze, A. Kartouzian, U. Boesl, U. Heiz, ChemPhysChem 17, 4052-4058 (2016).
29. L. Nahon, G. A. Garcia, C. J. Harding, E. Mikajlo, I. Powis, J. Chem. Phys. 125, 114309 (2006).
30. M. H. Janssen, I. Powis, Phys. Chem. Chem. Phys. 16, 856-871 (2014).
31. A. R. de Souza, V. F. Ximenes, N. H. Morgon, in Stereochemistry and Global
Connectivity: The Legacy of Ernest L. Eliel Volume 2. (2017), pp. 91-101.
32. V. Gabelica et al., J. Am. Chem. Soc. 129, 4706-4713 (2007). 33. A. T. Phan, FEBS J. 277, 1107-1117 (2010).
34. A. Marchand, V. Gabelica, Nucleic Acids Res. 44, 10999-11012 (2016). 35. A. I. Karsisiotis et al., Angew. Chem. Int. Ed. 50, 10645-10648 (2011).
36. S. Daly, F. Rosu, V. Gabelica, Zenodo, DOI: 10.5281/zenodo.3758200 (2020).
37. B. Schaefer, E. Collett, R. Smyth, D. Barrett, B. Fraher, Am. J. Phys. 75, 163-168 (2007). 38. V. Gabelica, S. Livet, F. Rosu, J. Am. Soc. Mass Spectrom. 29, 2189-2198 (2018).
39. J. J. Stewart, J. Mol. Model. 19, 1-32 (2013).
40. M. J. Frisch et al., Gaussian 16 Rev. B.01. (Wallingford, CT, 2016).
41. M. F. Mesleh, J. M. Hunter, A. A. Shvartsburg, G. C. Schatz, M. F. Jarrold, J. Phys.
Chem. 100, 16082-16086 (1996).
Acknowledgments: We thank Nina Khristenko for contributing to preliminary experiments. Funding: European Research Council, ERC-2013-CoG-616551-DNAFOLDIMS; Author contributions: FR and VG conceived the project; VG acquired the funding; FR and SD
developed the methodology; SD and FR conducted the research and analyzed the data; SD and VG wrote the paper. Competing interests: Authors declare no competing interests. Data and
materials availability: All materials are commercially available. All raw and processed data are
provided (36).
Supplementary Materials:
Materials and Methods Figures S1-S11
Table S1