HAL Id: ird-00278334
https://hal.ird.fr/ird-00278334
Submitted on 12 May 2008
HAL is a multi-disciplinary open access
archive for the deposit and dissemination of sci-entific research documents, whether they are pub-lished or not. The documents may come from
L’archive ouverte pluridisciplinaire HAL, est destinée au dépôt et à la diffusion de documents scientifiques de niveau recherche, publiés ou non, émanant des établissements d’enseignement et de
G. de Noni, D. Blavet, J.Y. Laurent, Yves Le Bissonnais, Jean Asseline
To cite this version:
G. de Noni, D. Blavet, J.Y. Laurent, Yves Le Bissonnais, Jean Asseline. Proposal of soil indicators for spatial analysis of carbon stocks evolution. Soil Science: Confronting New Realities in the 21st Century, 17th World Congress of Soil Science, 14 - 21 August 2002, 2002, Bangkok, Thailand. pp.1783-1:1783-13. �ird-00278334�
Proposal of soil indicators for spatial analysis of
carbon stocks evolution
DE NONI Georges (1), BLAVET Didier (1), LAURENT Jean-Yves (1), BISSONNAIS Yves LE (2) and ASSELINE Jean (1)
(1) IRD Institut de Recherche pour le Développement, 911 Avenue Agropolis, B.P. 5045, 34032 Montpellier, France
(2) INRA: Institut National de la Recherche Agronomique, Science du Sol, Centre de Recherche d’Orléans, 45160 Ardon., France
Abstract
As erosion, exacerbated by the extension of vine growing on hillslopes in Mediterranean environment, takes part in the spatial reorganization of topsoil and his carbon stock, indicators stemmed from this phenomena could be useful for studying space-time variations of carbon stocks. On the other hand, aggregate stability indexes could be useful also to define such indicators because they can be relevant in this environment inducing runoff and erosion when soils are uncovered or low plant covered. Within this framework, our objective was to test four widely used methods for aggregate stability determination, that includes slaking effects and gives indexes such as macro-aggregates rates (MA 200) or mean weight diameter (MWD). The test was performed in three French Mediterranean study sites characterized by brown calcareous soils, vineyard and the existence of previous erosion data from simulated rainfalls. Our first goal was to select the aggregate stability method which was best correlated with datafrom simulated rainfalls. For that, we chose 5 farming situations, corresponding to 14 simulated rainfalls with an intensity of 60 mm h-1, located on the stations of Corconne village and Pradel. Significant relationship were found between rainfall simulations data and aggregate stability indexes: the relationships are positive and linear in case of the runoff initiation variable and negative and curvilinear in case of the other runoff and soil losses variables. The 2 indexes resulting from the method of Le Bissonnais (MWD in its logarithmic form and MA 200) are the best adjusted with all these variables. The second goal was to analyze the relationship between aggregate stability and soil properties that were relatively easy to spatialize. We took complementary soil samples on various situations of the 3 selected sites; thus, 68 soil samples were carried out on the whole. The relationships between the 2 indexes of Le Bissonnais’s method and soil properties show that there is a very significant correlation with the organic carbon rate (CSOM), while the adjustments are significantly better with curvilinear regression models. The 2 indexes of Le Bissonnais’s method, that give very significant correlations with simulated erosion data and CSOM which is a good indicator for the spatialization of these 2 indexes, appears to be very useful for the forecasting of the spatial evolution of carbon stocks in the studied area
Keywords: erosion, carbon, rainfall simulation, aggregate stability, spatialization,
Introduction
In Mediterranean environment, the risks of reduction of soil carbon stocks by runoff and erosion increased lately under vineyard, because of the extension of vine growing on hillslopes, which intended to improve quality of the wine. A better evaluation of these risks requires the identification of runoff and soil erosion indicators that could be introduced in spatialized models. Among these indicators, the soil aggregate stability is significant in this environment, since it can induce runoff and erosion when the soils are not covered any more by the initial vegetation. However, for the soils of this environment, such as calcareous soils, it remains to identify the most suitable indexes of soil aggregate stability (Le Bissonnais, 1996b; Saidi et al., 1999). This indexes should be, at the same time, relevant with respect to runoff and erosion processes, and relatively easy to spatialize.
Within this framework, and with the view to take part in the forecast of the spatial evolution of soil carbon stocks, we pursued two dependent goals in several representative study sites with calcareous soils:
- as a first goal, we compared four laboratory methods that produce aggregate stability indexes and partly reproduce the effect of the intense rains of the Mediterranean climate, in order to select the indexes which are best correlated with runoff and erosion data from simulated rainfalls. These laboratory methods were based on the works of Yoder (1936), Hénin et al. (1958), Kemper and Rosenau (1986), and Le Bissonnais (1988, 1996a).
- as a second goal, we analysed the relationship between the selected indexes and several soil properties that are relatively easy to spatialize.
Materials and Methods Study sites
We selected three representative study sites with brown calcareous soils, from previous studies on the geological substratum, the soil organisation, the hydrodynamic behavior, and the local climate:
The site of Pradel (44°35′ N-4°30′ E) is localised in Ardèche (southern of the Rhone-Alpes region, France), at an altitude of 250 meters, on a scrap of erosion glacis. The substratum is a calcareous marl supporting a layer of colluviums. The experimental domain was set up by the Research and Studies Center on Dry and Mediterranean Mountains (CERMOSEM). It consists of runoff plots under vine, with an average slope of 10%. . The brown calcareous soil (brown calcic cambisol), about 1 meter thick, have a silty-clay texture Annual average precipitations are 1000 mm, and their mediterranean rhythm frequently provides intensities higher than 50 mm h-1 (Maillo, 1999).
The site of Corconne (43°51′ N-3°56′ E) is located in Gard, in the North of Montpellier (Languedoc Roussillon region, France). The landscape is covered by scrubland and vineyards. It includes an argillaceous sedimentary basin with limestone conglomerates, at an altitude ranging between 100 and 120 m. This basin is overhung by small limestone hills slightly undulating with slopes from 10 to 20%. For this study, 4 stations representative of these conditions were selected: the station of Corconne village is localised in the downstream part of a hill; those of Vacquières and Triadou are in the basin, and that of Lancyres is perched on a shelf which dominates of a few tens of meter the basin. The calcareous soils of these stations (calcaric regosols and brown
calcic cambisols), 0.4 to 1.5 meter thick, have a silty-clay texture. Annual average precipitations are 1,100 mm, and the decennial rainfall intensities are from 55 to 60 mm h-1 during one hour (Arshad et al., 1999).
The site of Roujan (43°30′ N-3°18′ E) is located in Hérault, in North East of Bé ziers, about 60 km west of Montpellier (Languedoc Roussillon region, France). It is a small wine-growing catchment of 91 ha, which is used for experimental studies by the soil science laboratory of the French National Institute of Agricultural Research (INRA) from Montpellier. The soil texture varies according to the position in the slope. On uneven of 50 meters one finds stony chromic luvisols (quartz and limestones) in summit position, loamy calcaric regosols on anthropic terraces in midslope position, loamy calcic cambisols in footslope position, and clayey gleyic cambisols downslope (Andrieux et al., 1993). Annual average precipitations are 650 mm and the rainfall intensity of storms exceeds 30 mm h-1 , with instantaneous intensities that can reach 200 mm h-1 (Andrieux et al., 1997). For this study, the soil samplings were carried out on the loamy calcareous soils in midslope and footslope position.
Experimental set-up
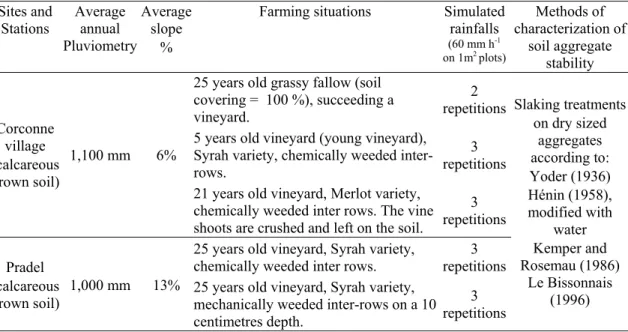
For establishing the relationships between aggregate stability indexes and several rainfall simulation variables (the first aim of the study), we chose 5 farming situations distributed on the stations of Corconne village and Pradel (Table 1). Three situations were selected in Corconne village: two parcels of chemically weeded vineyard, planted in 1996 (5 years old) and 1980 (21 years old), and a parcel in long duration grassy fallow, weeded for the experimentation. (25 years old). In Pradel, the two situations selected are parcels of weeded vineyard, one chemically (25 years old) and the other mechanically (25 years old). Data on runoff and erosion were obtained with 14 simulated rainfalls including repetitions, with an intensity of 60 mm h-1 (Table 1).
Table 1 Farming situations and protocol used for the 1st phase of the study.
Sites and Stations Average annual Pluviometry Average slope %
Farming situations Simulated rainfalls (60 mm h-1 on 1m2 plots) Methods of characterization of soil aggregate stability 25 years old grassy fallow (soil
covering = 100 %), succeeding a vineyard.
2 repetitions 5 years old vineyard (young vineyard),
Syrah variety, chemically weeded inter-rows. 3 repetitions Corconne village (calcareous brown soil) 1,100 mm 6%
21 years old vineyard, Merlot variety, chemically weeded inter rows. The vine shoots are crushed and left on the soil.
3 repetitions 25 years old vineyard, Syrah variety,
chemically weeded inter rows. repetitions3 Pradel
(calcareous brown soil)
1,000 mm 13% 25 years old vineyard, Syrah variety, mechanically weeded inter-rows on a 10 centimetres depth. 3 repetitions Slaking treatments on dry sized aggregates according to: Yoder (1936) Hénin (1958), modified with water Kemper and Rosemau (1986) Le Bissonnais (1996)
These rains were carried out on plots of 1 m2 with an Orstom-type rainfall
simulator, with a metering and mobile jet that generates rains of intensity ranging between 10 and 150 mm h-1 (Asseline and Valentin, 1978). Under vine, the rains were
carried out in the inter-rows. In addition, 38 soil samples were taken from the topsoil layer (0-5 cm) of the 5 selected situations, for measurements of soil aggregate stability and for physico-chemical analysis. From the hydrographs and turbidigraphs analysis, we obtained the following variables: RBR = rainfall before runoff initiation; KRU30 = runoff ratio during 30 min; KRI30 = instantaneous runoff ratio at 30 min after the beginning of the simulated rainfalls; KRIPAL = instantaneous runoff ratio at equilibrium runoff rate (hydrograph’s plateau); TURBIPAL = running water turbidity at equilibrium runoff rate; TURBI30 = turbidity with 30 min; ERO30 = soil losses during the first 30 min of simulated rainfalls.
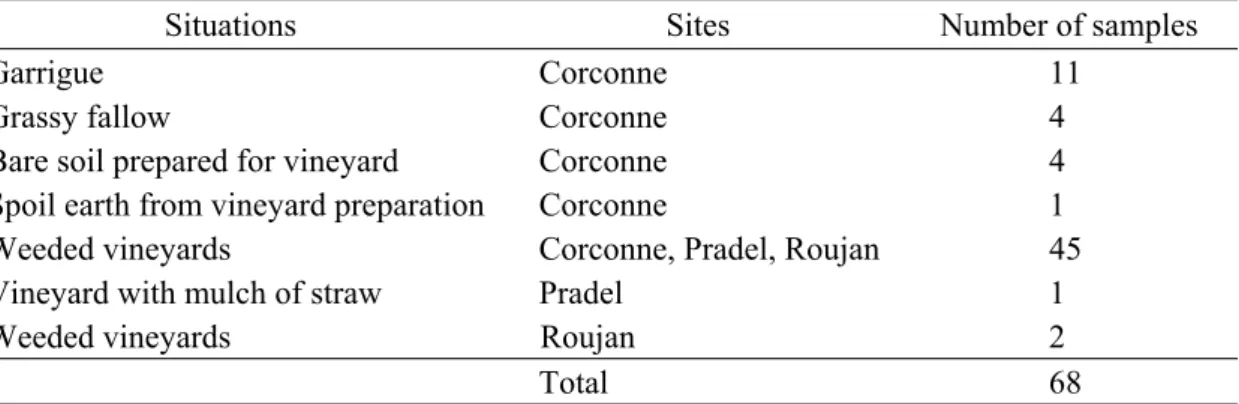
To meet our second aim, i.e. the relationship between selected indexes and soil properties, the whole of 68 topsoils samples were carried out on various situations of the 3 selected study sites (Table 2).
Table 2 Situations and soil samples used for the 2nd phase of the study.
Situations Sites Number of samples
Garrigue Corconne 11
Grassy fallow Corconne 4
Bare soil prepared for vineyard Corconne 4
Spoil earth from vineyard preparation Corconne 1
Weeded vineyards Corconne, Pradel, Roujan 45
Vineyard with mulch of straw Pradel 1
Weeded vineyards Roujan 2
Total 68
Soil samples analysis
The 38 samples of soil selected for the first phase of the study were the subject of aggregate stability analysis according to 4 methods of which the common treatment is a slaking effect, by bursting of dry samples during their fast immersion in deionised water (Le Bissonnais and Le Souder, 1995). Principal specificities of these methods are as follows:
Method of Yoder (Yoder, 1936)
80 g of the 3,150-5,000 µm soil fraction are poured on a column of sieves, which is immersed in water. The classes of aggregates are separated by sifting in water using the Yoder apparatus (amplitude 33 mm, frequency 30 cycles min-1, duration 30 min). After drying, an aggregate size distribution curve is obtained, for aggregates between 0.1 and 5,000 µm.
Method of Hénin (Hénin et al., 1958)
Modified with water: 10 g of the 0-2,000 µm soil fraction are poured on a 200 µm sieve, which is immersed in water. The water stable aggregates > 200 µm are separated from the remainder of soil with the apparatus of Féodorof (amplitude 40 mm, frequency 60 cycles min-1, duration 30 seconds).
Method of Kemper & Rosenau (Kemper and Rosenau, 1986)
4x4g of the 500-2000 µm soil fraction are poured on a 200 µm sieve, which is immersed in water. The stable fraction >200 µm is separated from the remainder of the sample by using the apparatus of Kemper and Koch (amplitude 13 min, frequency 35 cycles min-1, duration 6 mn).
Method of Le Bissonnais (Le Bissonnais, 1996a)
5x10 g of the 3,150-5,000 µm soil fraction are poured on a 200 µm sieve, which is immersed in water. The fraction >200 µm is stabilized with ethanol before being dried and gently sifted. The aggregates size distribution < 200 µm is obtained by laser diffraction. An aggregate size distribution curve is obtained, for aggregates between 0.1 and 5,000 µm.
For each of the 4 methods, coarse sands (200-2,000 µm) were separated from the aggregates by chemical dispersion and ultra sounds. A first type of aggregates stability index, the rate of aggregates > 200 µm (MA200) were then calculated. This rate was expressed in 2 ways, according to whether we took into account or not of coarse sands and gravels (EG, 2,000 –5,000 µm): i) MA200 = (weight of aggregates X 100)/[weight of sample–(SG +EG)], or ii) MA200G = [(weight of aggregates + SG+EG)x100]/ (weight of sample). For the methods of Yoder and Le Bissonnais, which give the particles size distribution in the range 0.1-5,000 µm, the results gave also the mean weight diameter, either without coarse sands and gravels (MWD) or by counting the latter (MWDG).
Furthermore, three potential factors of the aggregate stability in calcareous soils were analyzed on the whole 68 samples: the organic carbon rate, the texture and the content of CaCO3 (Le Bissonnais and Le Souder, 1995; Le Bissonnais, 1996b). Organic carbon rate was determined by elementary microanalysis CHN on samples crushed in particles < 200 µm, after removing of carbonates by samples acidification. The content of CaCO3 was deduced from the difference between carbon rates before and after the samples acidification. Finally, the particles size analysis were carried out by laser diffraction (Laurent and Albrecht, 1993).
Statistical calculations
The study of the relations between the aggregate stability indexes and the variables resulting from the simulated rains led i) to the neperian logarithmic transformation of MWD variables (log(MWD+1)), in order to obtain quasilinear functions between these indexes and the MA indexes, and ii) to adopt the neperian logarithmic form of erosion within 30 minutes (log(ERO30+1)), in order to improve the adjustments. The research of the best functions of adjustment between the aggregate stability indexes and the variables of simulated rainfall was carried out with the nonlinear regression module of Statistica 5.5 © software (StatSoft Inc.), by associating the simplex and Newton methods of convergence. To obtain an overall assessment of the intensity of the relations between each aggregate stability indexes and the whole of the variables of simulated rainfall, we calculated, from the best models of regression obtained, a synthetic coefficients of correlation (rsyn), defined by equation 1:
n Pearson rsynIAGi n j j r IAGi yj ∑= = = 1 2 ) , ( (1)
where r pearson is a Pearson coefficient of correlation, IAGi is an index of aggregate stability, yj a variable of simulated rainfalls, and n is the number of variables of simulated rainfalls.
To validate the assumption resulting from these synthetic coefficients, we calculated the sum of the probabilities of difference between the rPearson coefficients of a
selected aggregate stability index and the other ones for each variable of simulated rainfall, with a standard procedure of statistical comparison by couples of r coefficients.
Results Physicochemical properties of topsoil
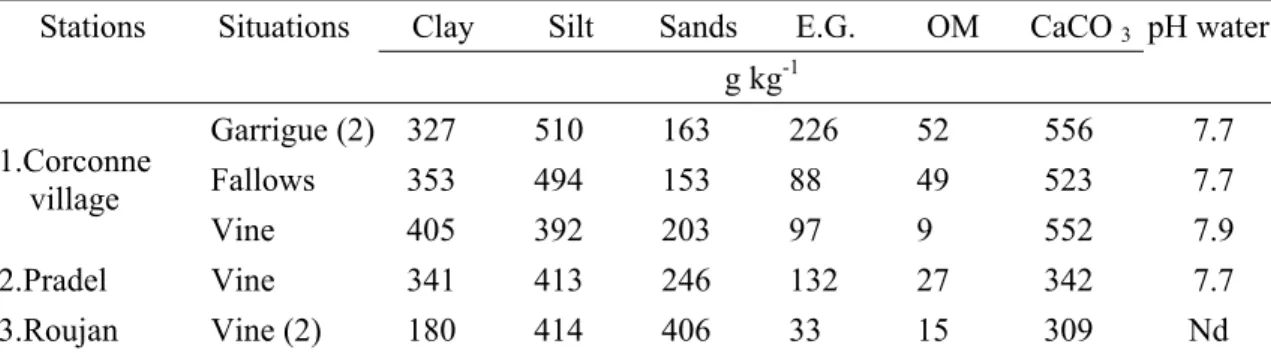
Table 3 Results indicates the prevalence of CaCO3 contents in the topsoil (0-5 cm) of all the studied stations (Table 3). Silty clay textures of the stations of Corconne village and Pradel are similar, but the topsoil of the station of Roujan has a more sandy texture. The organic matter content under vines are clearly lower than those under fallow.
Table 3 Physico chemical topsoil properties (0-5 cm) of the 3 selected stations.
Clay Silt Sands E.G. OM CaCO 3
Stations Situations g kg-1 pH water Garrigue (2) 327 510 163 226 52 556 7.7 Fallows 353 494 153 88 49 523 7.7 1.Corconne village Vine 405 392 203 97 9 552 7.9 2.Pradel Vine 341 413 246 132 27 342 7.7 3.Roujan Vine (2) 180 414 406 33 15 309 Nd
Abbreviations used: E.G: gravels. OM: organic matter (2): situations used for the 2 nd phase of the study.
Relationships between rainfall simulation and aggregate stability indexes
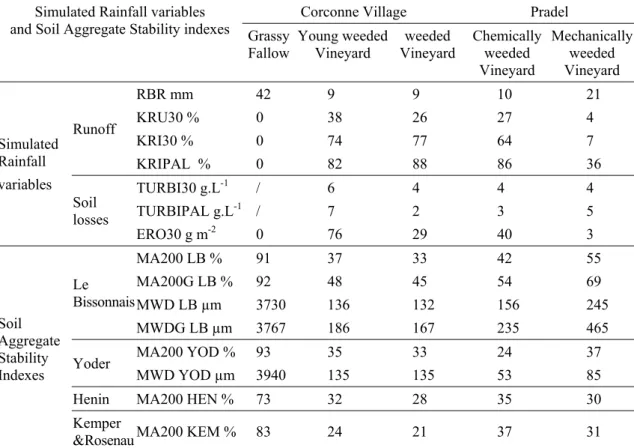
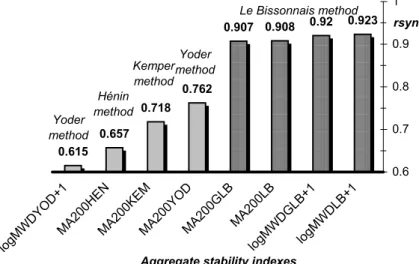
Table 4 presents the averages, in the 5 selected situations, of: i) the runoff and erosion data obtained from simulated rainfalls, and ii) the aggregates stability indexes. One can note that the situations that have the highest aggregate stabilities (fallow, and secondarily mechanically weeded vine) have also the highest rainfall before runoff initiation (RBR), the lowest runoff coefficients (lowest KRU30, KRI30, KRIPAL) and the lowest soil losses (lowest log(ERO30+1)). Furthermore, no significant relationships were found between the aggregates stability indexes and the turbidity variables (TURBI30 and TURBIPAL), but significant relationships were established between these aggregate stability indexes and the other rainfall simulation variables. Table 5 presents only the significant relationships found, with the rPearson values and the associated regression models. The relationships are positive and linear in case of the RBR variable; they are negative and curvilinear or linear in case of the other runoff and soil losses variables. The values of the synthetic coefficient rsyn (c.f. § 3.4 for rsyn definition) appear in the last line of this table. These values are represented on a histogram in Figure 1. They show that indexes resulting from the method of Le Bissonnais-MA200 and MWD in its logarithmic form - are the indexes best adjusted with the runoff and soil losses variables, which has been confirmed by the statistical comparison by couples of r coefficients.
Table 4 Averages of the simulated rainfall variables and the soil aggregate stability
indexes for the 5 selected farming situations.
Corconne Village Pradel Simulated Rainfall variables
and Soil Aggregate Stability indexes Grassy
Fallow Young weededVineyard Vineyardweeded Chemicallyweeded Vineyard Mechanically weeded Vineyard Runoff RBR mm KRU30 % KRI30 % KRIPAL % 42 0 0 0 9 38 74 82 9 26 77 88 10 27 64 86 21 4 7 36 Simulated Rainfall variables Soil losses TURBI30 g.L-1 TURBIPAL g.L-1 ERO30 g m-2 / / 0 6 7 76 4 2 29 4 3 40 4 5 3 Le Bissonnais MA200 LB % MA200G LB % MWD LB µm MWDG LB µm 91 92 3730 3767 37 48 136 186 33 45 132 167 42 54 156 235 55 69 245 465 Yoder MA200 YOD %
MWD YOD µm 93 3940 35 135 33 135 24 53 37 85 Henin MA200 HEN % 73 32 28 35 30 Soil
Aggregate Stability Indexes
Kemper
&RosenauMA200 KEM % 83 24 21 37 31
Abbreviations used : Rainfall simulation variables: see § 3.2. Soil aggregate stability indexes: see § 3.3; the suffixes indicate the methods used: LB for Le Bissonnais, YOD for Yoder, HEN for Hénin, and KEM for Kemper & Rosenau.
Table 5 Coefficients of correlation between soil aggregate stability indexes and
simulated rainfall variables.
x (soil aggregate stability indexes) y (simulated rainfall variables) Nb. LogMWD GLB+1 MA200 GLB LogMWD LB+1 MA200 LB LogMWD YOD+1 MA200 YOD MA200 HEN MA200 KEM Coefficient of correlation (rpearson):
RBR (r > 0) 12 0.967*** L 0.945*** L 0.945*** L 0.961*** L 0.772** L 0.880*** L 0.830*** L 0.852*** L KRU30 R < 0) 14 0.809*** C 0.791*** C 0.830*** C 0.787*** C 0.454ns L 0.565* C 0.488ns L 0.589* C KRI30 (r < 0) 14 0.947*** C 0.940*** C 0.951*** C 0.937*** C 0.485ns L 0.654* C 0.553* L 0.651* C KRIPAL(r < 0) 14 0.967*** C 0.962*** C 0.968*** C 0.962*** C 0.719** L 0.944*** C 0.743** L 0.780** L Log(ERO30+1) (r < 0) 14 0.901*** C 0.886*** C 0.914*** C 0.883*** C 0.580* L 0.698** C 0.611* L 0.687** L Synthetic coefficient of correlation (rsyn):
All y variables 0.920 0.907 0.923 0.908 0.615 0.762 0.657 0.718 Abbreviations used : ns=non significant; *,**,***=significant with the threshold of 95%, 99%and 99.9%
0.615 0.657 0.718 0.762 0.907 0.908 0.92 0.923 0.6 0.7 0.8 0.9 1 logMWDYOD+1 MA200HENMA200KEMMA200YODMA200GLBMA200LB logMWDGLB+1logMWDLB+1
Aggregate stability indexes
rsyn Le Bissonnais method Yoder method Yoder method Hénin method Kemper method
Figure 1 Comparison of the synthetic coefficients of correlation (rsyn) between eight
soil aggregate stability indexes and 5 rainfall simulation variables (Data from Table 5).
Relationships between aggregates stability indexes and topsoil properties
Datas of Table 6 were obtained from the 68 soil samples available, and the two aggregate stability indexes of the method of Le Bissonnais that are best correlated with the rainfall variables.
Table 6 Relations between the soil physico-chemical properties and the two selected
soil aggregate stability indexes.
x (Physico-chemical properties) y ( aggregate
stability indexes) samplesNb. of CSOM CLAY A+LF SILT SAND CaCO
3
log(MWDLB+1) 68 0.822***L 0.917***C 0.252*L 0.230nsL 0.431***L -0.412***L 0.004nsL MA200LB 68 0.839***L 0.912***C 0.325**L 0.344**L 0.434***L -0.470***L -0.072nsL Abbreviations used : ns: non significant ; *,**,***= significant with the threshold of 95%, 99% and 99.9% L= linear models C= curvilinear models (CSOM and MA200LB in g.100g-1; MWDLB in µm):
This Table presents the relationships between these two stability indexes and the organic carbon rate (CSOM), the texture and the CaCO3 content. These stability indexes vary in a very significant way with the organic carbon rate (rPearson = 0.917 for the MWD; and 0.912 for the MA200), while the adjustments are significantly better with curvilinear regression models (p > 95 %). These curvilenear models are given by equations 2 and 3: e CSOM MWDLB ) 01 . 1 ( 10 7 8 1 76 , 2 83 . 4 ) 1 log( − ⋅ ⋅ ⋅ + + = + (2) e CSOM LB MA ( 0.67 ) 10 . 139 , 4 5 1 86 , 52 6 , 35 200 − ⋅ + + = (3) The relationships between texture and these aggregate stability indexes appear weaker (|r| < 0.45). However, a thorough analysis of the data reveals that for situations with low organic carbon content (< 10 g kg -1), 70% of the increase in soil aggregate
stability is explained by the increase in clay contents. Lastly, the relationships between texture and CaCO3 contents are not significant.
Figure 2a and 2b show the “S” shape of the relationship between CSOM and the stability indexes of the 68 soil samples. It shows the existence of a threshold, located between 20 and 25 g kg-1 of CSOM, below which the aggregate stability indexes are low (MWD ranging from 100 to 200 µm, and MA 200 lower than 40%). Beyond this threshold, the aggregate stability indexes reach quickly high values (MWD ranging from 1,000 to 3,500 µm, and MA200 higher than 80%). This threshold separates vineyards (low CSOM) from “garrigue” and fallow (high CSOM).
LMWDLB=(4,8308)+((2,757505)/(1+(7e8)*(exp((-1,049655)*CSOM)))) CSOM g.Kg-1 LMWDLB log(µm) 4 5 6 7 8 9 0 5 10 15 20 25 30 35 40 45 50 55 60 MA200LB=(32,58097)+((52,85705)/(1+(413890,6)*(exp((-0,667628)*CSOM)))) CSOM g.Kg-1 MA200LB g.100g -1 0 20 40 60 80 100 0 5 10 15 20 25 30 35 40 45 50 55 60
Figure 2 Relationships CSOM/MWDLB (a), and CSOM/MA200LB (b). Discussion
The results show in particular that runoff rates can reach high values (Table 4). This reproduces what occurs generally in Mediterranean landscape, where runoff frequently initiate catastrophic floods and pollution, and is a very active process The total soil losses within the first 30 min of simulated rainfalls are relatively low, but these soil losses, which represent only the interrill erosion, can be rich in organic matter. Moreover, the observed high runoff rates can also initiate a substantial rill erosion which could be measured by other methods than rainfall simulation (Asseline et al., 1993, in particular).
Furthermore, these results bring two sets of information, which are discussed below.
Relationship between aggregates stability indexes, runoff and soil losses under simulated rainfalls
Most of the relations calculated between the stability indexes and the variables of
rainfall simulations referring to the runoff and the soil losses into 30 min are significant. This joins the conclusions of other studies carried out under simulated or natural rainfalls (Barthès et al., 2000, in particular). The lack of relationship between these indexes and the turbidities variables is not surprising, and it can be explained by the creation of natural water puddles in the soil surface micro depressions, which induce some irregularities in the water flow.
The indexes resulting from the method Le Bissonnais (1996a) seem particularly interesting, as runoff and erosion indicators, since they are better correlated with the rainfall simulation variables than the indexes resulting from the other methods. On one hand, the preparation of the samples (aggregates up to 5,000 µm and soil weights of 50
b a
g) used for this method cannot be the only causes of these differences, although it probably improves the representativeness of the samples, compared to the methods of Hénin (1958) and Kemper and Rosenau (1986). Indeed, the sample preparation in the method of Yoder (1936) is similar, although this method does not provide excellent correlations in this study. On the other hand, a significant improvement seems to lie in the disappearance of mechanical agitation added to the slaking treatment, which is specific to the method of Le Bissonnais, and which reproduces probably in a better way the conditions under rainfalls.
A complementary interest of this method results in the fact that it can take account of the gravels, which are frequent in the Mediterranean soils, insofar as the correlations obtained by integrating coarse sands and gravels are almost as good as by withdrawing these elements.
In addition, compared to the methods of Henin and Kemper and Rosenau, the soil aggregate stability indexes provided by this method give a more complete information about the aggregates size distribution, by the taking into account of the MWD (Amezketa et al., 1996).
Relationships between soil aggregate stability indexes and topsoil properties
The results presented in Table 6 and Figures 2a and 2b, show, for the 68 studied situations, that the soil aggregate stability is strongly correlated to the organic carbon rate (CSOM rate). The organic matter thus appears as a predominant indicator of the aggregate stability. Although organic matter’s role is variously explained by the authors, one of the most frequent explanations is the protective role of organic matter against the slaking effect-(Le Bissonnais and Singer, 1993; Le Bissonnais and Le Souder, 1995; Barthès et al., 1999; Saïdi et al., 1999; Six et al., 2000). It is thus probable that organic matter is not only an indicator, but also a determining factor, without which the soil aggregate stability could not be maintained (Jacquin, 1978; Six and et al., 2000).
From these results, it appears possible to estimate the MA200 or MWD indexes obtained by the method of Le Bissonnais from the carbon organic rate in the type of calcareous soils studied. However, the results show that the texture effect cannot be neglected. for situations with low CSOM rate. Lastly, the lack of correlation between aggregate stability and CaCO3 contents do not indicate the absence of stabilizing role of CaCO3, but more probably that this role is undifferentiated in the range of the studied soil samples.
Conclusions
From this study, it may be advisable to retain, as runoff and erosion indicators, two aggregates stability indexes resulting from the method suggested by Y. Le Bissonnais (1996a), which minimizes mechanical agitation after slaking treatment on sized aggregates. Indeed, pedotransfer functions link narrowly these indexes to the sensitivity of soils to runoff and interrill erosion, on the one hand, and to the organic carbon rate (CSOM rate) on the other hand.
Insofar as the spatial variability of the CSOM rate can be evaluated by various methods (Bourgeon, 1999; Arrouays and et al., 1998; Chen and et al., 2000), CSOM appears as a good indicator for the spatialization of these two soil stability indexes. Furthermore, as runoff and interrill erosion are two major factors of the spatial evolution of carbon stocks, it appears possible to propose, for the studied area, the
implementation of a procedure which integrates the selected soil aggregate stability indexes., for the forecasting of the spatial evolution of carbon stocks: the first phase of this procedure, starting from the pedotransfer functions, would consist in the acquisition of the organic carbon rate spatial variability, in order to evaluate the spatial variations of the selected indexes. In a second phase, the evaluation of the spatial variations of these soil stability indexes could be integrated in a forecasting model of erosion risks, in combination with other factors of runoff and erosion such as slope, climate, plant cover within the studied area (King et al., 1998). Lastly, this evaluation of the spatial variations of erosion risks could be integrated into the forecast of the spatial evolution of carbon stocks in the studied area.
Acknowledgements
This study was granted by SEZAM program, S018 Unit and R041 Unit of IRD. Methodology was elaborated in collaboration with the Soil Science Unit of INRA-Ardon. The team was accomodated on the experimental sites of the soil science laboratory of INRA-ENSAM, the CERMOSEM, and the wine co-operative of Corconne. Work at Pradel site was completed in co-operation with L. Maillo, from Joseph Fourier University of Grenoble, and E Roose (IRD, Erosion network). The finalization of this work was carried out within the MOST laboratory of IRD, Montpellier.
References
Amezketa, E., M. Singer and Y. Le Bissonnais. 1996. Testing a new procedure for measuring wet aggregate stability. Soil Sci. Soc. Am. J. 60: 888-894.
Andrieux, A., R. Bouzigues, C. Joseph, M. Voltz, Ph. Lagacherie and M. Bourlet. 1993. Le Bassin Versant de Roujan, Caractéristiques Générales du Milieu, Rapport INRA, Science du Sol, Montpellier. 57 p.
Andrieux, P., J. Asseline, G. De Noni, F. Gaddas and J. Leonard. 1997. Caractérisation spatiale et hydrodynamique des états de surface d'un bassin versant cultivé en milieu méditerranéen. Journée thématique AFES du 27/11/97, Orstom, Paris. Arrouays, D., M. Bernoux and C. Jolivet. 1998. Spatialisation des stocks d’éléments
dans les sols. Outils actuels et potentialités : cas du carbone organique. Cahiers Agricultures 7:347-356.
Arshad, M.A., J. Asseline, D. Blavet, G. De Noni, J.Y. Laurent and J.C. Leprun. 1999. Soil properties as affected by different land use practices in the Languedoc region of southern France, pp. 619-621. In J. Bech (ed.). Sixth International Meeting on Soils with Mediterranean Type of Climate. Universitat de Barcelona (SPA).
Asseline, J. and C. Valentin. 1978. Construction et mise au point d’un infiltromètre à aspersion. Cah. Orstom, sér. Hydrol. 15(4):321-349.
Asseline, J., G. De Noni, J.F. Nouvelot and E. Roose. 1993. Note sur la conception et l’utilisation d’un simulateur de ruissellement. Cah. Orstom, sér. Pédol. 28(2):405-411.
Barthès, B., A.Albrecht, J. Asseline, G. De Noni and E. Roose. 1999. Relationship between soil erodibility and topsoil aggregate stability or carbon content in a cultivated Mediterranean highland, Aveyron, France. Communications in Soil Science and Plant Analysis 30:1929-1938.
Barthès, B., A. Azontonde, B.Z. Boli, C. Prat and E. Roose. 2000. Field-scale run-off and erosion in relation to topsoil aggregate stability in three tropical regions,Benin, Cameroon, Mexico. European Journal of Soil Science 51:485-495.
Blanchart, E., W. Achouak, A. Albrecht, M. Barakat, G. Bellier, Y.M. Cabidoche, C. Hartmann, T. Heulin, M.C. Larré-Larrouy, J.Y. Laurent, M. Mahieu, F. Thomas, G. Villemin and F. Watteau. 2000. Déterminants biologiques de l'agrégation dans les vertisols des Petites Antilles. Etude et Gestion des Sols 7:329-352.
Bourgeon, G., S. Salvador Blanes, F. Houillier, C.S. Harindranath, C.R. Shivaprasad. 1999. Cartographie du carbone organique des sols en Inde du Sud, Bois et Forêts des Tropiques, Edit. Cirad. 262(4):31-43.
Chen, F. D.E. Kissel, L.T. West and W. Adkins. 2000. Field scale mapping of surface organic carbon using remotely sensed imagery. Soil Sci. Soc. Am. J. 64:746-753. Hénin, S., G. Monnier and A. Combeau. 1958. Méthode pour l'étude de la stabilité
structurale des sols. Annales Agronomiques 1:71-90
Jacquin, F. 1978. Influence de la matière organique sur la structure des sols, pp. 369-382. In “11 th International Congress of Soil Science”, Edmonton.
Kemper, W.D., R.C. Rosenau and A. Klute. 1986. Aggregate stability and size distribution, pp. 425-442. In Methods of Soil Analysis Part 1. Physical and Mineralogical Methods. American Society of Agronomy Inc., Madison, Wisconsin, USA.
King, D., D. Fox, J. Daroussin, Y. Le Bissonnais and V. Daneels. 1998. Upscaling a simple erosion model from small area to a large region, pp. 143-149. In Nutrient-Cycling-in-Agroecosystems Workshop Proceedings, 7-9 August 1996, Wageningen, Netherlands, 50(3).
Laurent, J.Y. and A. Albrecht. 1993. L'utilisation de la diffraction laser pour la dé termination de la granulométrie: application aux sols, agrégats, perte en terre. Caribbean Crops and Food Society, AMDPA. eds., Le Lamentin, Martinique, 328-336.
Le Bissonnais, Y. 1988. The behaviour of soil aggregates when subjected to the actions of water: mechanisms of aggregate breakdown. Agronomie 8:915-924.
Le Bissonnais, Y. and C. Le Souder. 1995. Mesurer la stabilité structurale des sols pour évaluer leur sensibilité à la battance et à l'érosion. Etude et Gestion des Sols 2:43-56.
Le Bissonnais, Y. and M.J. Singer. 1993. Seal formation, runoff, and interrill erosion from seventeen California soils. Soil Sci. Soc. Am. J. 57:224-229.
Le Bissonnais, Y. 1996a. Aggregate stability and assessment of crustability and erodibility: I. theory and methodology. European Journal of Soil Science 47:425-437.
Le Bissonnais, Y. 1996b. Soil Characteristics and aggregate stability, pp. 41-60. In Agassi (ed.). Soil Erosion, Conservation and Rehabilitation. Dekker, New-York. Maillo, L. 1999. Influence des pratiques culturales sur le ruissellement et l’érosion sur
les coteaux viticoles du Bas-Vivarais, Thèse de doctorat. Institut de Géographie Alpine. Université Joseph Fourier de Grenoble. 217 p. + annexes.
Saidi, D., A. Douaoui, Y. Le Bissonnais and C. Walter. 1999. Sensibilité de la surface des sols du Chélif à la dégradation structurale. Etude et Gestion des sols 6:15-25. Six, J., K. Paustian, E.T. Eliott and C. Combrink. 2000. Soil structure and organic
matter: I. distribution of aggregate size classes and aggregate-associated carbon. Soil Sci. Soc. Am. J. 64:681-689.
Yoder, R.E. 1936. A direct method of aggregate analysis of soils and a study of the physical nature of erosion losses. Journal of the American Society of Agronomy 28:337-351.