HAL Id: hal-03126073
https://hal.inrae.fr/hal-03126073
Submitted on 8 Feb 2021HAL is a multi-disciplinary open access archive for the deposit and dissemination of sci-entific research documents, whether they are pub-lished or not. The documents may come from teaching and research institutions in France or abroad, or from public or private research centers.
L’archive ouverte pluridisciplinaire HAL, est destinée au dépôt et à la diffusion de documents scientifiques de niveau recherche, publiés ou non, émanant des établissements d’enseignement et de recherche français ou étrangers, des laboratoires publics ou privés.
A comparison of EU and US consumers’ willingness to
pay for gene-edited food: Evidence from apples
Stéphan Marette, Anne-Célia Disdier, John Beghin
To cite this version:
Stéphan Marette, Anne-Célia Disdier, John Beghin. A comparison of EU and US consumers’ will-ingness to pay for gene-edited food: Evidence from apples. Appetite, Elsevier, 2021, 159, 11 p. �10.1016/j.appet.2020.105064�. �hal-03126073�
A Comparison of EU and US consumers’ willingness to pay for gene-edited
food: Evidence from apples
Stéphan Marettea Anne-Célia Disdierb John C. Beghinc
This version: November 25, 2020
Abstract: We compare consumers’ attitude towards and willingness to pay (WTP) for gene-edited (GE) apples in Europe and the US. Using hypothetical choices in a lab and different technology messages, we estimate WTP of 162 French and 166 US consumers for new apples, which do not brown upon being sliced or cut. Messages center on (i) the social and private benefits of having the new apples, and (ii) possible technologies leading to this new benefit (conventional hybrids, GE, and genetically modified (GMO)). French consumers do not value the innovation and actually discount it when it is generated via biotechnology. US consumers do value the innovation as long as it is not generated by biotechnology. In both countries, the steepest discount is for GMO apples, followed by GE apples. Furthermore, the discounting occurs through “boycott” consumers who dislike biotechnology. However, the discounting is weaker for US consumers compared to French consumers. Favorable attitudes towards sciences and new technology totally offset the discounting of GE apples.
Keywords: Gene editing; genetically modified organisms; hybrids; consumer information; experimental economics; willingness to pay.
a Corresponding author: Université Paris-Saclay, INRAE AgroParisTech, UMR Economie Publique. Avenue Lucien Brétignière, 78850 Thiverval-Grignon. France; Email:
marette@agroparistech.fr
b PSE-INRAE, 48 boulevard Jourdan, 75014 Paris, France. Email: Anne-Celia.Disdier@psemail.eu
c Yeutter Institute of International Trade and Finance, and Department of Agricultural Economics, University of Nebraska Lincoln, Lincoln NE 68583, USA. Email:
1. Introduction
Relying on hypothetical choices in a lab and different technology messages, we study consumers’ willingness to pay (WTP) in Europe and the US for new apples, which do not brown upon being sliced or cut. Information delivered to consumers during the experiment focuses on the social and private benefits of having the new apples, and on possible technologies leading to this new benefit (conventional hybrids, GE, and genetically modified (GMO)).
Indeed, new biotechnology tools have emerged to create novel foods or attributes in agricultural goods. These “new breeding techniques” are instrumental to maximize agriculture’s productivity, profitability and sustainability, to supply a continually increasing world demand for feed, fuel and food (Anderson et al., 2019; Möhring et al., 2020). These techniques also improve the food quality for consumers by providing new attributes like a better taste, a longer shelf life and/or the absence of browning for fruits and vegetables, naturally decaf coffee beans, gluten-free wheat, and others. These techniques include those based on Clustered Regularly Interspaced Short Palindromic Repeats (CRISPR), transcription activator-like effector nucleases (TALEN), and others, often referred to as gene-editing techniques. They are precise tools to change the genome of plants, using the plant’s own genome or the genome of related plants through cisgenesis.1
Despite the safety of these techniques, new evidence suggests they may be controversial with environmental groups, and consumers (NAS, 2016; ECJ, 2018; and Caputo et al., 2020). Consumers may have ethical concerns against biotechnology, or may follow a precautionary attitude towards these novel foods embodying biotechnological attributes because familiarity with them is limited. These concerns cross borders and are internationally
1Cisgenesis refers to a genetic mutation of a plant obtained by using genes from plants with which the original
present (Qaim, 2020). The social acceptability of these new breeding techniques is an important issue.
There are emerging and significant domestic, international, and trade frictions over these new breeding techniques use to innovate in agriculture and food markets (Bain et al., 2019; Bunge et al., 2018; NAS, 2016; and Martin-Laffon et al., 2019). Novel food and attributes in agricultural goods have to be assessed for the potential risk they may create for human health and the environment. Regulations in many countries are process-oriented rather than product oriented. Even in the US, novel foods obtained through transgenic biotechnology are regulated differently than the similar novel foods obtained through conventional breeding, or GE techniques. In addition, countries differ on labelling requirements for these novel foods.
An example of such regulatory disparity is high-oleic acid soybean oil or canola oil. These oils can be obtained through three methods with different regulatory implications, although the final product has similar nutritional and health attributes. Despite this similarity, some consumers may view these oils as different and may want to see them labeled. Hence, there are cultural and societal dimensions beyond science and health (Bain et al., 2019; Sheldon, 2002; and Heumueller and Josling, 2004). Several elements condition the impact of regulations on innovation, as it was the case twenty-five years ago for earlier GMO applications in agriculture and food markets.
Several important questions arise in this context. First, will consumers treat GE-based novel foods as they treated and still treat GMO-based food items (fresh and processed), especially when considering different countries? How will consumers be informed and how will information condition their preferences? These issues could especially be salient in countries, which have opposed GMO foods in the past, such as in the European Union (EU). The resistance was at both the consumer and regulatory levels. Lusk et al. (2005), Lusk
(2011), and Colson and Rousu (2013) summarize the large literature on willingness to pay (WTP) for GMO foods relative to conventional ones.
More recent papers continue to confirm this dislike or distrust of GMO food in various countries (for example, Lin et al., 2019, on GM meat; and McComas et al., 2014, on GM potatoes). Consumers tend to value and prefer labeling of goods regarding biotech-based foods. Consumers in all countries, which were studied, discount GMO-based foods relative to their conventional substitutes. The discounting of GMO foods has been the highest in European countries and for meat products, and the least for vegetable oils, which often do not contain GMO material.2 Despite this negative context, European consumers are gradually evolving in their attitudes towards biotechnology (Gaskell et al., 2011).
A very recent literature has emerged to evaluate WTP for novel foods based on GE techniques. Recent contributions underline a significant discount for GE foods compared to conventional foods, which is reminiscent of past reluctance to GMO food (Caputo et al., 2020; Edenbrandt et al., 2018; Muringai et al., 2020; Shew et al., 2018; and Yunes et al., 2019). These authors find that consumers discount GE goods relative to conventional and organic foods, but with a twist. GE foods show a small positive premium (increment in WTP) relative to GMO substitutes, even though both are discounted, relative to conventional and/or organic substitutes. These new findings on discounting innovations or food goods obtained through biotechnology appear robust across countries and food good types. Despite the potential benefits embodied in GE innovations as noted previously, consumers, on average, seem to discount these improvements in these new studies.
Our paper contributes to this GE acceptance debate by focusing on a specific new quality attribute linked to apples and by directly comparing consumers’ acceptance in two
2 There is also a debate in the literature on how consumers behave in real purchasing environments in stores as
opposed to the more contrived conditions of consumer surveys. Experiments tend to accentuate the divide between GMO and conventional food, whereas consumers in stores, may read labels less attentively (Noussair et al., 2002 and 2004).
different countries (France and the US), in which GMO controversies were vivid. We focus on a quality attribute in a context in which consumers usually value more characteristics bringing personal benefits than characteristics protecting the environment (Caputo et al., 2020). France serves as a radical example of European behavior (Lusk et al., 2005). The beneficial improvement refers to inhibited browning and bruising of cut apples. We elicit WTP for these new apples, relative to conventional apples. This innovation is interesting and relevant, particularly with the Arctic® apples that are non-browning apples created with GE and near commercialization. For other products with related benefits (mushrooms, cauliflowers, etc.), the frequency of purchases is much lower in France and in the US. Apples are widely consumed in both countries.
Consumer acceptance of cisgenic apples has been explored before, with a focus on environmental benefits and pest resistance (De Marchi et al., 2019; Hudson et al., 2015; and Rousselière and Rousselière, 2017). We are the first to study WTP for cisgenic/GE apples with tangible consumer benefits in the context of new and more precise breeding techniques relying on genes from the plant or closely related plants. Our analysis is also unique as WTP for new attributes are compared across three technologies (GE, GMO, conventional hybrids). Our investigation also contributes as the first analysis of consumer acceptance of GE apples across nations. Shew et al. (2018) compared WTP for rice across countries under different technologies, including GE. The closest investigations to ours are De Marchi et al. (2020) and Yang and Hobbs (2020). De Marchi et al. investigated WTP for apples in Italy, looking at the influence of time preference, technology (conventional, cisgenic), socio-demographics, country of origin, brand, and price. Focusing on Canadian consumers, Yang and Hobbs analyzed informational framing effects with different types of messages about non-browning apple slices obtained through biotechnology-enhanced antioxidants.
We find that French consumers do not value the innovation and actually discount it when it is generated via biotechnology (GE and GMO). US consumers do value the innovation as long as it is not generated by biotechnology. In both countries, the steepest discount is for GMO apples, followed by GE apples. The discounting occurs through “boycott” consumers who dislike biotechnology. However, the discounting is weaker for US consumers compared to French consumers. Favorable attitudes towards sciences and new technology totally offset the discounting of GE apples. Our findings on the GMO and GE discounting echo similar conclusions reported in Lusk et al. (2005) and Bredahl (1999) on GMO in European countries and France. This finding is in contrast to Kikulwe et al. (2011) who found that when consumers perceive personal benefits of consuming a GM food, the acceptance increases (for GM bananas in Uganda).
French consumers respond positively to longer messages on GE and GMO, with a smaller discount on the novel apples, relative to their valuations under short messages. US consumers do not seem to be consistently influenced by the length of the message. The selection of different messages is related to the literature underscoring the importance of consumers’ perceptions of the choice of words and phrasing in determining their WTP. Regarding the role of short or long explanations, Keller and Staelin (1989) and Wansink et al. (2004) showed that, if consumers receive too much information, then the marginal effect of this additional information vanishes, which pleads for short messages.
Moreover, for explanatory messages or recommendations towards consumers, the selection of words expressing different points of view appears to be instrumental in the context of food biotechnology (Rousu et al., 2007). In particular, the appearance of the word “GMO” is likely to entail a kind of attentional bias, explaining how consumer's beliefs and perceptions are swayed by the presence or the absence of this word (see Bar-Haim et al., 2007 for the broad notion of attentional bias in psychology). These potential effects are
investigated with our design, dividing the samples with half of participants receiving short messages without scientific acronyms, and another half of participants receiving long messages with scientific words such as GMO, CRISPR, or Deoxyribonucleic Acid (DNA).
Regarding our finding on consumers’ attitudes towards food innovation and technology acceptance, the discount on GMO apples remains in both countries, even for consumers who are inclined towards technology and innovations. Our result on attitudes toward food innovation and technology acceptance offsetting the GE discount, shows the importance of measuring acceptance of technology as part of characteristics of consumers. This finding complements results by Lin et al. (2019) who focus on six key personality traits of consumers and their impact on the acceptance of GM pork across three countries (US, China, and Italy). These authors highlight the importance of openness to experience as a key trait explaining the acceptance of GMO meat products and mitigating lower WTP for GMO meat products. Their findings corroborate our findings with our index of consumer acceptance of technology and innovation
The remainder of the paper is organized as follows. Section 2 focuses on the experimental design. Section 3 presents the results. Section 4 discusses the implications for regulatory policies and concludes.
2. The experiment
This section details the respondents, the product, the experimental procedure and the information revealed.
2.1 Respondents in France and the US
We conducted the experiment in France (Dijon) and in the US Midwest (Ames, Iowa) in multiple sessions in December 2019 (for France) and early March 2020 (for the US). In France, we selected the participants using the quota method, which uses the same proportions
of sex, age and socio-economic status (occupation, income, education) criteria in the group of respondents as in the general French population. In the US, the initial selection of invited subjects followed a similar method, although on the day of the experiment, the subjects sample had over representation of female participants and college graduates but were very close to Iowa’s census figures for median age and income. Iowa has educational attainment levels comparable to those of the US as a whole (61.7% with some university education for the US and 61.4% for Iowa for population of 25 years old or older) as well as comparable age and income levels. Both French and the US samples focus on urban consumers.
For France, participants were recruited through the Chemosens PanelSens database built by the Centre des Sciences du Goût et de l'Alimentation, INRAE Dijon.3 In the US, subjects were selected by the Center for Survey Statistics and Methodology at Iowa State University,4 with similar segmentation by gender, age, and socio economic status. Our targeted group is relatively representative of the age groups and the socio-economic status of the French and US population, with the noted US caveats. Participants were first contacted by phone and informed that they would earn a participation fee of €10/USD25 for replying to questions about food for about 45 minutes. The target respondents consist of 162 (France) and 166 (US) people aged between 18 and 73 for France (resp. between 18 and 78 for the US).5 In the experiment, we divided our respondents into four groups and randomly assigned participants to groups. The groups received the same type of information but in a different order and with different degrees of details (see below).
Table 1 presents the socio-economic characteristics (age, gender, education, income,
3 This recruitment database has been declared to the relevant authority (Commission Nationale Informatique et
Libertés – CNIL – n°1148039). Moreover, our specific experimental study was reviewed and approved by the data protection committee of CNRS (Certificate 2-19086 \ UMR6265).
4 CSSM is the oldest US survey research center (established in 1938). It has helped numerous federal and state
agency and university researcher conducting surveys. Among other things, CSSM developed the Master Sample of Agriculture, and developed the sampling methods for the US Federal National Resource Inventory survey, which CSSM continues to support today. A brief history is here: https://www.cssm.iastate.edu/history.
5 The exclusion of unengaged participants bidding zero at each round does not change the nature of the
conclusions. Results are available upon request. The French sample includes 7 unengaged participants, while the US sample includes only 1 unengaged participant.
household composition) of the participants within each sample (French and US) and the frequency of their apple consumption. The income comparison is more difficult because US median disposable income is higher than in France. In addition, French participants consume apples more frequently than US participants, on average.
<Table 1 about here>
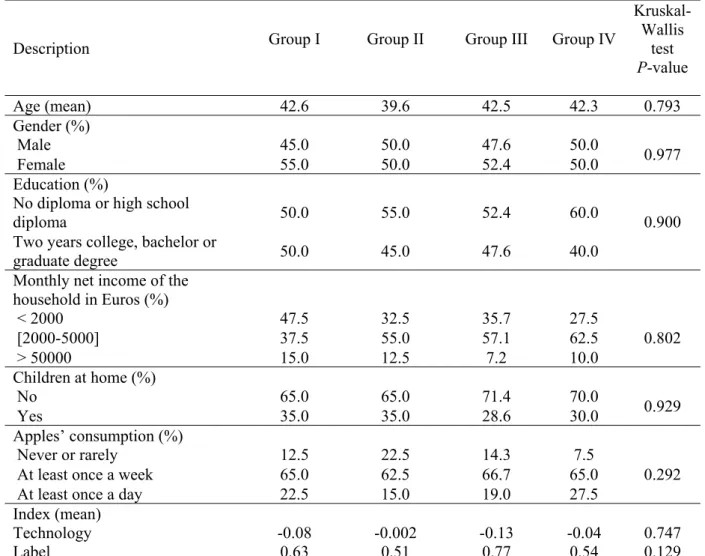
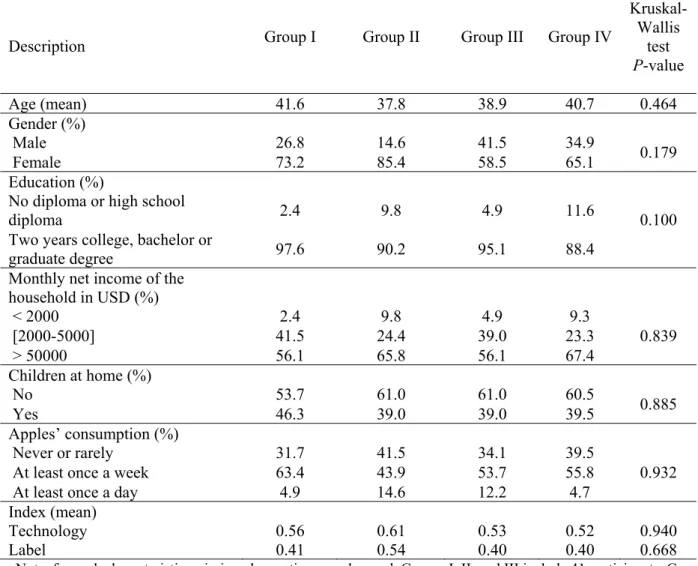
To address differences in the two experiments (kg versus lbs, and dollar vs euro), we first normalize the WTP to a common base in both countries (basis 100), and the empirical analysis is run separately for the French and the US samples. We control for age, gender, education, income, and apple consumption to offset potential bias from sampling issues. Therefore, we are confident these differences will not bias our econometric results. By contrast, what really matters for the robustness of our analysis is the absence of significant differences between groups within each country. Tables B.1 and B.2 in the Appendix B report the statistics on socio-economic characteristics and apple consumption for each country and group. Differences between the groups are tested using the Kruskal-Wallis equality-of-populations rank test. A P-value (against the null hypothesis of no difference) of less than 5% is considered significant. The results in the last column of both tables strongly suggest that the four groups are not significantly different neither in France nor in the US.
2.2 Products
Our experiment focuses on apples. Three facts motivate this choice. First, apples are popular and highly consumed fruits, in both France and the US, and good for health. The per capita consumption of fresh apples is similar in France and the US and reaches 16.3 pounds in France and 16.9 pounds in the US in 2018/2019.6 Many varieties (Fuji, Gala, Pink Lady, Red Delicious, etc.) are available on the market, such that any consumer can easily find a preferred variety satisfying her/his taste. Second, apples are available everywhere, all year
6 See https://www.lesfruitsetlegumesfrais.com/fruits-legumes/fruits-a-pepins/pomme/carte-identite and
long (in supermarkets prepacked and in bulk, in stores selling only organic products, in local fruit and vegetable stores, in neighborhood market and directly at the producer or via direct sale networks). Although some variations are observed across locations and apple varieties, the price segment for apples is not too large and relatively well known by consumers. Third, apples are subject to many innovations in order to extent their preservation, improve their vitamin content, reinforce their taste, etc.
The production and sales of apples made with GE were authorized at the time of the experiment in the US (Arctic® apples), but not in France. The availability and market share of Arctic® apples are extremely limited in the US. They were not available in major Midwest cities at the time of the experiment. Many orchards/middlemen/retailers are only offering conventional fruits and vegetables in the US, which makes the US context close to the French one. In both countries, the consumers’ awareness is limited.
In the absence of products, we elicited hypothetical WTP. Despite the risk of hypothetical and upward biases of WTP, the lab is a practical place for eliciting WTP of well-informed consumers with a tight control of the revealed information.7
2.3 Experimental design and information revealed to participants
At the beginning of the experiment, some initial explanations were read on the objective of the experiment and the forthcoming sequence of elicitations of WTP about a new attribute and ways to obtain it. Participants signed a consent form as well. We insisted on the fact that all their replies were anonymous, since participants were only identified by a number. We mentioned the fact that no product will be sold or given at the end of the experiment. Pictures of products were presented (see Figure B.1 in the Appendix B).8 We asked participants to indicate choices as if they were in a supermarket. We insisted on the absence of “good” or
7 Even if hypothetical WTP are likely to be upward biased, a well-cited study downplays risks of biases for
private good. By comparing hypothetical and non-hypothetical responses, Lusk and Schroeder (2004) showed that marginal WTP for a change in quality/characteristic is, in general, not statistically different across hypothetical and real payment settings.
“bad” replies, but rather on the possibility to freely indicate choices reflecting their preferences.
Figure 1 describes the experiment design and the timeline. Successive rounds of information were revealed to participants, and WTP were elicited after each message. Five rounds of WTP elicitations were organized with successive messages revealed with the notation R for a round R = {1,2,3,4,5}. Round 1 took place with explanations of the weight and the mechanism linked to the multiple-price list used in the experiment. Only “conventional” apples were offered in Round 1. The first round helps participants understand the mechanism and provides a baseline of their intention purchases for the conventional variety. The possibility of zero bids is carefully explained. Both varieties (conventional and new) were presented in the following Rounds 2 to 5. Consequently, each round elicits participants’ WTP for the conventional and the new varieties of apples. The price list provided to participants is revealed before the first WTP elicitation and remains fixed during the rest of the experiment. The same price list is used for both the conventional and new varieties of apples.
<Figure 1 about here>
Rounds 2-5 reveal detailed information about the browning process affecting apples, the traditional hybridization process, the GE and GMO techniques. These messages are based on scientific publications, press releases and reports concerning browning process and technical innovations. The messages are simple but as close as possible to reality because some participants may have prior knowledge of the GE/GMO issue. The design with several consecutive rounds of elicitation present some advantages and limitations. The protocol allows a precise control regarding the revelation of information and its sequence (in Rounds 4 and 5), with a progression in the explanations. However, a potential shortcoming relates to the successive rounds of WTP elicitation. In particular, Kahneman and Knetsch (1992)
underlined the sub-additivity effect, occurring when the sum of the estimated WTP expressed separately for two characteristics is greater than the “unique WTP” elicited for the two characteristics valued together.
We conduct the experiment under four treatments, varying the length and the order of information provided to each group of participants. The sequence of information revealed differs between the four groups. Groups I and III receive detailed information about GE and GMO, while groups II and IV receive concise “short” information. Besides, groups I and II successively receive information about GE and GMO, while groups III and IV successively receive information about GMO and then GE. Information revealed during the experiment is reported in the Appendix A.
Finally, participants fill in an exit questionnaire on socio-economic characteristics, consumption behavior, and perceptions of label and food innovations. Interestingly, in this exit questionnaire, participants were asked about their previous knowledge (e.g., before the experiment) on food innovations and biotechnologies. 66.9% of US participants were aware of these innovations, while the percentage reaches only 46.3% in France. Furthermore, using participants’ answers to questions on labels and innovations in food, we build two indexes, respectively on technology and on labeling. The indexes are centered on the “don’t know” answer, and vary between -1.5 and +1.5, a higher positive value suggesting that the participant is more in favor of innovations and label.9 These two indexes are not significantly correlated, neither in France, nor in the US. Interestingly, these indexes show strong differences between France and the US, especially for technology. The technology index is positive in the US (mean = 0.55 and median = 0.57), while it is negative in France (mean= -0.06 and median = - 0.11). For the label index, the average value is 0.44 in the US (resp. 0.62
9 The technology index takes the answers to 11 questions on attitudes towards food technologies on a scale from
1 (Not at all in favor) to 4 (completely in favor) and 5 (does not know). The label index is based on 2 questions asking the importance of food labelling, using a similar scale. These questions are shown in Appendix C. Completely in favor is mapped to 1.5; rather in favor to 0.5; does not know corresponds to 0; rather not in favor is mapped to -0.5 and not at all in favor to -1.5.
in France), and the median is 0.5 in both countries.
2.4 Mechanism for eliciting WTP
A multiple-price list (payment card) was used for eliciting WTP of consumers for each product (conventional and new). Such list simplifies the task for consumers when evaluating independently two products in several rounds. During each round, participants were asked to choose whether (or not) they will buy the product for prices varying from €1.60 to €3.30 for 1 kg of apples in France and from $0.70 to $2.40 for 1 pound in the US (see Table B.3 in the Appendix B). More precisely for each price, consumers had to check off either “yes”, “no” or “maybe” regarding their purchase intents. Prices were selected because they epitomize a representative range of prices observed in supermarkets at the time of the experiment respectively in France and in the US Midwest.
For each product and for each round of choice R with R = {1,…,5}, the WTP was determined by taking the highest price linked to a choice “yes” (with the following highest price on the paper sheet implying a reply “no” or “maybe”). If one participant only replied “no” or “maybe” to each line, the selected WTP was equal to 0.10 If one participant only replied “yes” to each line, the selected WTP was equal to €3.30 for France and $2.40 for the US. For respondents switching twice at low and high prices, the highest “Yes” was recorded as the WTP for the analysis. In robustness checks below, we investigate the exclusion of these observations with double switches.
Advantages and drawbacks of multiple price lists were reviewed by Andersen et al. (2006). The main advantage of such a list is its simplicity guaranteeing a direct participants’ understanding. The possibility to check off “Maybe” also captures consumers’ hesitation. Conversely, one drawback is the interval response eliciting interval data rather than point estimates for WTP. With our experiment, the 10 cents interval guarantees a sufficient degree
10 The alternative configurations with a value equal to €1.50 for France and $0.60 for the US were also studied.
of precision for the elicited WTP. A second disadvantage mentioned by Andersen et al. (2006) is the framing effect with a psychological bias towards the middle of the multiple-price list for choices made by participants. They controlled for this effect by changing the boundaries of the multiple-price list. In this paper, we did not control this framing effect by changing the boundaries, since we focus on the impact of successive messages revelation. As all methodologies eliciting WTP, the multiple-price list has some limitations, but it is particularly tailored to a protocol insisting on the revelation of new messages.
3. Results
We now turn to results. We first provide descriptive statistics on WTP expressed by consumers and their variations across varieties and rounds of elicitation (section 3.1). We then present our econometric analysis (section 3.2).
3.1 Descriptive analysis
To allow comparisons between the French and the US samples, we transform the WTP expressed by participants in each country currency into a common metric by indexing all individual positive WTP to 100 for Round 1 and the conventional variety (See Lusk, 2011). If participants boycott the product (WTP = 0), the index is set to 0.11
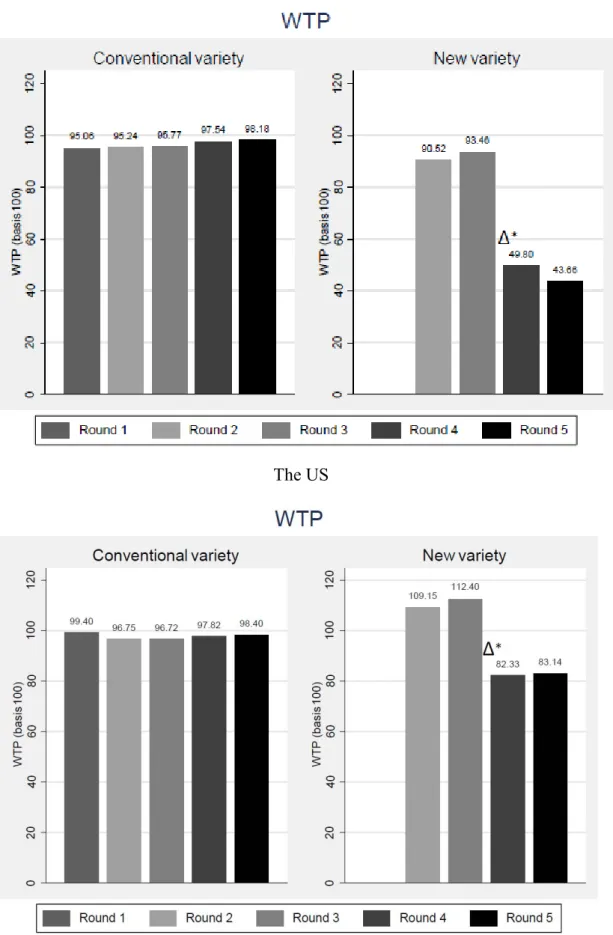
Figure 2.a shows the average WTP over all participants expressed in France and in the US for the conventional and the new varieties. Notable facts are as follows. First, strong variations in the WTP expressed for the new variety are observed in both countries and across rounds (min: 43.7; max: 112.4). Second, US WTP reported for the new variety are always higher than the French ones (min: 43.7 in France and 82.3 in the US). Third, the US WTP expressed for the new variety in Rounds 2 and 3 are higher than those for the conventional variety. The reverse is observed in France. Fourth, French participants strongly reduce their
WTP for the new variety associated with biotechnology in Rounds 4 and 5; in the US, a decrease is also observed, but of smaller magnitude. Fifth, US and French WTP expressed for the conventional variety are similar and very stable across rounds (min: 95.1; max: 99.4). In sum, US consumers value the improved attributes of the apples as long as the innovation is not based on biotechnology tools (GMO or GE). French consumers do not value the novel apple in any circumstances.
Figure 2.b goes one step further and describes the mean WTP and their variations after information revelation expressed by each group of participants in each country for the new variety.12 The left column presents results for France, while the column on the right reports results for the US. In addition, the upper subtitle of each sub-graph indicates the considered group. Recall that the order and length of information received by groups differed. Groups I and II received information first on GE and then on GMO, while groups III and IV obtained information first on GMO and then on GE. Besides, groups II and IV received short messages. By contrast, long messages are delivered to groups I and III.
<Figures 2.a and 2.b about here>
Thus, analyzed horizontally, each column of Figure 2.b highlights the average WTP for the new variety but in each country (France vs. the US) separately, which allows the reader to identify the effect of information on the new variety in each country. Analyzed vertically, each sub-graph of Figure 2.b indicates the average WTP for the new variety for different groups in a given country, which allows the reader to identify the effect of the information sequence (GE first, GMO second, and vice versa) and length (short vs. long messages).
We test for significant differences in WTP with the Wilcoxon (or Mann-Whitney) and
the Kruskal-Wallis equality-of-populations rank tests,13 across groups within each country, for both the conventional (Round 1) and new variety (in Round 2), and find no significant differences at the 5% level. Besides, in each country, we test for the impact of information revelation on WTP by examining variations in the WTP for the new variety and a given group of participants i between Rounds j and j+1 represented by bars in each graph. Significant changes at the 5% level (highlighted by Δ* on the Figures 2.a and 2.b) are observed between Rounds 3 and 4 for groups II, III and IV in both France and the US, and between Rounds 4 and 5 for groups I and II in France only. Information on GE and GMO matters. Two stylized facts are highlighted.
First, the revelation of information about GE- or GMO-based apples (at Rounds 4 and 5) induces a significant decrease in their WTP for the new variety. The magnitude of the decrease is stronger in France than in the US. Furthermore, GE information has a smaller negative impact compared to the one observed for GMO information, especially in France (see the large variations in WTP between Rounds 3 and 4 for groups III and IV, with information on GMO, and smaller variations for groups I and II, receiving information on GE). This stronger discounting of GMO relative to GE can also be seen in the sequence of WTP between Rounds 4 and 5. In both countries, groups I and II decrease their WTP between Rounds 4 and 5 (switch between GE and GMO), while groups III and IV increase their WTP (switch between GMO and GE).
Second, the length of messages does not seem to consistently affect WTP. Short messages have a larger negative influence than long messages, in France. For groups I and III, the average WTP decreases respectively by 28.8% and 51.0% after the long messages respectively on GE and GMO (Round 4), while for groups II and IV the decreases are respectively equal to 33.2% and 61.2% after the short messages respectively on GE and
13 The Kruskal-Wallis test is a multi-sample generalization of the two-sample Wilcoxon test. We also ran a
Dunn test correcting for the inflation of rejection with multiple comparisons using the Bonferoni correction (Dinno, 2015). The latter yielded similar results.
GMO technology (Round 4). All these observations are significant (at the 5% level for groups II, III, and IV, and at the 10% level for group I). A similar conclusion on the differentiated impact of short/long messages is observed for Round 5 (significant at the 5% level for groups I and II but not significant for groups III and IV).
For the US, the conclusion is mixed. Short messages on GE have a stronger negative impact on WTP than long messages (WTP between Rounds 3 and 4 decreases by 22.5% for group I and by 25.1 for group II). The opposite result is not observed for messages related to GMO (the WTP between Rounds 3 and 4 decrease by 41.6% for group III and by only 31.1% for group IV). Variations in WTP observed between Rounds 3 and 4 are significant at the 5% level for groups II, III, and IV, and at the 10% level for group I. None of the variations observed between Rounds 4 and 5 are statistically significant. These results on the length of messages are more muddled in the US econometric estimation once we account for other determinants (see next section).
Figures 2.a and 2.b and B.2 present average values, but these averages hide the strong reactions from some consumers. Our French and US samples include indifferent consumers and boycotters. Indifferent participants are participants with a similar strictly positive WTP for the new variety at the beginning and the end of the experiment, while boycotters are participants with a WTP dropping to zero after information revelation.14 Table 2 suggests that French participants boycott more the new variety than US participants do (42.6% vs. 19.3%). US participants are also more indifferent consumers than French participants are. This result is observed for both varieties, but the gap between France and the US is more pronounced for the new variety (13.0% of indifferent consumers in France vs. 32.5% in the US).
<Table 2 about here>
14 Similar WTP between elicitation rounds are common in experiments, since participants not sensitive to a
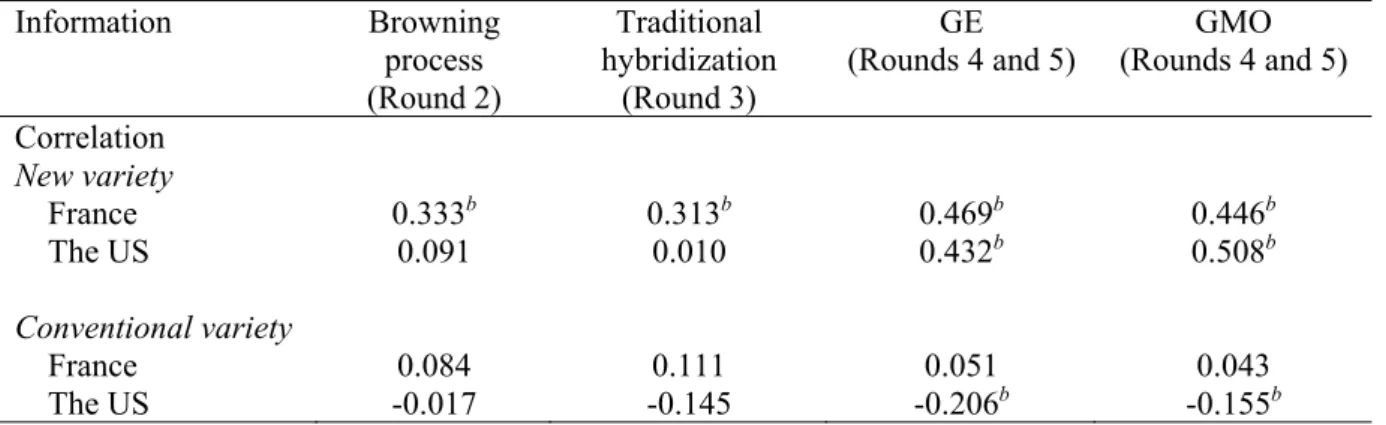
Table B.4. in the Appendix B reports the correlation between the technology index and the WTP expressed by consumers in each country for the new and the conventional varieties after different messages on technologies (browning process, traditional hybridization, GE, and GMO). Results present interesting patterns. First for the new variety, the correlation is positive and significant at the 5% level in each case for France, while in the US, the correlation is positive and significant only after information on GE and GMO. Furthermore, the highest correlation is observed for GE in France and for GMO in the US. Second, for the conventional variety, these correlations are never significant in France. In the US, the correlations are not significant after information on the browning process and the traditional hybridization. By contrast, they are negative and significant after information on GE and GMO.
3.2 Econometric estimation Estimated equation
We now provide more explanations regarding the results obtained in the descriptive analysis and investigate the determinants of WTP. To that end, we regress the WTP in levels (converted in basis 100) expressed by each participant for each variety and round on information and controls. We do not consider the WTP expressed in Round 1 since only the conventional variety was available on the market. More formally using j = C (resp. N) for the conventional (resp. new) variety, our estimated equation is as follows:
' , j Ri Ri i Ri WTP β X (1) where j Ri
WTP represents participant i’s WTP elicited at round R with R={2,3,4,5}.
Vector XRi denotes the vector of explanatory variables, e.g., the information received by
participant i at each round of the experiment. We focus on the type (browning apples process
vs. traditional hybridization vs. GE vs. GMO), length (short vs. long) and order (first vs. second), indicated by dummy variable equal to 1 or 0 depending on the presence or absence
of a characteristic. Our estimation samples for France include 645 observations for the new variety and 643 for the conventional one (162 participants x 4 rounds of elicitation minus few missing observations). The US samples include 664 observations (166 participants x 4 rounds).15
We consider each information element separately, as well as their interactions. The estimation also controls for the socio-economic characteristics of participants and their habits in terms of apples consumption as well as their perceptions about label and food technology (using the indexes previously constructed, see section 2.3). Vector β is the vector of parameters to be estimated, and νi and Ri are the random effects and the error term. All
socio-economic characteristics and apples consumption’s habits are coded using dummy variables, except age, which is treated as a continuous variable.
To perform our estimations, we rely on the random effect Tobit estimator. This estimator allows us to address the issues that may affect our analysis. First, given that each participant i makes multiple choices, there should be some correlation across data points
relating to WTP. Second, WTP cannot be negative and is left-censored at zero. As shown in the Kernel distribution reported in Figure B.3 in the Appendix B, only WTP expressed for the new variety are in practice sorted at the lower bound of 0. Therefore, only the estimations dealing with the new variety control for the lower bound.
Results and discussion
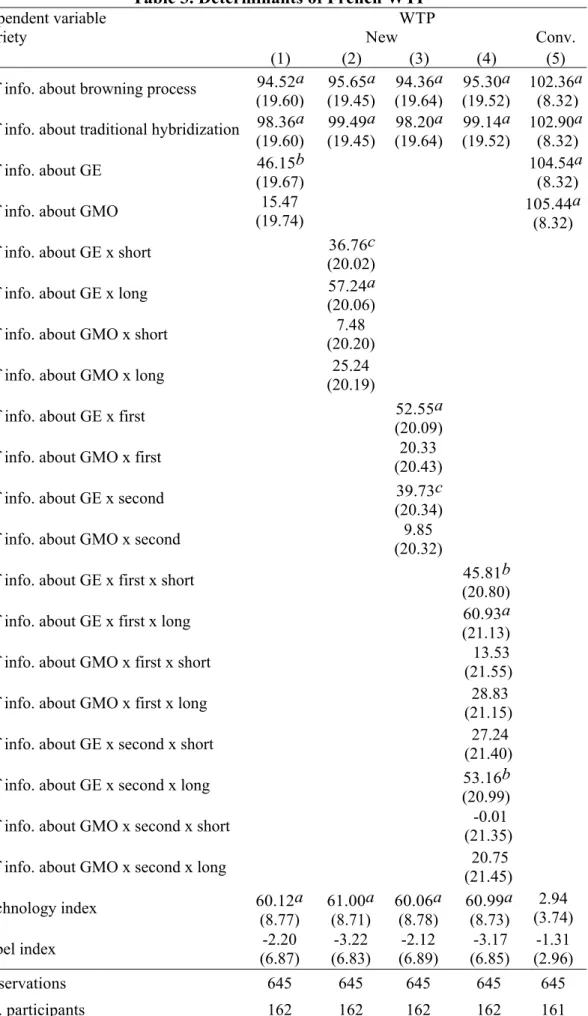
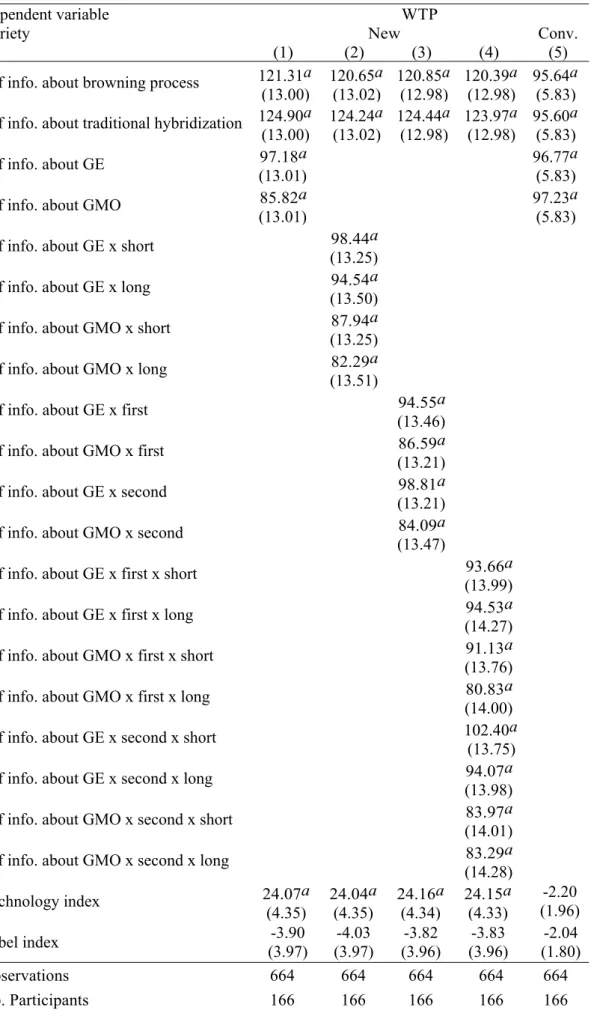
The results are presented in Tables 3 and 4, respectively, for France and the US. Each coefficient can be interpreted as the contribution of each explanatory variable to the normalized and unitless WTP as explained before. The first four columns focus on the new
15A few French (resp. US) participants did not provide their income in the exit questionnaire. We imputed them the mean income observed on the French (resp. US) sample. This imputation does not affect our results: i) Income is never significant in our estimations and ii) we obtain similar results if we remove these observations for our estimations.
variety, while the estimation results on the determinants of WTP for the conventional variety are reported in the last column.
In columns (1) to (3), we first deal with the type of information received about the new apple (about browning process, traditional hybridization, on GE, or on GMO), then with the length of the messages for GE and GMO (short vs. long), and finally the order of the information provided to participants (GE first/second vs. GMO first/second). Column (4) includes interactions between the type of information for GE and GMO, the length and the order of messages. For the estimations in column (5), we just retain the 4 types of information, which is likely to be the main driver of the WTP expressed by participants for the conventional variety.
< Tables 3 and 4 about here>
Our results confirm the influence of information on WTP highlighted in the descriptive statistics. More precisely, we observe that
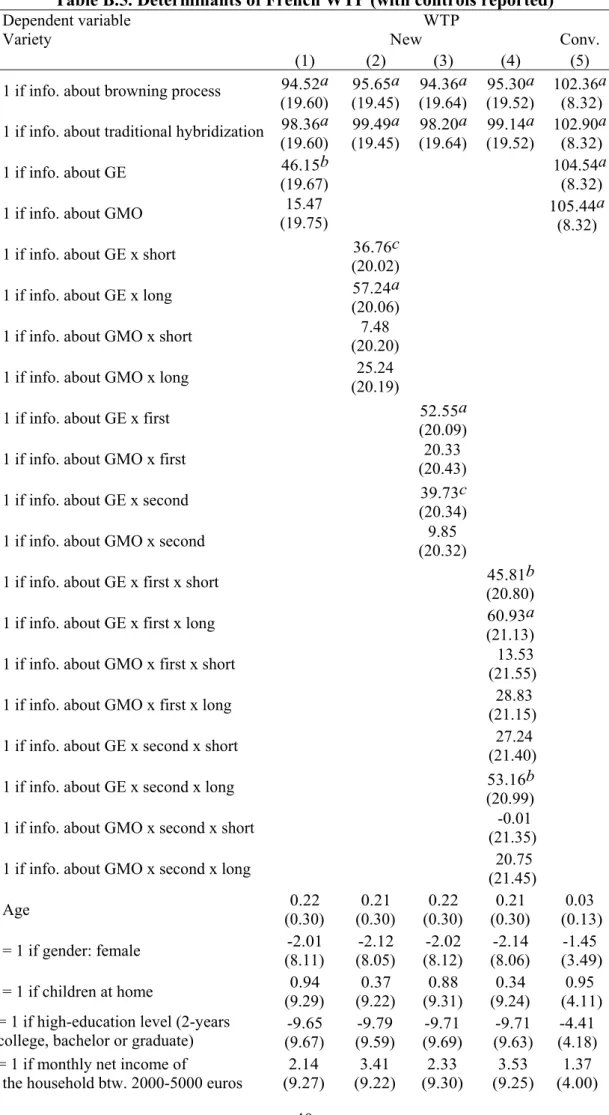
- In France, the new apple is less valued than the conventional apple under the 4 messages. One can observe this by comparing the estimates in columns (1) and (5). For instance, with the information about the browning process, the coefficient is equal to 94.5 in specification (1) for the new product and to 102.4 for the conventional product, indicating the total absence of interest for new apples by French consumers (see Table 3). Further, the discounting of the new apple is clearly observed for GE and GMO messages. GE apples are significantly less discounted than GMO apples (p<0.01), underlining the strong French aversion for GMO.16 Information on traditional hybridization leads to the smallest discounting among the new apples. In the US (see Table 4), consumers value the new apples (with a premium relative to the conventional apple), as long as they are not
16 Note that the estimated parameter for the GMO dummy variable is not significantly different from zero in the
French regression (chi2(1) = 0.61, p>0.4). We also test for its equality with the GE fixed effects. This hypothesis
is strongly rejected (chi2(1) = 26.81; p<0.01). Hence, we can confidently conclude that GMO new apples are
generated using biotech technology. US consumers show a dislike of biotech apples relative to non-biotech apples. GMO apples are the most discounted, followed by the GE apple. However, the discounts are not as steep as they are for French consumers. Traditional hybridization method has the largest WTP among the four WTP for new apples among US consumers.
- Short messages on biotech techniques have a stronger negative impact in France for the new apples relative to the long messages. In the US, the length of messages does not seem to consistently influence the WTP. In specification (2) in Table 4, US consumers seem impatient and have lower WTP under the long message (but the difference between estimates is not significant both for GE and GMO messages). Similarly, in specification (4), the difference between short and long messages when GE is first/second and when GMO is first/second is not significant.
- The order of information (first/second) does not play a significant role in both countries. The difference in the estimates in column 3 (between GE first vs. GE second and between GMO first vs. GMO second) and in column 4 (between GE short first vs. GE short second, GE long first vs. GE long second, GMO short first vs. GMO short second, and GMO long first vs. GMO long second) is never significant at the 5% level.
Regarding socio-economic controls (not reported due to space constraints but presented in Tables B.5 for France and B.6 for the US in the Appendix B), none are significant for France. For the US, only age is negative (p<0.1) for the new apples and positive (p<0.1) for the conventional ones. Besides, a high consumption level of apples has a positive and significant (p<0.05) impact on the WTP expressed for the conventional variety. This quasi-absence of significance for socio-economic controls is consistent with the general findings related to lab experiments in Lusk and Shogren (2007).
estimates on the technology index are positive and significant in both countries and for the new variety. The magnitude is such that, for consumers in favor of food innovations and technologies (e.g., with an index valued at 1 in the range [-1.5, 1.5], it totally offsets the negative effect of the GE message in both countries and through various specifications. For consumers opposed to these innovations (e.g., index at -1), their attitude greatly amplifies the negative effect of biotech messages. Furthermore, the magnitude of the effect is more than twice as large in France compared to the US effect, confirming previous results. Food innovations are a ‘hot topic’ in France; French consumers’ perception of technology drastically drives their WTP. This result is consistent with the findings of Lin et al. (2019) on the openness character trait increasing the WTP for GMO meats. Our results on the perception of technology and innovation hold for both GMO and GE food.
On the other hand, the label index is not significant for the new or conventional variety neither in France nor in the US. This is interesting in the sense that the EU and the US have had trade frictions with labelling requirements on GMO and GMO free products, although consumers do not seem to care about labels in our experiment.
We ran four robustness checks. First, we estimated the model in difference of WTP for the new and conventional apples (namely '
NRi CRi Ri R Ri
WTP WTP X , with notations following to the ones of equation (1)). These regressions are shown in supplemental Tables B.7 and B.8 in the Appendix B with similar qualitative results, although the discounting of the new GMO apples exhibits a larger variance in the US regressions. Some information is lost by using the WTP difference rather than explaining WTP levels.
Second, we ran our estimations pooling US and French data together. Results are qualitatively similar (see supplemental Table B.9). Third, we also reran the estimations excluding participants with double switches, i.e. with a “low yes” (12 participants for France and 3 for the US). Results are reported in Tables B.10 and B.11. Results remain qualitatively
unchanged, except for a small premium emerging for the innovation in Rounds 3 and 4. The strong discounting of GE and GMO apples remains.17 Fourth, we also excluded boycotters from our estimations. Results on the WTP expressed by non-boycotters show strong differences between France and the US (supplemental Tables B.12 and B.13). The estimated coefficient on the browning process is more than twice as large in the US than in France (116 for the US and 51 for France), while the estimated coefficient on the technology index is nearly six times as large in France than in the US (76 for France vs. 13 for the US). Thus, the GE acceptability among non-boycotters is strongly related to consumer attitudes towards food technologies in France but not in the US.
To sum up, our experiment shows a real concern for GE/GMO varieties in both countries, but which runs deeper in France than in the US. Results are particularly strong in the French sample and for GMO. French participants are more alarmed by short messages as well. These results and that on attitudes toward innovations suggest the importance of information policy and science education if one want to make consumers more confident about these innovations, including biotech-based innovations.
4. Conclusion
In the introduction, we asked if GE-based novel foods would be treated as GMO-based food items have been, especially in countries, in which this technology has been highly controversial. Our answer is a carefully qualified “yes”. Consumers in both countries discounted the GMO and GE apples but with a steeper discount for the GMO apples. There is a stigma associated with GE, but it is smaller than for GMO and it varies across consumers and by country. The discounting of both GE and GMO apples is weaker for US consumers
17Differences in results for France between Tables B.10 and 3 are mainly driven by two participants who express a null WTP for the new variety at all rounds.
compared to French consumers. The latter point is in line with the findings of Shew et al. (2018) on CRISPR and GMO rice in four countries including France and the US.
We also asked if information would condition consumer preferences. Again, the answer is a qualified “yes”. French consumers reduce their dislike of both GE and GMO apples when they receive longer messages on the technologies, but not sufficiently to totally offset the discounting of the novel apple. However, US consumers do not seem to react in a systematic way to the length variation of information.
We found that in the US, the revelation of the first message on the consumer benefits of the new apple leads to a positive premium for these new apples compared to the conventional apples. Similarly, the message on new apples obtained from conventional hybridization leads to an increase in WTP. By contrast, French consumers appear skeptical and do not increase their WTP at all for the new apples in the first or second message on new apples.
Caputo et al. (2020) found that, when asked, US consumers tend to have little understanding of what GE is or does, and when provided information, they tend to be more accepting of the technology. Here, we cannot confirm this finding, although the result on the positive impact of attitude towards innovations on the WTP suggests that consumers more in tune with novel food are willing to pay more for these innovations. We also find that on average US consumers are more accepting of innovation and technology than French consumers are.
Our result on the lack of impact from the attitude towards food labels creates potential political tension. The reluctance of consumers towards GE techniques with a related discount for GE foods raises the question of a labeling system informing consumers. Interest groups in both Europe and the US have successfully pushed for mandatory labelling of GMO food. While the voluntary label is unlikely to emerge, a mandatory label system informing about
the type of products (GE/GMO/traditional hybrid) could be a mix blessing, since it could deter GE innovation. Consumers in our experiment did not seem to care in terms of letting their WTP be influenced by their attitudes towards labels. Of course, the information provided in the experiment was an informational substitute to a label. The discounts and premia observed for the new apples could also take place with a label in actual purchase situations. The question of informative labels is still an open question and can be useful in case of crisis.
The World Trade Organization (WTO) Technical Barrier to Trade (TBT) Agreement allows for labelling not related to food safety, for example either to reply to a cultural request or to avoid consumer deception. This latter argument would be a valid reason to impose a label on GE food across borders. GE apples could not be sold as conventional hybrid apples without deceiving consumers. Hence, a label could be justified, if consumers really care about these differences (Heumueller and Josling, 2004), which seems suggested by our results, at least for France (see Table 3).
The lower WTP for biotech apples reveal that a fraction of consumers are “boycotters”, whereas other consumers are indifferent and do not react to the biotech messages. Hence, a potential market exists for these new apples, issued from biotech techniques, but it will be a subset of consumers consuming conventional apples, especially in Europe. We also found that in both countries, the WTP for new apples increases for consumers who exhibit positive attitudes towards innovations in foods, to the point of fully offsetting the discount on GE apples, in both France and the US. As Gaskell et al. (2011) noted about the evolving attitudes of European consumers toward more acceptance of biotechnology, there is qualified optimism regarding the acceptance of GE food with beneficial attributes by a substantial subset of consumers. Educating and providing generic knowledge about the potential of biotech for contributing to sustainable food systems will be
instrumental for the future.
Role of funding source
The authors acknowledge financial support from the Office of the Chief Economist at USDA, the M. Yanney Chair at the University of Nebraska Lincoln, and both projects DIETPLUS ANR-17-CE21-0003 and ANR-17-EURE-0001 funded by the French National Research Agency (ANR).
Declaration of competing interest
The authors declare that they have no known competing financial interests or personal relationships that could have appeared to influence the work reported in this paper.
Acknowledgements
Without implicating them, we thank two anonymous referees and the journal editor for comments on earlier drafts. We thank Françoise Durey, Sylvie Issanchou and Christophe Martin for their help at Dijon, and Janice Larson, Jody Fox, Mike Long, and Christopher Jorgensen for their help at Iowa State University. We also thank Shawn Arita and Fan-Li Chou for discussions.
Author contributions
JB, SM and ACD were involved in questionnaire design and participated in the experiment. SM and JB participated to information collection. ACD performed statistical analyses. JB, SM and ACD drafted the manuscript. All authors read and approved the final version of the submitted manuscript.
Appendixes A, B and C
Supplementary material to this article can be found online.
Availability of data and materials
The datasets used and/or analyzed during the current study are available from the corresponding author.
References
Andersen, S., G. Harrison, M. Lau, and E. Rutström. (2006). “Elicitation Using Multiple Price List Formats.” Experimental Economics 9: 383-405.
Anderson E.J., Md Liakat Ali, W.D. Beavis, P. Chen, T.E. Clemente, et al. (2019). “Soybean [Glycine max (L.) Merr.] Breeding: History, Improvement, Production and Future Opportunities.” In: Al-Khayri J., Jain S., Johnson D. (eds.) Advances in Plant Breeding Strategies: Legumes. Springer, Cham.
Bain, C., S. Lindberg, and T. Selfa. (2019). “Emerging sociotechnical imaginaries for gene edited crops for foods in the United States: implications for governance.” Agriculture and Human Values. https://doi.org/10.1007/s10460-019-09980-9.
Bar-Haim, Y., D. Lamy, L. Pergamin, M.J. Bakermans-Kranenburg, and M.H. van IJzendoorn. (2007). “Threat-related attentional bias in anxious and nonanxious individuals: A meta-analytic study.” Psychological Bulletin 133(1): 1-24.
Bredahl, L. (1999). “Consumers’ Cognitions with Regard to Genetically Modified Foods. Results of a Qualitative Study in Four Countries.” Appetite 33: 343-360.
Bunge, J., and M.A. Dockser. (2018). “Is this tomato engineered? Inside the coming battle over gene-edited food.” Wall Street Journal, 15 April.
https://www.wsj.com/articles/is-this-tomato-engineered-inside-the-coming-battle-over-gene-edited-food-1523814992. Caputo, V., J. Lusk, and V. Kilders. (2020). “Consumer Acceptance of Gene Edited Foods: A
nationwide survey on US consumer beliefs, knowledge, understanding, and willingness to pay for gene-edited foods under different treatments.” FMI Foundation report.
Colson, G., and M.C. Rousu. (2013). “What do consumer surveys and experiments reveal and conceal about consumer preferences for genetically modified foods?” GM Crops & Food
3:158-165.
De Marchi, E., A. Cavaliere, J. Bacenetti, F. Milani, S. Pigliafreddo, and A. Banterle. (2019). “Can consumer food choices contribute to reduce environmental impact? The case of cisgenic apples.” Science of the Total Environment 681: 155-162.
De Marchi, E., A. Cavaliere, and A. Banterle. (2020). “Consumers’ Choice Behavior for Cisgenic Food: Exploring the Role of Time Preferences,” Applied Economic Perspectives and Policy volume 00, number 00, pp. 1–26.doi:10.1002/aepp.13043.
Dinno, A. (2015). “Nonparametric pairwise multiple comparisons in independent groups using Dunn’s test.” The Stata Journal 15(1): 292-300.
Edenbrandt, A.K., C. Gamborg, and B.J. Thorsen. (2018). “Consumers’ Preferences for Bread: Transgenic, Cisgenic, Organic or Pesticide-free?” Journal of Agricultural Economics 69(1): 121-141.
European Court of Justice (ECJ). (2018). Judgement of the Court (Grand Chamber). (Reference for a preliminary ruling — Deliberate release of genetically modified organisms into the environment — Mutagenesis — Directive 2001/18/EC — Articles 2 and 3 — Annexes I A and I B — Concept of ‘genetically modified organism’ — Techniques/methods of genetic modification conventionally used and deemed to be safe — New techniques/methods of mutagenesis — Risks for human health and the environment — Discretion of the Member States when transposing the directive — Directive 2002/53/EC — Common catalogue of varieties of agricultural plant species — Herbicide-tolerant plant varieties — Article 4 — Acceptability of genetically modified varieties obtained by mutagenesis for inclusion in the common catalogue — Human health and environmental protection requirement — Exemption), 25 July 2018.
Gaskell, G., A. Allansdottir, N. Allum, P. Castro, Y. Esmer, C. Fischler, et al. (2011). “The 2010 Eurobarometer on the life sciences.” Nature Biotechnology 29(2), 113–114.
Heumueller, D, and T. Josling. (2004). “Trade Restrictions on Genetically Engineered Foods: The Application of the TBT Agreement.” In: The regulation of agricultural biotechnology edited by R.E. Evenson and V. Santaniello, Cabi Publishing.
Hudson, J., A. Caplanova, and M. Novak. (2015). “Public attitudes to GM foods. The balancing of risks and gains.” Appetite 92: 303-313.
Kahneman, D. and J. Knetsch. (1992). “Valuing public goods: The purchase of moral satisfaction.” Journal of Environmental Economics and Management 22: 57-70.
Keller, K. L. and R. Staelin. (1989). “Assessing biases in measuring decision effectiveness and information overload”. Journal of Consumer Research 15: 504-508.
Kikulwe, E.M. J. Wesseler, and J. Falck-Zepeda. (2011). “Attitudes, perceptions, and trust. Insights from a consumer survey regarding genetically modified banana in Uganda.”
Appetite 57:401-413.
Lin, W., D.L. Ortega, V. Caputo, and J.L. Lusk. (2019). “Personality traits and consumer acceptance of controversial food technology: A cross-country investigation of genetically modified animal products.” Food Quality and Preference 76: 10-19.
Lusk, J.L. (2011). “Consumer preferences for genetically modified food.” pp. 243–262 in
Genetically Modified Food and Global Welfare, C.A. Carter, G.C. Moschini, and I.
Sheldon, eds. Bingley, UK: Emerald Group Publishing.
Lusk, J.L., M. Jamal, L. Kurlander, M. Roucan and L. Taulman. (2005). “A Meta-Analysis of Genetically Modified Food Valuation Studies.” Journal of Agricultural and Resource Economics 30(1): 28-44.
Lusk, J.L., and T.C. Schroeder. (2004). “Are Choice Experiments Incentive Compatible: A Test with Quality Differentiated Beef Steaks.” American Journal of Agricultural Economics 86(2): 467-482.
Lusk, J.L., & J.F. Shogren. (2007). Experimental auctions: Methods and applications in economic and marketing research. Cambridge University Press.
Martin-Laffon, J., M. Kuntz, and A.E. Ricroch. (2019). “Worldwide CRISPR patent landscape shows strong geographical biases.” Nature Biotechnology 37(June): 601-621.
McComas, K.A., J.C. Besley, and J. Steinhardt. (2014). “Factors influencing U.S. consumer support for genetic modification to prevent crop disease.” Appetite 78(C):8-14.
Möhring, N., K. Ingold, P. Kudsk, F. Martin-Laurent, U. Niggli, M. Siegrist, B. Studer, A. Walter, and R. Finger. (2020). “Pathways for advancing pesticide policies.” Nature Food
1(9): 535-540.
Muringai, V., X. Fan., and E. Goddard. (2020). “Canadian consumer acceptance of gene-edited versus genetically modified potatoes: a choice experiment approach.” Canadian Journal of Agricultural Economics 68(1): 47-63.
Engineered Crops: Experiences and Prospects. Washington, DC: The National
Academies Press.
Noussair, C., S. Robin, and B. Ruffieux. (2002). “Do consumers not care about biotech foods or do they just not read the labels?” Economics letters 75(1): 47-53.
Noussair, C., S. Robin, and B. Ruffieux. (2004). “Do consumers really refuse to buy genetically modified food?” The Economic Journal 114(492): 102-120.
Qaim, M. (2020). “Role of New Plant Breeding Technologies for Food Security and Sustainable Agricultural Development.” Applied Economic Perspectives and Policy,
forthcoming. doi:10.1002/aepp.13044.
Rousselière, D., and S. Rousselière (2017). “Is biotechnology (more) acceptable when it enables a reduction in phytosanitary treatments? A European comparison of the acceptability of transgenesis and cisgenesis.” PloS one 12.9.
Rousu, M. C., Huffman, W.E., Shogren, J.F., and A. Tegene. (2007). “Effects and Value of Verifiable Information in a controversial market: Evidence from Lab Auctions of Genetically Modified Food.” Economic Inquiry 45: 409-432.
Sheldon, I.M. (2002). “Regulation of biotechnology: will we ever ‘freely’ trade GMO?”
European Review of Agricultural Economics 29(1):155-176.
Shew, A. M., L.L. Nalley, H.A. Snell, R. Nayga Jr, and B.L. Dixon. (2018). “CRISPR versus GMO: public acceptance and valuation.” Global Food Security 19:71-80.
Wansink B., S. Sonka, and C. Hasler. (2004). “Front-label health claims: When less is more.”
Food Policy 29: 659-667.
Yang, Y. and J.E. Hobbs. (2020). “The Power of Stories: Narratives and Information Framing Effects in Science Communication.” American Journal of Agricultural Economics 102:
1271-1296.
Yunes, M.C., D.L. Teixeira, M.A. von Keyserlingk, and M.J. Hötzel. (2019). “Is gene editing an acceptable alternative to castration in pigs?” PloS one, 14(6): e0218176.
Table 1. Socio-economic characteristics and apples consumption (France and the US) Description France US Age (mean) 41.8 39.8 Gender (%) Male 48.1 29.5 Female 51.9 70.5 Education (%) No diploma or high school diploma 30.3 7.2
Two years college, bachelor or graduate degree
69.8 92.8 Monthly net income of
the household (%) (€ in France) ($ in the US)
< 2000 35.8 6.6 [2000-5000] 53.1 31.9 > 50000 11.1 61.5 Children at home (%) No 67.9 59.0 Yes 32.1 41.0 Apples’ consumption (%) Never or rarely 14.2 36.8
At least once a week 64.8 54.2 At least once a day 21.0 9.0 Index (mean)
Technology -0.06 0.55
Label 0.62 0.44
Note: for each characteristic, missing observations are dropped. French (resp. US) sample includes 162 participants (resp. 166 participants). Technology and label indexes are centered on the ‘do not know’ answer and vary between [-1.5; 1.5].
Table 2. Boycotters and indifferent participants (France and the US)
France (%) US (%)
New Conventional New Conventional
Boycotters WTP2>0 & WTP5 =0 (New) WTP 1>0 & WTP5=0 (Conv.) 42.6 0 19.3 0 Indifferent participants WTP2>0 & WTP2 = WTP5 (New) WTP1>0 & WTP2=WTP5 (Conv.) 13.0 49.4 32.5 59.6
Note: Indifferent participants are participants with a similar strictly positive WTP for the new/conventional variety at the beginning and the end of the experiment. Boycotters are participants with a WTP dropping to zero after information revelation. French (resp. US) sample includes 162 participants (resp. 166 participants).
Table 3. Determinants of French WTP
Dependent variable WTP
Variety New Conv.
(1) (2) (3) (4) (5) 1 if info. about browning process 94.52a
(19.60) 95.65a (19.45) 94.36a (19.64) 95.30a (19.52) 102.36a (8.32) 1 if info. about traditional hybridization 98.36a
(19.60) 99.49a (19.45) 98.20a (19.64) 99.14a (19.52) 102.90a (8.32) 1 if info. about GE 46.15b (19.67) 104.54a (8.32)
1 if info. about GMO (19.74) 15.47 105.44a
(8.32) 1 if info. about GE x short 36.76c
(20.02) 1 if info. about GE x long 57.24a (20.06) 1 if info. about GMO x short 7.48
(20.20) 1 if info. about GMO x long 25.24
(20.19)
1 if info. about GE x first 52.55a
(20.09) 1 if info. about GMO x first 20.33
(20.43) 1 if info. about GE x second 39.73c (20.34) 1 if info. about GMO x second 9.85
(20.32)
1 if info. about GE x first x short 45.81b (20.80) 1 if info. about GE x first x long 60.93a (21.13) 1 if info. about GMO x first x short 13.53 (21.55) 1 if info. about GMO x first x long 28.83
(21.15) 1 if info. about GE x second x short 27.24
(21.40) 1 if info. about GE x second x long 53.16b (20.99) 1 if info. about GMO x second x short -0.01 (21.35) 1 if info. about GMO x second x long 20.75
(21.45)
Technology index 60.12a
(8.77) 61.00a (8.71) 60.06a (8.78) 60.99a (8.73) 2.94 (3.74) Label index -2.20 (6.87) -3.22 (6.83) -2.12 (6.89) -3.17 (6.85) -1.31 (2.96) Observations 645 645 645 645 645 Nb. participants 162 162 162 162 161
Note: The dependent variable is the WTP expressed by French participants at round R with R={2,3,4,5}. These WTP are in levels (basis 100 for Round 1 and conventional variety). Estimations control for the socio-economic characteristics of participants (age, gender, presence of children, education and income) and their level of apples’ consumption. These controls are not significant and
Table 4. Determinants of US WTP
Dependent variable WTP
Variety New Conv.
(1) (2) (3) (4) (5) 1 if info. about browning process 121.31a
(13.00) 120.65a (13.02) 120.85a (12.98) 120.39a (12.98) 95.64a (5.83) 1 if info. about traditional hybridization 124.90a
(13.00) 124.24a (13.02) 124.44a (12.98) 123.97a (12.98) 95.60a (5.83) 1 if info. about GE 97.18a
(13.01)
96.77a (5.83) 1 if info. about GMO 85.82a
(13.01)
97.23a (5.83) 1 if info. about GE x short 98.44a
(13.25) 1 if info. about GE x long 94.54a (13.50) 1 if info. about GMO x short 87.94a (13.25) 1 if info. about GMO x long 82.29a (13.51)
1 if info. about GE x first 94.55a
(13.46) 1 if info. about GMO x first 86.59a (13.21) 1 if info. about GE x second 98.81a (13.21) 1 if info. about GMO x second 84.09a (13.47)
1 if info. about GE x first x short 93.66a (13.99) 1 if info. about GE x first x long 94.53a
(14.27) 1 if info. about GMO x first x short 91.13a (13.76) 1 if info. about GMO x first x long 80.83a (14.00) 1 if info. about GE x second x short 102.40a
(13.75) 1 if info. about GE x second x long 94.07a (13.98) 1 if info. about GMO x second x short 83.97a (14.01) 1 if info. about GMO x second x long 83.29a (14.28)
Technology index 24.07a
(4.35) 24.04a (4.35) 24.16a (4.34) 24.15a (4.33) -2.20 (1.96) Label index -3.90 (3.97) -4.03 (3.97) -3.82 (3.96) -3.83 (3.96) -2.04 (1.80) Observations 664 664 664 664 664 Nb. Participants 166 166 166 166 166
Note: The dependent variable is the WTP expressed by US participants at round R with R={2,3,4,5}. These WTP are in levels (basis 100 for Round 1 and conventional variety). Estimations control for the socio-economic characteristics of participants (age, gender, presence of children, education and income) and their level of apples’ consumption. These controls are not significant (except age which is significant at the 10% level) and not reported here (available in Table B.6 in the Appendix B). Significance level is a=1%.
Figure 2.a. Mean WTP and their variations after information revelation France
The US
Note: WTP are in level (basis 100 for Round 1 and conventional variety). Means are computed over all participants for each round and variety. Δ* denotes significant differences (at the 5% level using the Wilcoxon test) between the WTP expressed in two following rounds.
Figure 2.b. Mean WTP and variations after information revelation for the new variety, by group of participants
Note: WTP are in level (basis 100 for Round 1 and conventional variety). Means are computed over all participants for each group and round. Δ* denotes significant differences (at the 5% level using the Wilcoxon test) between the WTP expressed in two following rounds. The variation in WTP expressed for the new variety between Rounds 3 and 4 is significant for groups II, III and IV both in France and in the US. In addition, for France, the variation in WTP expressed for the new variety between Rounds 4 and 5 is significant for groups I and II.