HAL Id: hal-01806111
https://hal.archives-ouvertes.fr/hal-01806111
Submitted on 27 Oct 2020
HAL is a multi-disciplinary open access
archive for the deposit and dissemination of
sci-entific research documents, whether they are
pub-lished or not. The documents may come from
teaching and research institutions in France or
abroad, or from public or private research centers.
L’archive ouverte pluridisciplinaire HAL, est
destinée au dépôt et à la diffusion de documents
scientifiques de niveau recherche, publiés ou non,
émanant des établissements d’enseignement et de
recherche français ou étrangers, des laboratoires
publics ou privés.
meteorology and air quality of eastern China
W. Tao, J. Liu, G. Ban-Weiss, D. Hauglustaine, L. Zhang, Q. Zhang, Y.
Cheng, Y. Yu, S. Tao
To cite this version:
W. Tao, J. Liu, G. Ban-Weiss, D. Hauglustaine, L. Zhang, et al.. Effects of urban land expansion on the
regional meteorology and air quality of eastern China. Atmospheric Chemistry and Physics, European
Geosciences Union, 2015, 15 (15), pp.8597-8614. �10.5194/acp-15-8597-2015�. �hal-01806111�
www.atmos-chem-phys.net/15/8597/2015/ doi:10.5194/acp-15-8597-2015
© Author(s) 2015. CC Attribution 3.0 License.
Effects of urban land expansion on the regional meteorology and air
quality of eastern China
W. Tao1, J. Liu1, G. A. Ban-Weiss2, D. A. Hauglustaine3, L. Zhang4, Q. Zhang5, Y. Cheng6, Y. Yu7, and S. Tao1 1Laboratory for Earth Surface Processes, College of Urban and Environmental Sciences, Peking University,
Beijing 100871, China
2Sonny Astani Department of Civil and Environmental Engineering, University of Southern California, CA, USA 3Laboratoire des Sciences du Climat et de l’Environnement, UMR8212, CEA-CNRS-UVSQ, Gif-sur-Yvette, France 4Laboratory for Climate and Ocean-Atmosphere Sciences, Department of Atmospheric and Oceanic Sciences,
School of Physics, Peking University, Beijing 100871, China
5Center for Earth System Science, Tsinghua University, Beijing 100084, China 6Chinese Academy of Meteorological Sciences, Beijing, China
7Nanjing Municipal Environmental Monitoring Centre, Nanjing, Jiangsu 210013, China
Correspondence to: J. Liu (jfliu@pku.edu.cn)
Received: 27 January 2015 – Published in Atmos. Chem. Phys. Discuss.: 8 April 2015 Revised: 6 July 2015 – Accepted: 10 July 2015 – Published: 3 August 2015
Abstract. Rapid urbanization throughout eastern China is
imposing an irreversible effect on local climate and air qual-ity. In this paper, we examine the response of a range of meteorological and air quality indicators to urbanization. Our study uses the Weather Research and Forecasting model coupled with chemistry (WRF/Chem) to simulate the cli-mate and air quality impacts of four hypothetical urbaniza-tion scenarios with fixed surface pollutant emissions during the month of July from 2008 to 2012. An improved inte-grated process rate (IPR) analysis scheme is implemented in WRF/Chem to investigate the mechanisms behind the forcing–response relationship at the process level. For all years, as urban land area expands, concentrations of CO, ele-mental carbon (EC), and particulate matter with aerodynamic diameter less than 2.5 microns (PM2.5)tend to decrease near
the surface (below ∼ 500 m), but increase at higher altitudes (1–3 km), resulting in a reduced vertical concentration gra-dient. On the other hand, the O3 burden, averaged over all
newly urbanized grid cells, consistently increases from the surface to a height of about 4 km. Sensitivity tests show that the responses of pollutant concentrations to the spatial ex-tent of urbanization are nearly linear near the surface, but nonlinear at higher altitudes. Over eastern China, each 10 % increase in nearby urban land coverage on average leads to a decrease of approximately 2 % in surface concentrations
for CO, EC, and PM2.5, while for O3 an increase of about
1 % is simulated. At 800 hPa, pollutants’ concentrations tend to increase even more rapidly with an increase in nearby urban land coverage. This indicates that as large tracts of new urban land emerge, the influence of urban expansion on meteorology and air pollution would be significantly am-plified. IPR analysis reveals the contribution of individual atmospheric processes to pollutants’ concentration changes. It indicates that, for primary pollutants, the enhanced sink (source) caused by turbulent mixing and vertical advection in the lower (upper) atmosphere could be a key factor in changes to simulated vertical profiles. The evolution of sec-ondary pollutants is further influenced by the upward reloca-tion of precursors that impact gas-phase chemistry for O3and
aerosol processes for PM2.5. Our study indicates that dense
urbanization has a moderate dilution effect on surface pri-mary airborne contaminants, but may intensify severe haze and ozone pollution if local emissions are not well controlled.
1 Introduction
Urbanization refers to the growth of urban populations and the vast expansion of urban areas. According to the 2011 revision of the United Nations (UN) World Urbanization
Prospects, the global proportion of the population living in urban areas is likely to increase to 68 % (about 6.2 billion) by 2050, and the urban population in less developed regions will almost double from 2.7 billion in 2011 to 5.1 billion in 2050 (Heilig, 2012). The environmental side-effects of urbaniza-tion, such as inadvertent climate modification (Changnon, 1992) and air quality degradation (Mage et al., 1996), remain an important research topic with societal relevance.
The radiative, thermal, hydrologic, and aerodynamic prop-erties of urban land surfaces are distinct from those of natu-ral surfaces (e.g., forests, grassland), resulting in unique ex-change processes of energy, moisture, and momentum with the ambient atmosphere and thus distinct climatic condi-tions in urban areas (Oke, 1987). The features of urban cli-mate (e.g., urban heat island (UHI), wind profiles in the ur-ban canopy layer) have been extensively observed, modeled and comprehensively reviewed (e.g., Arnfield, 2003; Kanda, 2007; Souch and Grimmond, 2006). The urban climate is characterized by multiple scales (Britter and Hanna, 2003; Fisher et al., 2006; Oke, 2006) e.g., flows in the roughness sublayer at micro-scale are not subject to Monin–Obukhov similarity relationships, whereas upper flows in the inertial layer are in equilibrium with the underlying surface, and can be described by mesoscale dynamics. Another feature of urban climatology is, heterogeneity, namely the high non-uniformities of roughness elements (e.g., impervious road, green belt) in urban areas make it rather complicated to gen-eralize the urban flow details from one landscape to another (Fernando et al., 2001). Factors such as anthropogenic heat (Fan and Sailor, 2005), chemistry–climate feedbacks (Rosen-feld, 2000), and topography could alter the characteristics of urban climatic conditions, and the intensity of background wind speed or land-sea breezes could impact the structure of the urban boundary layer (Fisher et al., 2006; Rotach et al., 2002) and the ventilation conditions as well (Ryu et al., 2013; Yoshikado and Tsuchida, 1996).
Up to now, a number of urban canopy schemes have been developed (e.g., Coceal and Belcher, 2004; Di Sabatino et al., 2008; Harman et al., 2004; Luhar et al., 2014; Solazzo et al., 2010; Trusilova et al., 2013; Wang et al., 2011). Among them, four schemes with different complexities have been implemented in the mesoscale meteorological model (e.g., WRF) to account for the effects of urban areas on urban climate, namely bulk (BULK; Liu et al., 2006), a single-layer urban canopy model (SLUCM; Kusaka and Kimura, 2004), building effect parameterization (BEP; Martilli et al., 2002), and a building energy model (coupled to BEP, de-noted as BEP + BEM; Salamanca et al., 2010). The BULK scheme parameterizes the urban surface with greater heat capacity, thermal conductivity, roughness length, and lower albedo than of natural land surfaces, and has been success-fully employed in real-time weather forecasts (Liu et al., 2006). It could capture the features of urban synoptic con-ditions (Liao et al., 2014), and is being widely used for real-time mesoscale weather forecasting over urban areas
(Sala-manca et al., 2011). The last three schemes represent the urban geometry as street canyons with urban surfaces (i.e., walls, roofs, and roads), and the coupled WRF–SLUCM model reportedly has the ability to capture the UHI fea-tures in some megacities (Cui and de Foy, 2012; Lin et al., 2011; Miao et al., 2009). However, application of these urban canopy schemes requires specifying a vast number of urban canopy parameters and initial conditions (Chen et al., 2011), which are usually difficult to accurately configure and may change rapidly in developing countries.
Based on these urban canopy schemes, a series of mod-eling studies have investigated the effects of urban land-use changes on regional climate and air quality. Some key cli-matic effects of urbanization, e.g., an increase in mean sur-face temperature and PBL (planetary boundary layer) height, and decrease in humidity and wind speed, have been cap-tured (e.g., Wang et al., 2012; Wang et al., 2013; Yang et al., 2012; Zhang et al., 2010), which in turn influence the concentrations of pollutants even if the anthropogenic emis-sions are held constant (Civerolo et al., 2007; De Meij et al., 2015; Wang et al., 2009; Yu et al., 2012). For instance, Kal-los et al. (1993) indicated that land surface conditions play an important role in the development of local circulation and planetary boundary layer depth, and could govern the disper-sal, transformation, and eventual removal of airborne pollu-tants. In addition, Ryu et al. (2013) found that the prevailing urban breeze in the afternoon brought O3-rich and biogenic
VOC-rich air masses from surrounding mountainous areas to the high-NOx urban regions, resulting in a very high ozone episode in the Seoul metropolitan area.
To date, the characteristics and intrinsic mechanisms of the forcing exerted by urban land expansion on the atmo-spheric environment, including the burden of both primary and secondary pollutants, are still not well understood, par-ticularly throughout eastern China. Recently, the Chinese government has relaxed its one-child policy to promote the long-term balanced development of the population, and has also launched an ambitious urbanization campaign. There-fore, it is expected that China will undergo continuous ur-ban population growth and rapid urur-ban land expansion in the coming decades. Land-use changes caused by new urban in-frastructure are usually irreversible. If urban land expansion should exert adverse forcing on the ambient environment, mitigation strategies for climate and air quality improvement would be less easily implemented and more costly.
Using WRF/Chem, a mesoscale fully coupled air qual-ity and meteorological model, this study addresses two key questions. (1) How sensitive are the meteorological con-ditions and the spatial distribution of airborne contami-nants to urban land expansion? (2) What are the intrinsic mechanisms and dominant processes that drive urbanization-induced changes in atmospheric chemistry? We describe the methodology and the model in Sect. 2, and evaluate the model results in Sect. 3. In Sect. 4, we present the impact of urban land expansion on the distribution of key atmospheric
species. In Sect. 5, we investigate the individual processes contributing to these changes in atmospheric composition. Conclusions are provided in Sect. 6.
2 Methodology
2.1 Model description and configuration
We use WRF/Chem v3.5 (Grell et al., 2005) to simulate me-teorological fields and atmospheric chemistry in four hypo-thetical urban land surface expansion scenarios in July for the 5 years from 2008 to 2012. We focus on summertime air quality because of the high ozone and other secondary pollutant levels. The modeling framework is constructed on a single domain of 100 × 100 cells with a 10 km horizontal grid spacing, and covers nine provinces in eastern and cen-tral China (Fig. 1). In this study, the physical options include the Lin microphysics scheme (Lin et al., 1983), RRTM long-wave radiation scheme (Mlawer et al., 1997), Goddard short-wave scheme (Kim and Wang, 2011), MM5 M–O surface layer scheme (Chen and Dudhia, 2001), YSU boundary layer scheme (Hong et al., 2006), New Grell cumulus scheme, and Unified Noah land surface model (Chen and Dudhia, 2001). The chemical options include the RADM2 chemical mecha-nism, MADE/SORGAM aerosol scheme, Madronich F-TUV photolysis scheme, and Megan biogenic emission scheme (Guenther et al., 2006). The 1.0◦×1.0◦ NCEP Final Op-erational Global Analysis data (http://rda.ucar.edu/datasets/ ds083.2/) have been processed to provide the meteorolog-ical initial conditions and boundary conditions. We utilize the modified 2008 IGBP (International Geosphere Biosphere Programme) MODIS 20-category 30 s land-use data, which is available from the WRF website (http://www2.mmm.ucar. edu/wrf/users/), to represent current land-cover conditions. Anthropogenic emission data are from the Multi-resolution Emission Inventory for China (MEIC), developed by Ts-inghua University for the year 2010, which consists of the emission rates for each month from five sectors (agriculture, industry, power plants, residential, and transportation). The MEIC is a unit/technology-based, bottom-up emission model that covers ∼ 700 anthropogenic emission source categories in China. It is an update of the emission inventory developed by the same group (Lei et al., 2011; Zhang et al., 2009). We used the MEIC 2010 data of the corresponding months as input for all simulations of 2008 through 2012, ignoring the year-to-year variation in emissions.
Predicted hourly ground level concentrations of CO, O3,
and particulate matter with aerodynamic diameter less than 2.5 microns (PM2.5) are examined against observations
made at five environmental monitoring sites, namely Nanjing Zhonghuamen site (NJ_ZHM, 118.78◦E, 32.01◦N), Nan-jing Xianlin site (NJ_XL, 118.91◦E, 32.11◦N), Hangzhou Jiande site (HZ_JD, 119.28◦E, 29.46◦N), Hangzhou Yuhang site (HZ_YH, 119.99◦E, 30.26◦N) and Shanghai Pudong site
Figure 1. Schematic map of four idealized urban land expansion scenarios (i.e., BASE, GE0.2, GE0.1, and GT0). White denotes non-urban cells, and gray denotes non-urban cells in the BASE run. Other colors represent additional newly urbanized cells in GE0.2 (green), GE0.1 (yellow), and GT0 (orange) compared to previous urban land expansion scenarios. For example, urban cells in GE0.1 are gray, green, and yellow. Black open circles denote the five air quality monitoring sites. Black dashed lines running west–east demarcate the three vertical-zonal cross sections CS1, CS2, and CS3.
(SH_PD, 121.55◦E, 31.22◦N), as shown in Fig. 1. NJ_ZHM and NJ_XL are located in a mixed residential–educational area of Nanjing City, and the observation data (July 2012) are provided by Nanjing Municipal Environmental Monitor-ing Center. As NJ_ZHM and NJ_XL are located very close to each other, and cannot be distinguished at the current model resolution, we average the observation data of these two sites and report this as NJ. Both HZ_JD and HZ_YH are located at high schools in Hangzhou City, and the relevant observa-tion data (April 2008) are from Jiang et al. (2012). SH_PD is located in the urban center of Pudong district, Shanghai, and relevant observation data (September 2012) are from Tie et al. (2013). Extra simulations for April 2008 and Septem-ber 2012 have been conducted for the purpose of model eval-uation. The model performance is assessed by computing four conventional statistical metrics: the correlation coeffi-cient (R), normalized mean bias (NMB), normalized mean error (NME), and index of agreement (I ), which are defined as follows: R = N P i=1 (pi−p)(oi−o) s N P i=1 (pi−p)2· N P i=1 (oi−o)2 (1)
NMB = N P i=1 (pi−oi) N P i=1 oi ×100 % (2) NME = N P i=1 |pi−oi| N P i=1 oi (3) I =1 − N P i=1 (pi−oi)2 N P i=1 (|pi−o| + |oi−o|)2 , (4)
where pi, oi, and N represent model predicted data, observa-tional data, and the number of data pairs, respectively. Equa-tion (4) indicates that I is a positive value no greater than 1, the larger the value of I , the better the model performs, and a value of 1 indicates a perfect match between the model and observations.
2.2 Scenarios of urban land expansion
This work investigates the sensitivity of climatic conditions and atmospheric chemical fields to changes in urban land cover on a regional scale. Four idealized urban land sur-face expansion scenarios are designed within the WRF/Chem modeling framework by modifying certain static geographi-cal parameters. The land-use fraction by category describes the percentage coverage of different land-use categories within a given grid cell, and the land-use index indicates the grid’s dominant land-use category. The BASE run uses the prescribed 2008 IGBP MODIS 20-category land-use data. The GE0.2 run converts all cells with an urban land-use frac-tion of 0.2 or more to urban land-use index. The GE0.1 (ur-ban land-use fraction ≥ 0.1) and GT0 (ur(ur-ban land-use frac-tion > 0) urban expansion scenarios are constructed simi-larly. Note that only the land-use index has been modified since the Noah land surface model considers only land-use index rather than a mosaic of multiple land-use categories with various land-use fractions for the version of WRF/Chem used in this study. Figure 1 shows a schematic map of the four idealized urban land expansion scenarios (i.e., BASE, GE0.2, GE0.1, and GT0). The urban land surface expands exten-sively over the Yangtze River Delta, and most newly urban-ized regions aggregate around the periphery of the original urban districts. Figure S1 (in the Supplement) shows the orig-inal dominant land-use categories of newly urbanized cells in the GT0 run, as well as a contour map of terrain height in the domain of interest. Most new urban areas emerge to replace cropland, whereas few appear in mountainous areas.
2.3 Integrated process rate analysis
In Eulerian grid air quality models such as WRF/Chem and CMAQ, the numerical technique of operator splitting is used to solve the governing equations for species’ concentrations. Operator splitting involves separating the continuity equa-tion for each species into several simpler partial differential equations or ordinary differential equations consisting of one or two individual processes (Gipson, 1999). The technique of integrated process rate (IPR) analysis has been developed to track the accumulated contributions of individual physi-cal and chemiphysi-cal processes to model predictions during run-time. IPR has already been fully implemented in CMAQ, and recent studies have reported its use in investigating a high ozone episode in the Yangtze River Delta (Li et al., 2012) and the Pearl River Delta (Wang et al., 2010), China, as well as the fate of major airborne pollutants in the southeastern US (Yang and Shiang-Yuh, 2013).
However, IPR has not yet been officially adopted in the WRF/Chem modeling framework. Jiang et al. (2012) added a simple process analysis scheme to WRF/Chem to calculate the contribution of photochemical and physical processes to O3 evolution. In this paper, we extend this
work by implementing an improved online IPR scheme in WRF/Chem to track contributions from 10 processes, namely horizontal and vertical advection (ADVH and ADVZ), emis-sions (EMISS), dry deposition (DRYDEP), turbulent dif-fusion (DIFF), convection (CONV), gas-phase chemistry (CHEM), cloud chemistry (CLDCHEM), aerosol processes (AERCHEM), and wet scavenging (WETSCAV). The cal-culation of dry deposition is based on resistance models for gaseous species (Wesely, 1989) and particles (Ackermann et al., 1998). Note Zhang and He (2014) recently devel-oped a new algorithm that linked dry deposition of parti-cles with canopies via leaf area index (LAI), which is not included in the version of WRF/Chem used in this study. Cloud chemistry refers to aqueous-phase processes in dif-ferent types of clouds, and aerosol processes refer to micro-physical nucleation, condensation, and coagulation, as well as the mass transfer between the gas phase and condensed phase. Convection refers to the subgrid convective trans-port and the scavenging within the wet convective updrafts, whereas wet scavenging refers to the both in-cloud rainout and below-cloud washout during large-scale precipitation. In the modal aerosol scheme MADE/SORGAM (Ackermann et al., 1998; Schell et al., 2001), PM2.5 comprises
Aitken-and accumulation-mode particles of sulfate, nitrate, ammo-nium, organic carbon (including SOA), and black carbon. The process contribution is calculated as the difference of the species’ burden in each cell before and after each sim-ulated process. In WRF/Chem, dry deposition is intermin-gled with vertical diffusion, so changes in the column burden during vertical mixing can be attributed to dry deposition. The IPR technique is verified by comparing the changes in species burden with the sum of contributions from the 10
processes mentioned above during each model output inter-val. As shown in Fig. S2, the net contribution of these 10 processes broadly matches the species concentration change.
3 Model evaluation
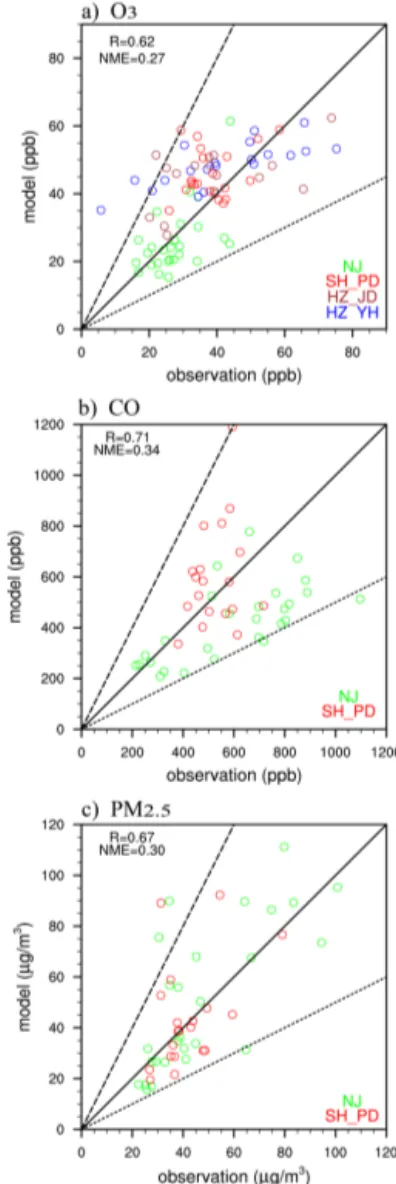
Figure 2 compares simulated versus observed daily mean surface concentrations of O3, CO, and PM2.5 over five
mon-itoring sites: NJ_ZHN (July 2012), NJ_XL (July 2012), SH_PD (September 2009), HZ_YH (April 2008), and HZ_JD (April 2008). The comparison indicates that WRF/Chem is capable of capturing the daily mean concen-trations of surface O3 (R = 0.66; NME = 27 %), CO (R =
0.74; NME = 41 %), and PM2.5 (R = 0.63; NME = 29 %).
Recent evaluation of the ensemble of regional air quality models in the Air Quality Model Evaluation International Initiative (AQMEII) indicated that modeling of PM2.5
suf-fered from too low variability and underestimation (Im et al., 2015; Solazzo et al., 2012). However, in this study the daily mean observed and modeled PM2.5 concentrations in
NJ sites are 47.4 ± 22.7 and 51.3 ± 29.0 µg m−3, while in the
SH_PD site, they are 41.8 ± 12.3 and 44.1 ± 21.0 µg m−3,
re-spectively. Both the mean and daily variability (indicated by the ratio of the standard deviation of the measurements to the standard deviation of the model) of PM2.5concentrations are
overestimated a bit. WRF/Chem generally captures the diur-nal variation of surface O3well, (i.e., R: 0.74, NMB: 6.7 %,
NME: 34.1 %, and I : 0.86). The model also reproduces the hourly surface burden of PM2.5and CO, with NMEs of 63.4
and 52.6 %, respectively. In addition, WRF/Chem captures the monthly mean surface concentrations of O3, CO, and
PM2.5 fairly well (although O3 in SH is over-predicted by
17 % and CO in NJ is under-predicted by 30 %). A number of previous air quality studies have evaluated the performance of WRF/Chem in simulating a range of chemical species (e.g., PM2.5, CO, and O3)over China (Li et al., 2012; Tie
et al., 2007, 2013), and these have reported similar results.
4 Impacts of urban land expansion on regional atmospheric environment
4.1 Urbanization-induced concentration changes
Urban land expansion significantly alters the local synop-tic conditions (see Fig. S3 in the Supplement), e.g., an in-crease in 2 m temperature and boundary layer height, and a decrease in 2 m relative humidity and 10-m wind speed (this could be different for regions where urban land cover replaces forests). Changes in meteorology impact ambient air quality, even when anthropogenic emissions remain con-stant. We focus on the response of two gaseous species (i.e., CO and O3)and two aerosol species (i.e., EC and PM2.5). EC
and CO are used to study how urban land expansion would impact the dispersion and dilution of primary pollutants. EC
Figure 2. Modeled versus observed daily mean surface concentra-tions of (a) O3, (b) CO, and (c) PM2.5at NJ (July 2012), SH_PD
(September 2009), HZ_YH (April 2008), and HZ_JD (April 2008). The solid line indicates the 1 : 1 line; dashed lines indicate the 1 : 2 and 2 : 1 lines.
includes Aitken-mode EC (ECI) and accumulation-mode EC (ECJ), and the aerosol scheme simulates the aging process by converting ECI to ECJ. O3and PM2.5 are used to further
investigate the effects of urban land expansion on secondary pollutants.
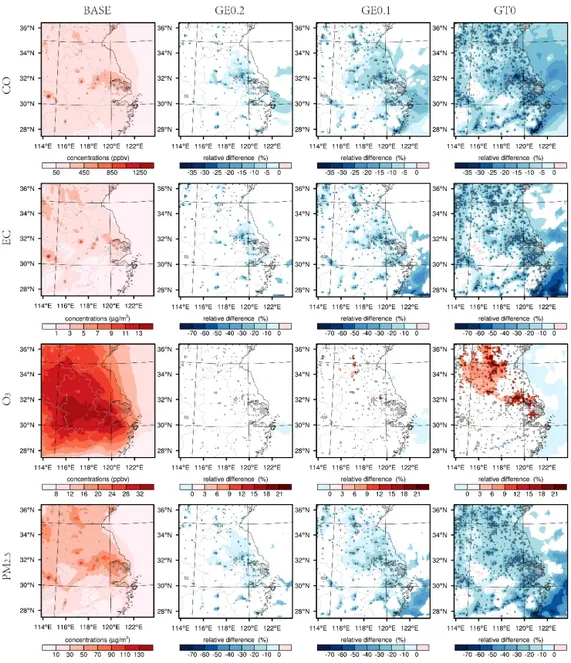
The model surface layer (Fig. 3) and 800 hPa layer (Fig. 4) are selected to study the 5-year mean concentra-tions in July of CO, EC, O3, and PM2.5 in the four
ur-banization scenarios. In the BASE run, high levels of sur-face CO (∼ 850–1250 ppb), EC (∼ 9–13 µg m−3), and PM2.5
(∼ 90–130 µg m−3)are found only in urban areas where an-thropogenic emissions are high. In contrast, terrestrial O3
(∼ 24–32 ppb) is more evenly distributed on the regional scale. At 800 hPa, concentrations of CO (∼ 40–70 ppb), EC (∼ 0.2–0.4 µg m−3), O3 (∼ 24–30 ppb), and PM2.5 (∼ 10–
Figure 3. Five-year mean surface concentrations in July of CO, EC, O3, and PM2.5in the BASE run (left), and the relative difference (only
cells exceeding the 95 % significance level are shown) of each urban land expansion scenario relative to BASE (right three columns). Gray circles indicate urban areas in the BASE run; black crosses indicate newly urbanized cells in GE0.2, GE0.1, and GT0.
20 µg m−3)over the North China Plain appear much higher than those in the southern domain, consistent with the satellite-observed pollution distribution features over this do-main (e.g., Liu et al., 2013). A one-tailed student t test (based on the standard error computed from hourly variability) is used to determine whether the assumed expansion of ur-ban land causes changes in local monthly mean concentra-tions that are significant at the 95 % confidence level. In the surface layer, the change in dominant land-use type to ur-ban generally induces a significant decrease in surface con-centrations of CO (up to −44 %; domain-wide average of
−11 %, or up to 40 ppb decrease in the GT0 run), EC (up to
−80 %; domain-wide average of −21 %, or −0.3 µg m−3in
the GT0 run), and PM2.5(up to −74 %; domain-wide average
of −21 %, or −5.4 µg m−3 in the GT0 run) in all urbaniza-tion scenarios. However, the changes in surface O3are
gen-erally insignificant in GE0.2. Urban land expansion leads to a moderate increase in surface O3(maximum of 22 %;
domain-wide average of 0.3 %, equivalent to 0.1 ppb in the GT0 run) over the northern terrestrial domain in the GE0.1 and GT0 runs. At 800 hPa, the expansion of urban land significantly increases the local concentrations of CO (with a domain-wide average of 16 %, and up to 5.6 ppb in the GT0 run), EC (domain-wide average of 50 %, or ∼ 0.05 µg m−3in the
GT0 run), O3 (domain-wide average of 16 %, or ∼ 2.8 ppb
Figure 4. Same as Fig. 3, but at 800 hPa.
or ∼ 4.3 µg m−3in the GT0 run) in the different urbanization scenarios. The effect of urban land expansion on CO, EC, O3
and PM2.5 concentrations is consistent in each year, albeit
with slight differences in magnitude (not shown).
4.2 Linearity of the urbanization–response relationship over east China
The urbanization–response relationship is a complex func-tion of local synoptic condifunc-tions, large-scale circulafunc-tion, land surface type, the physical and chemical properties of an air-borne contaminant, and its emissions (e.g., release height, frequency, and amount), as well as the time scale being con-sidered. The strength of urban land forcing (e.g., the sensitiv-ity of an atmospheric variable to urban land expansion) can
be quantitatively evaluated as the perturbation of this vari-able from its base condition. Figure 5 shows the response of the 5-year mean concentrations in July of CO, EC, O3,
and PM2.5to changes in domain-wide (i.e., east China) urban
land coverage. At both the surface and 800 hPa, the response curves are nonlinear and the rate of domain-wide concentra-tion changes decreases as more urban land emerges. How-ever, as shown in Figs. 3 and 4, the concentration response is nonuniformly distributed, and becomes stronger when large tracts of new urban land appear. This indicates that the ag-gregation state (further discussed in the next paragraph) of newly urbanized areas would alter the strength of urban land forcing.
The forcing effect of urban land expansion on the spa-tial distribution of air pollutants is not usually limited to
Figure 5. Normalized perturbations (relative to the BASE simula-tion) for three urbanization scenarios of the 5-year mean concentra-tions in July of CO, EC, O3, and PM2.5 at the (a) surface and at
(b) 800 hPa. Values are averaged over land for the entire domain. Corresponding domain-wide land fraction of new urban areas are 3, 6, and 20 %, respectively, relative to BASE.
newly urbanized areas, but has a distance of extended in-fluence. To differentiate the shape of urbanization–response curves at different locations, we use LOCAL to denote these newly urbanized cells, and ADJACENT to represent the non-urbanized cells neighboring LOCAL. We further define an aggregation parameter (Agg) for a given LOCAL cell as the number of the surrounding cells that are also LOCAL; we limit the number of surrounding grid cells for this analysis to 5 × 5–1 or 24 cells (2400 km2). The “local” or “adjacent” forcing is defined as fj = Nj P i=1 VCi VBi Nj , (5)
where f1(i.e., j = 1) denotes local forcing (LF), N1 is the
number of domain-wide LOCAL cells, and VCiand VBi de-note the values of a certain atmospheric variable in cell i of the perturbation run and the BASE run, respectively. f2
de-notes adjacent forcing (AF) over the ADJACENT cells, and
N2is the number of domain-wide ADJACENT cells.
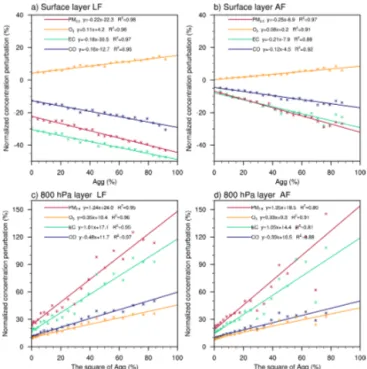
Figure 6 illustrates the LF and AF induced by urban land expansion (i.e., the perturbation of a 5-year mean in July con-centrations of CO, EC, O3, and PM2.5 from the BASE
sit-uation) in all three idealized urbanization scenarios. At the surface, the relationship between LF and Agg is nearly lin-ear. Each 10 % increase in Agg is associated with a 1.6, 1.8, and 2.2 % decrease in LOCAL CO, EC, and PM2.5
concen-trations, respectively, and a 1 % increase in O3
concentra-tions. The AF–Agg curves are similar to those for LF–Agg, but have weaker responses. The linearity can be explained as follows: with increasing Agg, there are more LOCAL cells near a given cell, so the same number of adjacent effects are added to the given cell. At 800 hPa, changes in the contam-inant burden seem to be more sensitive to the aggregation level of newly urbanized cells than at the surface, and par-ticles seem to be more susceptible than gases. The
associ-Figure 6. Relationship between normalized perturbations of 5-year mean July concentrations of CO, EC, O3, and PM2.5 and Agg at
the surface (top), and the square of Agg at 800 hPa (bottom) for the LOCAL forcing (LF, left) and ADJACENT forcing (AF, right). Agg is defined as the occupation rate of the newly urbanized cells to the surrounding 24 (5 × 5 − 1) cells. Linear regression results are also shown.
ated urbanization–response curves become nonlinear. It can be observed that both LF and AF are linearly associated with the square of Agg, which means each 10 % increase in the square of Agg may enhance air pollution concentrations by about 5–10 % at 800 hPa, with the maximum sensitivity for PM2.5 (12 %). This indicates that dense urbanization over
east China may have a moderate dilution effect on surface air pollution, but could intensify pollutants aloft and therefore severe haze (i.e., visibility degradation) and ozone pollution if local emissions are not reduced in the future.
Besides the response of air pollutants, the perturbations in July-mean boundary layer height, 2 m temperature, and 2 m relative humidity also increase linearly with Agg (R2>0.96, shown in Fig. S4 in the Supplement). These results indicate that when large tracts of new urban land emerge, impacts of land-cover change on meteorology and air pollutant concen-trations can be magnified.
Figure 7. Simulated 5-year mean July diurnal cycle of CO, EC, O3,
and PM2.5at the surface, averaged over domain-wide LOCAL cells (solid lines) and ADJACENT cells (dashed lines).
5 Mechanism governing the urbanization–response relationship
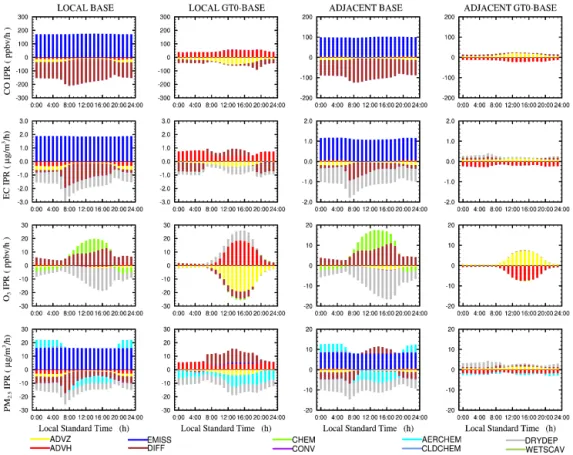
5.1 Process contribution to surface air quality changes
Figure 7 shows the 5-year mean in July diurnal cycles of CO, EC, O3, and PM2.5surface concentrations averaged over
the domain-wide LOCAL cells and the ADJACENT cells. At the surface, CO, EC, and PM2.5 share a diurnal variation
pattern in which concentrations peak at dawn (∼ 05:00 LST) and reach a trough in the late afternoon (∼ 16:00 LST). Con-centrations over LOCAL cells are usually higher than those over the ADJACENT regions, particularly during the night. However, for O3, the opposite diurnal variation pattern can
be observed, and the difference between LOCAL and ADJA-CENT cells is small. Urban land expansion leads to substan-tial changes in species concentrations, but has little effect on the shape of the diurnal cycle. As urban land expands, CO, EC, and PM2.5tend to evolve toward lower burden levels. In
contrast, when averaged over the domain, the increment in surface O3concentrations during most of the day is
insignifi-cant. Though the resulting concentration changes in LOCAL and ADJACENT are quite similar for these four species, the IPR analysis suggests that the underlying mechanisms that drive the forcing–response relationship are different.
Figure 8 illustrates the 5-year mean in July diurnal cy-cles of IPR contributions in the BASE run and their devia-tions in the GT0 run over the domain-wide surface LOCAL cells and ADJACENT cells. The daytime period is chosen as 07:00–18:00 LST, with the rest of the day considered to be nighttime. In the BASE run, emissions are the dominant
source of CO over the LOCAL cells, and the dominant sink is turbulent transport (daytime advection is also a contribut-ing sink). EC follows a similar IPR pattern to CO, except that dry deposition is also a major sink, accounting for about 40 % of the total EC removal. Since this study considers constant CO and EC emissions, diurnal variability in concentrations is dominated by variations in the strength of vertical transport. During the daytime, vertical transport is strong, and CO and EC are depleted at the surface. However, during the night-time, vertical transport becomes weaker, which allows CO and EC to accumulate. The diurnal cycle of IPR for PM2.5
is very similar to that of EC, but aerosol processes play an important role. During the daytime, the source of PM2.5 is
dominated by surface emissions, but the sinks are quite com-plicated, including turbulent diffusion (∼ 41 %), dry deposi-tion (∼ 36 %), and aerosol processes (∼ 23 %). Note that by conducting IPR analyses within CMAQ, Yang and Shiang-Yuh (2013) found that depletion in aerosol processes can act as a sink for PM2.5. At night, the production of PM2.5
through aerosol processes forms 22 % of the source. The IPR diurnal cycle for O3is quite different. During the daytime,
the major sources for surface O3are photochemical
produc-tion (∼ 37 %) and turbulent transport (∼ 63 %), and the sink is overwhelmingly dry deposition. At night, removal of O3
through gas-phase reactions and dry deposition accounts for 40 and 60 % of the sink, respectively. The diurnal cycles of IPR contribution over the ADJACENT cells are similar to those of LOCAL cells, except that vertical diffusion becomes a source for PM2.5during the daytime, compensating for the
strong loss by aerosol processes and dry deposition.
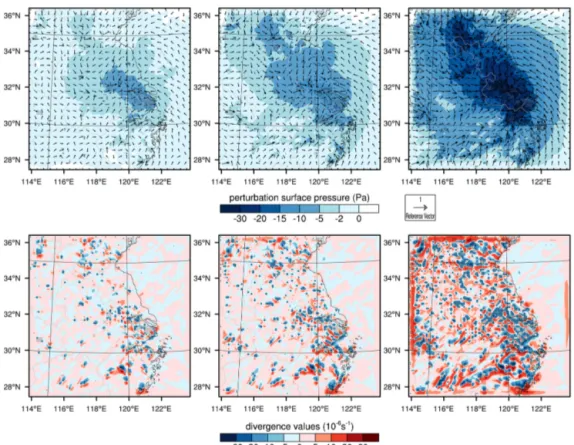
In the GT0 run, as urban land expands, changes in hori-zontal (vertical) advection tend to increase (reduce) the sur-face concentration of all four species over the LOCAL cells, whereas the opposite is true for the ADJACENT cells. The associated surface wind field perturbations due to urban land expansion are shown in Fig. 9. The urban land expansion could strengthen the southeasterly sea breeze over marine domain and near the east seaboard of China, due to the in-creased difference in thermal properties between land and sea (as the urban land is characterized with a greater heat capacity, thermal conductivity, and lower albedo). However, perturbation of wind field in the inner terrestrial is more com-plicated, generally speaking; the replacement of natural land by urban land would reduce the local pressure (up to 30 Pa) and form a cyclonic convergence zone. The divergence of the perturbed wind field can be calculated by a centered fi-nite difference scheme with a one-sided difference boundary. Values of convergence up to −6 × 10⁻⁵s−1can be observed
in most of the newly urbanized areas, similar to the results of Bornstein and Lin (2000), who concluded that UHI would induce a convergence (with a magnitude of −10−5s−1)zone over Atlanta. Figure 10 shows the perturbed wind field in the three vertical–longitudinal cross sections of CS1, CS2, and CS3 mentioned in Fig. 1. The emergence of urban land in-duces local updrafts of ∼ 1 cm s−1, which enhances the
venti-Figure 8. Five-year mean in July diurnal cycles of IPR for surface CO, EC, O3, and PM2.5 concentrations. Values are averaged over all
LOCAL (left two columns) and ADJACENT (right two columns) cells. Results are shown for the BASE simulation and for differences between GT0 and BASE.
lation of primary pollutants to the free troposphere; adjacent downdrafts are also observed. The perturbed wind induced by urban land expansion generally forms convergence zones above the LOCAL cells and divergence zones over the AD-JACENT cells (Fig. 9). Urban heat island circulation (UHIC) is enhanced, which explains the changes in the contribution of advection.
The effects of urban land expansion are not limited to the UHIC-induced advection changes. In the surface layer, the vertical diffusion of CO is intensified over LOCAL cells (es-pecially during the night). EC differs from CO in that the loss due to dry deposition markedly increases over the entire day, while the sink due to diffusion is only reduced during the daytime but is increased at night. The sum of dry de-position and turbulent diffusion reflects the role of vertical mixing in relocating the airborne pollutants vertically. The sink due to the vertical mixing of EC is intensified. It can be concluded that the enhanced advection and turbulent mix-ing in the vertical direction are the key factors in reducmix-ing the surface concentrations of CO and EC. For O3, dry
de-position, vertical diffusion, and daytime photochemical pro-duction and nighttime chemical depletion are all reduced at the surface, resulting in a net weak enhancement of surface O3 averaged over domain-wide LOCAL cells. The dry
de-position of O3is reduced because the canopy resistance
in-creases as vegetation is replaced by urban land; however, the dry deposition of particles is fostered by the intensified surface turbulence. Vertical diffusion is possibly hindered by convergent updrafts caused by UHIC, and the daytime pho-tochemical production and nighttime chemical depletion are reduced because of the decreased abundance of precursors. For PM2.5, daytime loss and nighttime production via aerosol
processes are enhanced and hindered, respectively; this may be because the urbanization-induced decrease in precursor concentrations restrains gas-to-particle mass transfer. At the same time, dry deposition and vertical diffusion are also en-hanced during the daytime. Therefore, the increased sink re-sulting from aerosol processes and dry deposition is the key factor reducing PM2.5concentrations at the surface. Over the
ADJACENT cells, urbanization-induced outward horizontal advection contributes to the lower burden of CO, EC, and PM2.5, and the sink term due to vertical mixing decreases. 5.2 Urbanization-induced process-level vertical profile
changes
Figure 11 shows the 5-year mean in July vertical profile of the four species averaged in the domain-wide LOCAL and ADJACENT cells of the BASE and GT0 runs. In both types of cells, CO, EC, and PM2.5 exhibit similar patterns; as
ur-Figure 9. Five-year mean July perturbations of surface pressure and wind field (top three plots; reference velocity is 1 m s−1)and the divergence of surface wind (bottom three plots) in GE0.2, GE0.1, and GT0 runs. Gray circles indicate the locations of urban cells in the BASE run; black crosses indicate the locations of newly urbanized areas in GE0.2, GE0.1, and GT0 runs.
ban land expands, the atmospheric burden decreases near the surface (below 1 km), but increases at higher altitudes (1– 4 km). On the other hand, the concentration of O3increases
at most heights from the surface to a height of about 4 km. Unlike near the surface, the magnitude of the concentration perturbations aloft (1–4 km) in both grids is commensurate.
Figure 12 illustrates the vertical profile of 5-year mean in July daytime and nighttime IPR contributions for CO, EC, O3, and PM2.5 in the BASE and GT0 runs, averaged over
all LOCAL cells. Convective scavenging generally plays a minor role in removing these four species. For CO and EC, vertical mixing and advection play key roles in constraining the vertical profiles, and the net diffusion is unidirectional from the ground to higher altitudes. The extent of vertical transport during the daytime is higher than that during night-time. The forcing of urban land expansion on the transport of primary pollutants is characterized by UHIC-induced advec-tion changes and enhanced vertical mixing, leading to the de-creased vertical concentration gradient (as shown in Fig. 11). A positive perturbation in the horizontal advection contribu-tion and a negative perturbacontribu-tion in the vertical adveccontribu-tion con-tribution are found in the lower atmosphere (below 500 m), whereas the opposite is true in the upper atmosphere (∼ 0.5– 3 km). For CO and EC (only during nighttime), the enhanced sink and source due to vertical mixing in lower and upper
at-mosphere, respectively, could be the key reasons for changes of vertical profile, and advection appears to compensate and balance this effect. However, for EC above 1 km, as surface dry deposition is strengthened markedly in the daytime, dif-fusion from the lower atmosphere is dampened; this is com-pensated for by the enhanced upward advection.
For O3, advection, vertical mixing, and gas-phase
reac-tions all play important roles in constraining its vertical pro-file. Though UHIC-induced horizontal and vertical advection changes cause the IPR to shift significantly across all layers, net advection is not the key process driving the changes in the vertical O3profile. Near the ground level, the expansion of
urban land fosters upward diffusion and hinders downward diffusion to the surface layer. O3production is determined
by the availability of precursors, which is increased in the 1– 3 km zone by the enhanced uplifting of primary pollutants. The dampened dry deposition and enhanced daytime photo-chemical production (at around 0.5–3 km) are responsible for a higher O3profile.
Besides the transport of precursors, other meteorological factors may also influence O3production. The bottom three
plots in Fig. 10 show the distribution of chemical production (ppb h−1), cloud water, and air temperature differences (GT0 minus BASE during the period 12:00–17:00 LST) in the cross sections of CS1, CS2, and CS3 (defined in Fig. 1). As
Figure 10. Distribution of 5-year mean July perturbations (GT0 minus BASE) of vertical wind velocities (top three plots; reference wind velocity is 1 cm s−1), O3production (color, ppb h−1), cloud water content (black line, mg kg−1), and air temperature (red line, K) during
12:00–17:00 LST (bottom three plots) in CS1, CS2, and CS3. Red and blue dots indicate the longitudes of LOCAL cells in the GT0 run along the cross-section lines and adjacent areas, respectively.
Figure 11. Five-year mean July vertical profiles of CO, EC, O3,
and PM2.5concentrations over the LOCAL cells (black) and
AD-JACENT cells (red) in the BASE (solid lines) and GT0 run (dashed lines). The horizontal dashed lines indicate the height of 800 hPa.
urban land expands, air temperatures increase (up to 1.2◦C) in the lower layers (below 0.5 km), but decrease slightly above 2 km. However, photochemical production of O3is
in-tensified only at altitudes higher than 2 km. This indicates that changes in air temperature may not be the principal fac-tor determining O3production above the PBL. As shown in
Fig. 10, the locations of newly urbanized cells exactly match the zones where photochemical production of O3is reduced
in lower layers, but cloud water content is significantly in-creased above 1 km. Low altitude clouds efficiently scatter shortwave radiation, thus hindering photochemical reactions below clouds; thus, urban land forcing indirectly effects the spatial distribution of O3.
As shown in Fig. 12, aerosol chemistry, vertical mix-ing, and advection all contribute strongly to constraining the PM2.5vertical profile, with wet scavenging and cloud
chem-istry playing relatively minor roles. During the daytime, the contribution of aerosol chemistry is negative near the sur-face, but turns positive at higher altitudes. At night, the con-tribution of aerosol chemistry remains positive in all verti-cal layers. The net vertiverti-cal turbulent transport is upward in the surface layer, but reverses to downward above 0.5 km. Similar to O3, as urban land expands, changes in the
verti-cal profiles of precursors result in enhanced aerosol produc-tion at 0.5–3 km, and enhanced loss below 0.5 km (where the downward diffusion is intensified). The perturbation of dry deposition and aerosol processes largely explains the PM2.5
Figure 12. Five-year mean in July vertical profiles of diurnal (07:00–18:00 LST) and nocturnal (19:00–06:00 LST) IPR for CO, EC, O3, and
PM2.5concentrations in the BASE and GT0 run (top eight figures). The bottom eight plots show the difference in IPR between GT0 and the BASE simulation averaged over domain-wide LOCAL cells.
vertical profile changes. Alike the case for the photochem-ical formation of O3, the formation of PM2.5 through
gas-phase/particle partitioning and cloud chemistry is also in-fluenced by the relocation of humidity, as simulated by the MADE/SORGAM scheme (please refer to the Supplement for details). As shown in Fig. S5 in the Supplement, the production of PM2.5 through cloud chemistry increase
(de-crease) exactly where the humidity increases (decreases). The caveats of this study are as follows. (1) The forcing of urban land expansion on the atmospheric environment is confined to the regional scale. Feedback between mesoscale circulation and large-scale circulation, as well as inflows of airborne pollutants from outside the domain of interest, has been ignored. (2) It is important to note that emissions are as-sumed to remain constant during our study time period. We chose constant emissions to ensure we could tease out the effects of land-cover-induced changes on air quality with-out confounding changes in emissions. Sensitivity experi-ments show that at the surface, the diluting effects of
ur-ban land could be offset, only if the emission augment is high enough for CO (∼ 40 %) and EC (∼ 100 %) in LO-CAL cells (see Figs. S6–S8 in the Supplement for details). (3) The BULK urban canopy scheme used in this work does not resolve the urban morphology, and therefore cannot fur-ther investigate how urban canopy parameters, such as the building height and anthropogenic heat, would impact the cli-matic conditions and air quality. The urbanization–response relationship unveiled in this work could be urban scheme-dependent. In future studies, we will focus on addressing these effects to better quantify the urbanization–response re-lationship, which could provide support to urban planning.
6 Conclusions
We have used an online coupled mesoscale meteorology-chemistry model (WRF/Chem) with BULK urban scheme embodied in Noah land surface model and an improved inte-grated process rate (IPR) analysis scheme to study the effects
of urban land expansion in eastern China on climate and air quality during the month of July. Urban land expansion could significantly alter local synoptic conditions (e.g., increases in 2 m air temperature and boundary layer height and de-creases in 2 m relative humidity). Above the newly urbanized grid cells (referred to as LOCAL cells), horizontal perturba-tions in wind form cyclonic convergence (∼ 10−5s−1)zones, and vertical perturbations in wind lead to updraft flows (∼ 1 cm s−1). This urbanization-induced circulation conse-quently impacts ambient air quality, even when surface emis-sions remain constant. For primary pollutants with strong surface emissions (e.g., CO and EC), urban land expansion causes concentrations to decrease below 500 m but increase significantly between 1 and 3 km. On the other hand, the O3
burden averaged over LOCAL cells consistently increases from the surface to about 4 km. For PM2.5, though its source
includes both primary emissions and secondary formation, the changes in vertical profile caused by urban land expan-sion are consistent with those of CO and EC.
The effects of urban land expansion are not localized, but rather its influence extends to neighboring areas. In this study, the local forcing (LF) was found to be significantly larger than adjacent forcing (AF) at the surface, especially for particulate matter. The aggregation state of newly ur-banized areas plays an important role in determining the strength of LF and AF. We found that perturbations of CO, EC, O3, and PM2.5change linearly with the aggregation
pa-rameter (Agg) at the surface, and with the square of Agg at 800 hPa (R2>0.94). In addition, the perturbations of mean July levels of boundary layer height, 2 m temperature, and 2 m relative humidity increase linearly with Agg (R2>0.96). This result indicates that when large tracts of new urban land emerge, the effects of urban expansion on atmospheric physics and chemistry are magnified.
IPR was utilized to investigate the forcing mechanisms exerted by urban land expansion on the spatial distribution of CO, EC, O3, and PM2.5 over the LOCAL cells. At the
surface, a common feature of all four species is that they are governed by the UHIC effect, whereby horizontal advec-tion causes increases in concentraadvec-tions and vertical advecadvec-tion causes decreases in concentrations. Additionally, when
nat-ural vegetation was replaced by urban land, the sink term from dry deposition increased for particles but decreased for gaseous species. For primary pollutants CO and EC, en-hanced advection and turbulent mixing in the vertical direc-tion are the key factors in reducing the surface concentra-tions. On the other hand, for PM2.5, increased sinks due to
aerosol processes and dry deposition are the key factors in reducing surface concentrations. For O3, the reduced dry
de-position and vertical diffusion, as well as the relocation of precursors, played an important role in constraining the face concentration, resulting in a net enhancement of the sur-face O3averaged over all LOCAL cells.
In contrast to the surface conditions, urban land expansion may induce substantial increases in air pollution at higher al-titudes. The positive contribution of vertical advection and the negative contribution of horizontal advection were found to be important in the build-up of air pollution in the up-per atmosphere (0.5–3 km). For primary pollutants CO and EC (only during nighttime), the enhanced uplifting caused by strengthened turbulent diffusion (induced by urban land ex-pansion) is the key factor leading to higher burdens in the up-per atmosphere. However, in daytime, diffusion of EC from the lower atmosphere is dampened due to intensified dry de-position, which partially counters the concentration increases from enhanced upward advection. However, for secondary species, O3and PM2.5, the relocation of precursors
acceler-ates daytime chemical production in the upper atmosphere, which is the key factor in the higher burden of secondary pollutants at a height of about 1–4 km.
The above analysis has revealed the non-negligible and unique role of urban land forcing in impacting the advection, turbulent mixing, and dry/wet removal of pollutants, and in-dicated that dense urbanization has a moderate dilution effect on surface primary airborne contaminants, but may intensify severe haze and ozone pollution if local emissions are not well controlled. Further studies should simultaneously con-sider changes in both the land use (using a more complicated and advanced urban canopy scheme) and emission to better evaluate the potential environmental influence of any urban-ization campaign.
Appendix A
Table A1. List of acronyms used in this work.
Acronyms Description
LOCAL cells the newly urbanized cells in each urban expansion scenario ADJACENT cells non-urbanized cells neighboring the LOCAL cells ADVH horizontal advection
ADVZ vertical advection
ADV the sum of horizontal and vertical advection
EMISS emissions
DRYDEP dry deposition DIFF turbulent diffusion
VMIX the sum of dry deposition and turbulent diffusion CONV convective transport and scavenging
CHEM gas-phase chemistry CLDCHEM cloud chemistry
AERCHEM aerosol chemical and microphysical process WETSCAV wet scavenging by grid-scale precipitation
The Supplement related to this article is available online at doi:10.5194/acp-15-8597-2015-supplement.
Acknowledgements. We thank three anonymous reviewers for
their thoughtful comments and helpful suggestions. This work was supported by funding from the National Natural Science Foundation of China under awards 41222011, 41390240, and 41130754, the Research Project of the Chinese Ministry of Edu-cation No. 113001A, the “863” Hi-Tech R&D Program of China under grant no. 2012AA063303, and the 111 Project (B14001). Edited by: F. Dentener
References
Ackermann, I. J., Hass, H., Memmesheimer, M., Ebel, A., Binkowski, F. S., and Shankar, U.: Modal aerosol dynamics model for Europe: Development and first applications, Atmos. Environ., 32, 2981–2999, 1998.
Arnfield, A. J.: Two decades of urban climate research: a review of turbulence, exchanges of energy and water, and the urban heat island, Int. J. Climatol., 23, 1–26, 2003.
Britter, R. and Hanna, S.: Flow and dispersion in urban areas, Annu. Rev. Fluid Mech., 35, 469–496, 2003.
Changnon, S. A.: Inadvertent weather modification in urban areas: Lessons for global climate change, B. Am. Meteorol. Soc., 73, 619–627, 1992.
Chen, F. and Dudhia, J.: Coupling an advanced land surface-hydrology model with the Penn State-NCAR MM5 modeling system. Part I: Model implementation and sensitivity, Mon. Weather Rev., 129, 569–585, 2001.
Chen, F., Kusaka, H., Bornstein, R., Ching, J., Grimmond, C. S. B., Grossman-Clarke, S., Loridan, T., Manning, K. W., Martilli, A., Miao, S. G., Sailor, D., Salamanca, F. P., Taha, H., Tewari, M., Wang, X. M., Wyszogrodzki, A. A., and Zhang, C. L.: The inte-grated WRF/urban modelling system: development, evaluation, and applications to urban environmental problems, Int. J. Clima-tol., 31, 273–288, doi:10.1002/joc.2158, 2011.
Civerolo, K., Hogrefe, C., Lynn, B., Rosenthal, J., Ku, J. Y., Solecki, W., Cox, J., Small, C., Rosenzweig, C., Goldberg, R., Knowlton, K., and Kinney, P.: Estimating the effects of increased urbaniza-tion on surface meteorology and ozone concentraurbaniza-tions in the New York City metropolitan region, Atmos. Environ., 41, 1803–1818, doi:10.1016/j.atmosenv.2006.10.076, 2007.
Coceal, O. and Belcher, S.: A canopy model of mean winds through urban areas, Q. J. Roy. Meteor. Soc., 130, 1349–1372, 2004. Cui, Y. Y. and de Foy, B.: Seasonal Variations of the Urban Heat
Island at the Surface and the Near-Surface and Reductions due to Urban Vegetation in Mexico City, J. Appl. Meteorol. Clim., 51, 855–868, doi:10.1175/jamc-d-11-0104.1, 2012.
De Meij, A., Bossioli, E., Penard, C., Vinuesa, J., and Price, I.: The effect of SRTM and Corine Land Cover data on calculated gas and PM10concentrations in WRF-Chem, Atmos. Environ., 101, 177–193, 2015.
Di Sabatino, S., Solazzo, E., Paradisi, P., and Britter, R.: A simple model for spatially-averaged wind profiles within and above an urban canopy, Bound.-Lay. Meteorol., 127, 131–151, 2008. Fan, H. and Sailor, D. J.: Modeling the impacts of anthropogenic
heating on the urban climate of Philadelphia: a comparison of implementations in two PBL schemes, Atmos. Environ., 39, 73– 84, 2005.
Fernando, H., Lee, S., Anderson, J., Princevac, M., Pardyjak, E., and Grossman-Clarke, S.: Urban fluid mechanics: air circulation and contaminant dispersion in cities, Environ. Fluid Mech., 1, 107–164, 2001.
Fisher, B., Kukkonen, J., Piringer, M., Rotach, M. W., and Schatz-mann, M.: Meteorology applied to urban air pollution problems: concepts from COST 715, Atmos. Chem. Phys., 6, 555–564, doi:10.5194/acp-6-555-2006, 2006.
Gipson, G. L.: Science algorithms of the EPA Models-3 community multiscale air quality (CMAQ) modeling system: process analy-sis, 37 pp., 1999.
Grell, G. A., Peckham, S. E., Schmitz, R., McKeen, S. A., Frost, G., Skamarock, W. C., and Eder, B.: Fully coupled “online” chem-istry within the WRF model, Atmos. Environ., 39, 6957–6975, doi:10.1016/j.atmosenv.2005.04.027, 2005.
Guenther, A., Karl, T., Harley, P., Wiedinmyer, C., Palmer, P. I., and Geron, C.: Estimates of global terrestrial isoprene emissions using MEGAN (Model of Emissions of Gases and Aerosols from Nature), Atmos. Chem. Phys., 6, 3181–3210, doi:10.5194/acp-6-3181-2006, 2006.
Harman, I. N., Barlow, J. F., and Belcher, S. E.: Scalar fluxes from urban street canyons part II: model, Bound.-Lay. Meteorol., 113, 387–410, 2004.
Heilig, G. K.: World Urbanization Prospects: The 2011 Revision, United Nations, Washington, D.C., 2012.
Hong, S.-Y., Noh, Y., and Dudhia, J.: A new vertical diffusion pack-age with an explicit treatment of entrainment processes, Mon. Weather Rev., 134, 2318–2341, 2006.
Im, U., Bianconi, R., Solazzo, E., Kioutsioukis, I., Badia, A., Balzarini, A., Baró, R., Bellasio, R., Brunner, D., Chemel, C., Curci, G., Denier van der Gon, H., Flemming, J., Forkel, R., Giordano, L., Jiménez-Guerrero, P., Hirtl, M., Hodzic, A., Hon-zak, L., Jorba, O., Knote, C., Makar, P. A., Manders-Groot, A., Neal, L., Pérez, J. L., Pirovano, G., Pouliot, G., San Jose, R., Savage, N., Schroder, W., Sokhi, R. S., Syrakov, D., Torian, A., Tuccella, P., Wang, K., Werhahn, J., Wolke, R., Zabkar, R., Zhang, Y., Zhang, J., Hogrefe, C., and Galmarini, S.: Evalua-tion of operaEvalua-tional online-coupled regional air quality models over Europe and North America in the context of AQMEII phase 2. Part II: Particulate matter, Atmos. Environ., 115, 421–441, doi:10.1016/j.atmosenv.2014.08.072, 2015.
Jiang, F., Zhou, P., Liu, Q., Wang, T., Zhuang, B., and Wang, X.: Modeling tropospheric ozone formation over East China in springtime, J. Atmos. Chem., 69, 303–319, doi:10.1007/s10874-012-9244-3, 2012.
Kallos, G., Kassomenos, P., and Pielke, R. A.: Synoptic and mesoscale weather conditions during air pollution episodes in Athens, Greece, Bound.-Lay. Meteorol., 62, 163–184, 1993. Kanda, M.: Progress in urban meteorology: A review, J. Meteorol.
Soc. Jpn., 85B, 363–383, 2007.
Kim, H.-J. and Wang, B.: Sensitivity of the WRF model simulation of the East Asian summer monsoon in 1993 to shortwave
radia-tion schemes and ozone absorpradia-tion, Asia-Pac. J. Atmos. Sci., 47, 167–180, 2011.
Kusaka, H. and Kimura, F.: Coupling a single-layer urban canopy model with a simple atmospheric model: Impact on urban heat island simulation for an idealized case, J. Meteorol. Soc. Jpn., 82, 67–80, doi:10.2151/jmsj.82.67, 2004.
Lei, Y., Zhang, Q., He, K. B., and Streets, D. G.: Primary anthro-pogenic aerosol emission trends for China, 1990–2005, Atmos. Chem. Phys., 11, 931–954, doi:10.5194/acp-11-931-2011, 2011. Li, L., Chen, C. H., Huang, C., Huang, H. Y., Zhang, G. F., Wang, Y. J., Wang, H. L., Lou, S. R., Qiao, L. P., Zhou, M., Chen, M. H., Chen, Y. R., Streets, D. G., Fu, J. S., and Jang, C. J.: Process analysis of regional ozone formation over the Yangtze River Delta, China using the Community Multi-scale Air Qual-ity modeling system, Atmos. Chem. Phys., 12, 10971–10987, doi:10.5194/acp-12-10971-2012, 2012.
Liao, J., Wang, T., Wang, X., Xie, M., Jiang, Z., Huang, X., and Zhu, J.: Impacts of different urban canopy schemes in WRF/Chem on regional climate and air quality in Yangtze River Delta, China, Atmos. Res., 145, 226–243, 2014.
Lin, C. Y., Chen, W. C., Chang, P. L., and Sheng, Y. F.: Impact of the Urban Heat Island Effect on Precipitation over a Complex Geographic Environment in Northern Taiwan, J. Appl. Meteorol. Clim„ 50, 339–353, doi:10.1175/2010jamc2504.1, 2011. Lin, Y.-L., Farley, R. D., and Orville, H. D.: Bulk parameterization
of the snow field in a cloud model, J. Clim. Appl. Meteorol., 22, 1065–1092, 1983.
Liu, Y., Chen, F., Warner, T., and Basara, J.: Verification of a Mesoscale Data-Assimilation and Forecasting System for the Oklahoma City Area during the Joint Urban 2003 Field Project, J. Appl. Meteorol. Clim., 45, 912–929, doi:10.1175/jam2383.1, 2006.
Liu, Y., Junfeng, L., and Shu, T.: Interannual Variability of Summer-time Aerosol Optical Depth over east asia During 2000–2011: a Potential Influence from el nino Southern Oscillation, Environ. Res. Lett., 8, 044034, doi:10.1088/1748-9326/8/4/044034, 2013. Luhar, A. K., Thatcher, M., and Hurley, P. J.: Evaluating a building-averaged urban surface scheme in an operational mesoscale model for flow and dispersion, Atmos. Environ., 88, 47–58, 2014.
Mage, D., Ozolins, G., Peterson, P., Webster, A., Orthofer, R., Van-deweerd, V., and Gwynne, M.: Urban air pollution in megacities of the world, Atmos. Environ., 30, 681–686, 1996.
Martilli, A., Clappier, A., and Rotach, M. W.: An urban surface ex-change parameterisation for mesoscale models, Bound.-Lay. Me-teorol., 104, 261–304, doi:10.1023/a:1016099921195, 2002. Miao, S. G., Chen, F., Lemone, M. A., Tewari, M., Li, Q.
C., and Wang, Y. C.: An Observational and Modeling Study of Characteristics of Urban Heat Island and Boundary Layer Structures in Beijing, J. Appl. Meteorol. Clim., 48, 484–501, doi:10.1175/2008jamc1909.1, 2009.
Mlawer, E. J., Taubman, S. J., Brown, P. D., Iacono, M. J., and Clough, S. A.: Radiative transfer for inhomogeneous atmo-spheres: RRTM, a validated correlated – k model for the long-wave, J. Geophys. Res.-Atmos., 102, 16663–16682, 1997. Oke, T. R.: Boundary Layer Climates, 2nd Edn., Routledge,
Lon-don, UK, 1987.
Oke, T. R.: Towards better scientific communication in urban cli-mate, Theor. Appl. Climatol., 84, 179–190, 2006.
Rosenfeld, D.: Suppression of rain and snow by urban and industrial air pollution, Science, 287, 1793–1796, 2000.
Rotach, M. W., Fisher, B., and Piringer, M.: Cost 715 Workshop on Urban Boundary Layer Parameterizations, B. Am. Meteorol. Soc., 83, 1501–1504, doi:10.1175/bams-83-10-1501, 2002. Ryu, Y.-H., Baik, J.-J., Kwak, K.-H., Kim, S., and Moon, N.:
Im-pacts of urban land-surface forcing on ozone air quality in the Seoul metropolitan area, Atmos. Chem. Phys., 13, 2177–2194, doi:10.5194/acp-13-2177-2013, 2013.
Salamanca, F., Krpo, A., Martilli, A., and Clappier, A.: A new build-ing energy model coupled with an urban canopy parameteriza-tion for urban climate simulaparameteriza-tions-part I. formulaparameteriza-tion, verifica-tion, and sensitivity analysis of the model, Theor. Appl. Clima-tol., 99, 331–344, doi:10.1007/s00704-009-0142-9, 2010. Salamanca, F., Martilli, A., Tewari, M., and Chen, F.: A Study
of the Urban Boundary Layer Using Different Urban Pa-rameterizations and High-Resolution Urban Canopy Parame-ters with WRF, J. Appl. Meteorol. Clim., 50, 1107–1128, doi:10.1175/2010jamc2538.1, 2011.
Schell, B., Ackermann, I. J., Hass, H., Binkowski, F. S., and Ebel, A.: Modeling the formation of secondary organic aerosol within a comprehensive air quality model system, J. Geophys. Res.-Atmos., 106, 28275–28293, 2001.
Solazzo, E., Di Sabatino, S., Aquilina, N., Dudek, A., and Britter, R.: Coupling mesoscale modelling with a simple urban model: the Lisbon case study, Bound.-Lay. Meteorol., 137, 441–457, 2010.
Solazzo, E., Bianconi, R., Pirovano, G., Matthias, V., Vautard, R., Moran, M. D., Wyat Appel, K., Bessagnet, B., Brandt, J., Chris-tensen, J. H., Chemel, C., Coll, I., Ferreira, J., Forkel, R., Fran-cis, X. V., Grell, G., Grossi, P., Hansen, A. B., Miranda, A. I., Nopmongcol, U., Prank, M., Sartelet, K. N., Schaap, M., Silver, J. D., Sokhi, R. S., Vira, J., Werhahn, J., Wolke, R., Yarwood, G., Zhang, J., Rao, S. T., and Galmarini, S.: Operational model evaluation for particulate matter in Europe and North Amer-ica in the context of AQMEII, Atmos. Environ., 53, 75–92, doi:10.1016/j.atmosenv.2012.02.045, 2012.
Souch, C. and Grimmond, S.: Applied climatology: urban climate, Prog. Phys. Geogr., 30, 270–279, 2006.
Tie, X., Madronich, S., Li, G., Ying, Z., Zhang, R., Garcia, A. R., Lee-Taylor, J., and Liu, Y.: Characterizations of chemical ox-idants in Mexico City: A regional chemical dynamical model (WRF-Chem) study, Atmos. Environ., 41, 1989–2008, 2007. Tie, X., Geng, F., Guenther, A., Cao, J., Greenberg, J., Zhang, R.,
Apel, E., Li, G., Weinheimer, A., Chen, J., and Cai, C.: Megac-ity impacts on regional ozone formation: observations and WRF-Chem modeling for the MIRAGE-Shanghai field campaign, At-mospheric Chemistry and Physics, 13, 5655-5669, 10.5194/acp-13-5655-2013, 2013.
Trusilova, K., Früh, B., Brienen, S., Walter, A., Masson, V., Pigeon, G., and Becker, P.: Implementation of an Urban Parameteriza-tion Scheme into the Regional Climate Model COSMO-CLM, J. Appl. Meteorol. Clim., 52, 2296–2311, doi:10.1175/JAMC-D-12-0209.1, 2013.
Wang, J., Feng, J., Yan, Z., Hu, Y., and Jia, G.: Nested high-resolution modeling of the impact of urbanization on regional climate in three vast urban agglomerations in China, J. Geophys. Res.-Atmos., 117, D21103, doi:10.1029/2012JD018226, 2012.
Wang, M. N., Zhang, X. Z., and Yan, X. D.: Modeling the climatic effects of urbanization in the Beijing-Tianjin-Hebei metropolitan area, Theor. Appl. Climatol., 113, 377–385, doi:10.1007/s00704-012-0790-z, 2013.
Wang, X., Wu, Z., and Liang, G.: WRF/CHEM modeling of impacts of weather conditions modified by urban expansion on secondary organic aerosol formation over Pearl River Delta, Particuology, 7, 384–391, doi:10.1016/j.partic.2009.04.007, 2009.
Wang, X., Zhang, Y., Hu, Y., Zhou, W., Lu, K., Zhong, L., Zeng, L., Shao, M., Hu, M., and Russell, A. G.: Process analysis and sen-sitivity study of regional ozone formation over the Pearl River Delta, China, during the PRIDE-PRD2004 campaign using the Community Multiscale Air Quality modeling system, Atmos. Chem. Phys., 10, 4423–4437, doi:10.5194/acp-10-4423-2010, 2010.
Wang, Z.-H., Bou-Zeid, E., and Smith, J. A.: A spatially-analytical scheme for surface temperatures and conductive heat fluxes in ur-ban canopy models, Bound.-Lay. Meteorol., 138, 171–193, 2011. Wesely, M.: Parameterization of surface resistances to gaseous dry deposition in regional-scale numerical models, Atmos. Environ., 23, 1293–1304, 1989.
Yang, B., Zhang, Y. C., and Qian, Y.: Simulation of ur-ban climate with high-resolution WRF model: A case study in Nanjing, China, Asia-Pac. J. Atmos. Sci., 48, 227–241, doi:10.1007/s13143-012-0023-5, 2012.
Yang, Z. and Shiang-Yuh, W.: Understanding of the Fate of Atmo-spheric Pollutants Using a Process Analysis Tool in a 3-D Re-gional Air Quality Model at a Fine Grid Scale, Atmos. Clim. Sci., 3, 18–30, doi:10.4236/acs.2013.31004, 2013.
Yoshikado, H. and Tsuchida, M.: High levels of winter air pollution under the influence of the urban heat island along the shore of Tokyo Bay, J. Appl. Meteorol., 35, 1804–1813, doi:10.1175/1520-0450(1996)035<1804:hlowap>2.0.co;2, 1996.
Yu, M., Carmichael, G. R., Zhu, T., and Cheng, Y. F.: Sensitivity of predicted pollutant levels to urbanization in China, Atmos. Env-iron., 60, 544–554, doi:10.1016/j.atmosenv.2012.06.075, 2012. Zhang, L. and He, Z.: Technical Note: An empirical algorithm
esti-mating dry deposition velocity of fine, coarse and giant particles, Atmos. Chem. Phys., 14, 3729–3737, doi:10.5194/acp-14-3729-2014, 2014.
Zhang, N., Gao, Z. Q., Wang, X. M., and Chen, Y.: Modeling the impact of urbanization on the local and regional climate in Yangtze River Delta, China, Theor. Appl. Climatol., 102, 331– 342, doi:10.1007/s00704-010-0263-1, 2010.
Zhang, Q., Streets, D. G., Carmichael, G. R., He, K. B., Huo, H., Kannari, A., Klimont, Z., Park, I. S., Reddy, S., Fu, J. S., Chen, D., Duan, L., Lei, Y., Wang, L. T., and Yao, Z. L.: Asian emis-sions in 2006 for the NASA INTEX-B mission, Atmos. Chem. Phys., 9, 5131–5153, doi:10.5194/acp-9-5131-2009, 2009.