HAL Id: hal-01310344
https://hal-amu.archives-ouvertes.fr/hal-01310344
Submitted on 2 May 2016
HAL is a multi-disciplinary open access
archive for the deposit and dissemination of
sci-entific research documents, whether they are
pub-lished or not. The documents may come from
teaching and research institutions in France or
abroad, or from public or private research centers.
L’archive ouverte pluridisciplinaire HAL, est
destinée au dépôt et à la diffusion de documents
scientifiques de niveau recherche, publiés ou non,
émanant des établissements d’enseignement et de
recherche français ou étrangers, des laboratoires
publics ou privés.
Distributed under a Creative Commons Attribution - NonCommercial - NoDerivatives| 4.0
International License
Interlaboratory Reproducibility of Etest Amphotericin
B and Caspofungin Yeast Susceptibility Testing and
Comparison with the CLSI Method
Stephane Ranque, L Lachaud, M Gari-Toussaint, A Michel-Nguyen, M Mallié,
Jean Gaudart, S Bertout
To cite this version:
Stephane Ranque, L Lachaud, M Gari-Toussaint, A Michel-Nguyen, M Mallié, et al.. Interlaboratory
Reproducibility of Etest Amphotericin B and Caspofungin Yeast Susceptibility Testing and
Compar-ison with the CLSI Method. Journal of Clinical Microbiology, American Society for Microbiology,
2012, �10.1128/JCM.00490-12�. �hal-01310344�
Caspofungin Yeast Susceptibility Testing and Comparison with the
CLSI Method
S. Ranque,aL. Lachaud,bM. Gari-Toussaint,cA. Michel-Nguyen,aM. Mallié,dJ. Gaudart,eand S. Bertoutd
Parasitology and Mycology, CHU Timone, Aix-Marseille Université, Marseille, Francea
; Laboratoire de Parasitologie-Mycologie, Centre Hospitalier Universitaire de Nîmes, Université Montpellier I, Montpellier, Franceb
; Parasitology and Mycology, Archet 2 Hospital, Nice, Francec
; UMI 233 Université Montpellier I/IRD/UCAD/UY1, TransVIHMI, UFR Sciences Pharmaceutiques et Biologiques, Montpellier, Franced
; and Aix-Marseille Université, LERTIM EA 3283, Marseille, Francee
This study aimed to assess the interlaboratory reproducibility at four university hospital laboratories in the southeast region of France of the Etest technique for the determination of caspofungin (CAS) and amphotericin B (AMB) MICs and to compare it to the CLSI broth microdilution reference method. Consecutive clinical yeast isolates (nⴝ 198) were included in the study. AMB and CAS MICs were read at 24 and 48 h. Interlaboratory reproducibility was estimated by using (i) an intraclass correlation coef-ficient (ICC), (ii) essential agreement (EA), and (iii) categorical agreement (CA). For Etest interlaboratory reproducibility for CAS, ICCs were 0.80 (95% confidence interval [CI], 0.76 to 0.84) and 0.81 (95% CI, 0.77 to 0.85) at 24 and 48 h, respectively. For AMB, the ICCs were 0.51 (95% CI, 0.43 to 0.58) and 0.69 (95% CI, 0.63 to 0.74) at 24 and 48 h, respectively. At 48 h, the center EAs ranged from 94.4 to 99.0% for both antifungals. For the comparison of the CLSI method and the Etest, the between-technique ICCs were 0.69 (95% CI, 0.63 to 0.74) and 0.62 (95% CI, 0.55 to 0.68) for CAS and AMB, respectively. The EAs ranged from 76.5 to 98.5% for CAS and from 90.3 to 97.4% for AMB according to the centers. CAs ranged from 87.9% to 91.4%, with four very major errors for 2 strains (1 Candida albicans strain and 1 Candida krusei strain), for CAS and from 97.5 to 99.5%, with four major errors, for AMB. In conclusion, the Etest showed a good interlaboratory reproducibility and a good correlation with the CLSI technique. It is well suited for the routine clinical laboratory and can thus be used to monitor clinical yeast iso-lates’ in vitro susceptibilities in this setting.
S
ince the 1990s, knowledge about the diversity of yeast species involved in human infections, the incidence of drug-resistant isolates, and antifungal drug resistance mechanisms has signifi-cantly increase (6,10,16,24). In vitro susceptibility tests are based on the measurement of growth with different drug concentrations so as to determine the MIC for the population of a given isolate, anin vitro-determined value that helps predict therapeutic efficacy
(1). This has been achieved with some degree of confidence by using in vivo models to determine clinical breakpoints in invasive yeast infections, providing a useful indicator to guide therapeutic choices (20). The reference tests for susceptibility testing are the broth microdilution assays devised by the Clinical and Laboratory Standards Institute (CLSI) and by the European Committee on Antibiotic Susceptibility Testing (EUCAST) (5,23). These refer-ence methods are robust and reproducible; however, they remain time-consuming and poorly suited for the routine clinical labora-tory setting. Moreover, the MIC values for amphotericin B are tightly clustered, and these methods rarely detect MIC values above 1 mg/liter (2). To overcome these limitations, many com-mercially available methods, such as the Etest, Sensititre Yeast-One, or disk diffusion methods, that are easy to use in the routine setting have been developed. These methods have been recently incorporated into routine clinical laboratory practice and thus generate a considerable amount of antifungal MIC data from clin-ical fungal isolates. Presently, the monitoring of antifungal drug susceptibility is usually restricted to national reference laborato-ries that use broth microdilution assays to test clinical isolates referred from collaborating clinical laboratories. These laborato-ries thus collect invaluable data for the monitoring of susceptibil-ity trends on national and international scales. However, there is a
need to develop antifungal susceptibility monitoring at a local or regional scale. This complementary approach to the national ref-erence centers could also improve patient care and generate sig-nificant cost reductions given the prevalence of yeast infections, their morbidity, and the costly protracted treatments required.
As a first step toward setting up a regional survey of in vitro antifungal susceptibility in the southeast region of France, the pri-mary aim of the present study was to assess the interlaboratory reproducibility of MICs determined with the commercially avail-able and routinely used Etest method for yeast isolated in first-line clinical mycology laboratories of the four regional teaching hos-pitals. The secondary aims were to validate the correlation of the MICs of amphotericin B and caspofungin obtained with the Etest and CLSI assays at 24 h and 48 h.
MATERIALS AND METHODS
The study was conducted by the Groupe d’Etude en Mycologie du Sud de la France (GEMSUD), a study group in medical mycology bringing to-gether the parasitology and mycology laboratories of the four teaching hospitals located in the southeast region of France, namely, Marseille, Montpellier, Nice, and Nîmes.
Received 20 February 2012 Returned for modification 13 March 2012 Accepted 25 April 2012
Published ahead of print 2 May 2012
Address correspondence to S. Ranque, stephane.ranque@ap-hm.fr. Copyright © 2012, American Society for Microbiology. All Rights Reserved.
Yeast isolates. From September to November 2008, each participating
laboratory prospectively collected 50 yeast isolates cultured on Sabouraud dextrose agar with antibacterials (gentamicin and chloramphenicol), from distinct consecutive patients. Purity was checked by subculturing on Chromagar Candida medium (Becton Dickinson, France), and the yeast anamorphs were routinely identified by using routine methods. Finally, 200 Candida isolates were collected from different patient samples (Table 1). A total of 118 (59%) isolates were identified as Candida albicans, and 29 (15%) isolates were identified as Candida glabrata.
Antifungal susceptibility methods. The MICs of amphotericin B and
caspofungin were determined by using both the CLSI and Etest assays. The CLSI method was performed in one center (Faculty of Pharmacy, Montpellier), while the Etest was performed in each of the four partici-pating laboratories to determine amphotericin B and caspofungin MICs for the 200 yeasts isolates. The isolates were anonymized by using distinct labels for each center, thus allowing blinding to other centers’ test results. The CLSI assay was performed as recommended previously (3,5). The Etest assay was performed as recommended by the manufacturer (AB Biodisk, Sweden). Each assay was validated by using quality control strains ATCC 22019 (Candida parapsilosis) and ATCC 6258 (Candida
krusei).
Statistical analysis. MIC data are presented as the range, MIC50, and
MIC90for each species.
The interlaboratory reproducibility of the Etest assay was evaluated by calculating the intraclass correlation coefficient (ICC) and its 95% confi-dence interval (CI), which measure the consistency of the MIC values between the centers, as well as the essential agreement (EA) within⫾2 log2
dilutions for both amphotericin B and caspofungin. The MICs were log transformed to approximate a normal distribution. The ICC is a reverse measurement of the variability of a quantitative variable; it has a maxi-mum value of 1 if there is a perfect correlation and a minimaxi-mum value of 0 if there is a complete absence of a correlation. The ICC is the coefficient which has the highest statistical power for correlation studies (14).
The overall agreement between the results of the Etest and the CLSI assays at 48 h was measured by using the ICC and the categorical agree-ment (CA). The interpretative breakpoints used for amphotericin B were susceptible at⬍1 mg/liter and resistant at ⱖ1 mg/liter (2). For caspofun-gin, the new interpretative breakpoints proposed by Pfaller et al. (19) for
C. albicans, C. glabrata, C. tropicalis, C. krusei, C. parapsilosis, and C. guil-liermondii were used for the CLSI method; for other species, and as
rec-ommended by the manufacturer for the Etest method, a 2-mg/liter break-point was used (susceptible atⱕ2 mg/liter and not susceptible at ⬎2 mg/liter) (3). A very major error (VME) occurred when an isolate that was determined to be resistant by the reference CLSI assay was categorized as susceptible by the Etest assay in at least one center. A major error (ME) occurred when an isolate that was determined to be susceptible by the
TABLE 1 Characteristics of the yeast isolates collected in different centers
Isolate characteristic
No. (%) of isolates collected in:
Total no. (%) of isolates collected Marseille Montpellier Nice Nîmes
Species C. albicans 29 (58) 31 (62) 37 (74) 21 (42) 118 (59) C. glabrata 4 (8) 5 (10) 5 (10) 15 (30) 29 (15) C. parapsilosis 6 (12) 4 (8) 0 (0) 6 (12) 16 (8) C. tropicalis 3 (6) 4 (8) 2 (4) 4 (8) 13 (7) C. krusei 3 (6) 3 (6) 3 (6) 1 (2) 10 (5) C. lusitaniae 1 (2) 2 (4) 0 (0) 1 (2) 4 (2) C. kefyr 1 (2) 0 (0) 2 (4) 0 (0) 3 (2) Others 3 (6) 1 (2) 1 (2) 2 (4) 7 (4) C. famata 1 1 C. rugosa 1 1 C. guilliermondii 1 1 C. dublininensis 1 1 C. inconspicua 1 1 C. sake 1 1 C. sphaerica 1 1 Wards Medicine 20 (40) 18 (36) 16 (32) 16 (32) 70 (35) Intensive care 8 (16) 15 (30) 5 (10) 15 (30) 43 (22) Oncology-hematology 9 (18) 2 (4) 11 (22) 4 (8) 26 (13) Surgery 9 (18) 7 (14) 6 (12) 3 (6) 25 (13) Gynecology 0 (0) 2 (4) 4 (8) 7 (14) 13 (7) Infectious diseases 0 (0) 3 (6) 4 (8) 5 (10) 12 (6) Pediatrics 4 (8) 3 (6) 4 (8) 0 (0) 11 (6) Specimens
Lower respiratory tract 30 (60) 16 (32) 20 (40) 5 (10) 71 (36)
Urine 2 (4) 17 (34) 8 (16) 16 (32) 43 (22)
Upper respiratory tract 6 (12) 4 (8) 5 (10) 9 (18) 24 (12)
Stools 4 (8) 3 (6) 7 (14) 6 (12) 20 (10)
Skin 2 (4) 3 (6) 2 (4) 5 (10) 12 (6)
Vaginal 0 (0) 0 (0) 4 (8) 6 (12) 10 (5)
Digestive tract 2 (4) 1 (2) 2 (4) 2 (4) 7 (4)
Normally sterile fluids 1 (2) 3 (6) 2 (4) 1 (2) 7 (4) Tissues (biopsy specimens) 2 (4) 2 (4) 0 (0) 0 (0) 3 (2)
Blood 1 (2) 1 (2) 0 (0) 0 (0) 2 (1)
Ranque et al.
CLSI assay was categorized as resistant by the Etest assay. A minor error (mE) occurred when an isolate that was determined to have intermediate resistance by the CLSI assay was categorized as either sensitive or resistant by the Etest assay. The EA and CA were analyzed at 48 h.
The effect of the yeast species on amphotericin B and caspofungin MICs was tested by using analysis of variance (ANOVA) with Tukey post
hoc tests to control the type I error. Analyses were performed with SPSS
17.0.2 statistical software (SPSS Inc.); all tests were two sided, and a P value of⬍0.05 was considered statistically significant.
RESULTS
Details of hospitalization wards, specimens, and Candida species collected by the different centers are presented inTable 1. Most of the Candida strains were isolated in lower respiratory tract (36%) and urine (22%) specimens from patients hospitalized in medical wards. As expected, Candida albicans was the predominant species (59%). Finally, MIC results for caspofungin and amphotericin B for the four centers could be analyzed for 198 isolates by using both methods. The MIC values of the three quality controls strains were within the expected value for each experiment and both an-tifungals with the Etest and the CLSI method.
Etest interlaboratory reproducibility. Caspofungin MIC
val-ues at 24 h were (i) lower than 0.25 mg/liter for all the C. albicans isolates by both the CLSI and Etest assays in 2 centers and (ii) higher than 0.12 mg/liter for 1 to 10 C. glabrata strains by the Etest assay (depending on the center) and at least 0.25 mg/liter for 13 C.
glabrata strains by the CLSI assay. At 48 h, 10 strains (1 C. albicans,
2 C. glabrata, and 7 C. krusei strains) were categorized as being resistant to caspofungin by at least one method in at least one center. At 48 h, caspofungin MIC50and MIC90values ranged from
0.047 to 0.125 mg/liter and from 0.38 to 0.75 mg/liter, respec-tively, whatever the species (Table 2). For all centers, caspofungin MIC90values wereⱕ1 mg/liter for all species except for Candida
parapsilosis, where the caspofungin MIC50 and MIC90 ranged
from 0.5 to 1 mg/liter and from 0.75 to 1.5 mg/liter, respectively. The overall Etest interlaboratory reproducibility was highly signif-icant (P⬍ 10⫺4) for caspofungin, with ICCs of 0.80 (95% CI, 0.761 to 0.842) and 0.81 (95% CI, 0.771 to 0.846) at 24 and 48 h,
respectively. Noticeably, 24 or 48 h of incubation did not signifi-cantly impact the reproducibility of Etest caspofungin MICs. The 2-by-2 center EA of caspofungin MICs ranged from 95.48% to 98.99%, with a mean EA of 97.06%.
Amphotericin MIC values were ⬎1 mg/liter in at least one center for 3 and 15 Candida isolates at 24 h and 48 h, respectively. MICs of⬎1 mg/liter were reported by more than one center for 4 of these 15 isolates; for the 11 remaining isolates, this MIC of⬎1 mg/liter was a single-center finding. At 48 h, amphotericin MIC50
and MIC90values ranged from 0.125 to 0.25 mg/liter and from
0.38 to 0.75 mg/liter, respectively, whatever the species considered (Table 2). With regard to C. krusei, the mean MIC values by center ranged from 0.75 to 1.85 mg/liter. The overall Etest interlabora-tory reproducibility of amphotericin B testing was relatively lower than that for caspofungin and higher at 48 h than at 24 h, with ICCs of 0.509 (95% CI, 0.433 to 0.584) and 0.687 (95% CI, 0.630 to 0.740) at 24 and 48 h, respectively. The 2-by-2 center EA of amphotericin MICs ranged from 94.42 to 98.99%, with a mean EA of 97.54%.
Comparison of Etest and CLSI results. The
between-tech-nique ICCs were 0.69 (95% CI, 0.63 to 0.74) and 0.62 (95% CI, 0.55 to 0.68) for CAS and AMB, respectively. EAs ranged from 76.5 to 98.5% for CAS and from 90.3 to 97.4% for AMB according to the centers. All isolates were categorized as being susceptible to amphotericin B by both the CLSI and Etest assays at 24 h of incu-bation whatever the center. Hence, the CA was perfect at 24 h and ranged from 97.5 to 99.5%, with four major errors at 48 h, de-pending on the center. The discrepancies are detailed inTable 3, with five major errors corresponding to four isolates (three C.
krusei isolates and one C. parapsilosis isolate) that were categorized
as sensitive by the CLSI method and resistant by the Etest. For caspofungin, the CAs between the Etest and CLSI methods were very similar whatever the center and ranged from 88.38 to 88.88%. Seven very major errors (VME) were observed: one C.
albicans isolate was categorized as being resistant (MIC⫽ 1 mg/
liter) by the CLSI assay and sensitive (MIC⫽ 0.047 or 0.094 mg/ liter) by the Etest method in the four laboratories (Table 4), and TABLE 2 Amphotericin B and caspofungin MIC50s and MIC90s obtained with the CLSI method and the Etest method in the four centers at the 48-h
endpoint reading according to Candida species
Drug and Candida sp.
No. of isolates
MIC value (mg/liter)
CLSI test at 48 h
Etest
Marseille Montpellier Nice Nîmes
MIC range MIC50 MIC90 MIC range MIC50 MIC90 MIC range MIC50 MIC90 MIC range MIC50 MIC90 MIC range MIC50 MIC90
Amphotericin B C. albicans 117 0.125–1 0.25 0.5 0.047–0.25 0.125 0.19 0.047–0.38 0.19 0.25 0.032–1 0.19 0.25 0.047–0.38 0.19 0.25 C. glabrata 28 0.125–1 0.5 1 0.064–0.5 0.25 0.5 0.125–1 0.5 0.75 0.094–1.5 0.38 1 0.125–0.75 0.38 0.5 C. krusei 10 0.5–1 1 1 0.5–1.5 0.75 1 1.5–3 1.5 3 0.064–3 1 2 0.38–2 0.5 1.5 C. parapsilosis 16 0.25–1 0.5 1 0.125–0.75 0.38 0.5 0.25–4 0.5 1 0.064–0.75 0.25 0.75 0.25–1 0.5 1 C. tropicalis 13 0.06–1 1 1 0.094–.38 0.125 0.38 0.094–1.5 0.38 0.75 0.064–0.5 0.19 0.38 0.032–0.5 0.19 0.38 Others 14 0.03–1 0.25 0.5 0.047–0.38 0.125 0.38 0.047–0.5 0.125 0.5 0.016–0.5 0.125 0.38 0.032–0.5 0.125 0.38 All species 198 0.03–1 0.25 1 0.047-1.5 0.125 0.38 0.047–4 0.25 0.75 0.016–3 0.19 0.5 0.032–2 0.19 0.5 Caspofungin C. albicans 117 0.125–1 0.125 0.25 0.016–0.38 0.047 0.094 0.032–1.5 0.094 0.19 0.016–0.38 0.064 0.125 0.016–0.25 0.032 0.064 C. glabrata 28 0.125–0.25 0.25 0.25 0.094–0.38 0.125 0.19 0.094–0.38 0.19 0.25 0.094–0.64 0.125 0.38 0.047–0.25 0.125 0.125 C. krusei 10 0.25–1 0.5 0.5 0.38–0.75 0.5 0.75 0.5–3 0.75 1 0.25–1 0.5 1 0.125–0.75 0.38 0.5 C. parapsilosis 16 0.125–1 0.5 1 0.19–1 0.5 1 0.5–1.5 1 1.5 0.094–0.75 0.38 0.75 0.38–32 0.38 1 C. tropicalis 13 0.125–0.5 0.125 0.4 0.047–0.19 0.064 0.19 0.064–0.38 0.125 0.25 0.064–0.25 0.125 0.19 0.032–0.38 0.094 0.125 Others 14 0.125–0.5 0.25 0.5 0.032–0.5 0.094 0.5 0.064–1.5 0.19 0.5 0.016–1.5 0.125 0.25 0.016–0.5 0.64 0.38 All species 198 0.125–1 0.125 0.5 0.016–1 0.064 0.38 0.032–3 0.125 0.5 0.016–1.5 0.094 0.38 0.016–32 0.047 0.38
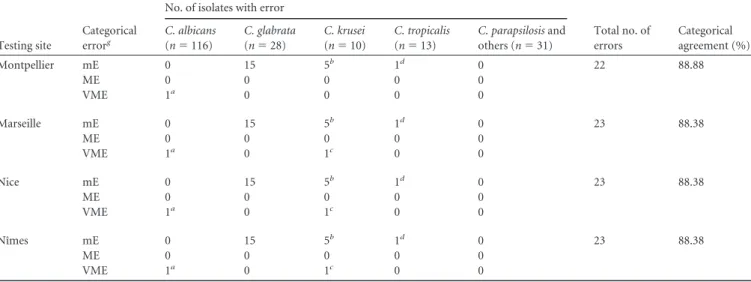
one C. krusei isolate was resistant (MIC⫽ 1 mg/liter) by the CLSI assay and sensitive (MIC⫽ 0.38 mg/liter) by the Etest method in three laboratories. Using the interpretative breakpoints proposed previously by Pfaller (19) for the Etest method, the CA ranged from 87.87 to 91.41%, with three VME (Table 4).
Interspecies MIC differences. Amphotericin B and
caspofun-gin MICs determined by the CLSI method and Etest at 48 h were statistically different with respect to yeast species (P⬍ 10⫺4). Caspofungin MICs could be split into two homogeneous groups by using Tukey post hoc tests. The caspofungin MICs were signif-icantly higher for C. krusei and C. parapsilosis than for the group that included all other yeast species. Amphotericin B MICs could be split into three groups with statistically significantly increasing MIC values: the group (referred to as “others” inTable 2) that included all rarely isolated species with relatively low amphoteri-cin B MICs; the group that included C. albicans, C. glabrata, C.
kefyr, C. parapsilosis, and C. tropicalis; and, lastly, C. krusei species
for which MICs were significantly higher than those for the two
other groups. Indeed, the 10 C. krusei isolates studied displayed relatively elevated MICs for amphotericin B, as shown inTable 2. DISCUSSION
The good interlaboratory reproducibility of the MICs obtained by using Etest yeast antifungal sensitivity testing, as evidenced by our findings, paves the way toward a clinical laboratory-based regional survey of antifungal drug susceptibility. The good interlaboratory reproducibility of Etest susceptibility testing of azoles was estab-lished previously by Matar et al. (12). Our findings for amphoter-icin B Etest susceptibility testing are in line with those reported previously by Pfaller et al. (22). However, this study is the first to report the interlaboratory reproducibility of Etest susceptibility testing of caspofungin. This study’s design had both strengths and limitations. On the one hand, the isolates studied were represen-tative of the routine activity in clinical laboratories of teaching hospitals; on the other hand, the CA analysis was poorly informa-tive, because most of the strains studied had “wild-type” MICs and thus were very seldom classified as resistant. The Etest MICs were also highly correlated to those obtained with the CLSI assay. For the Etest method, we also demonstrated that whatever the break-points considered, the CAs between both methods were very good, and the VME observed in both cases corresponded to the same isolates, one C. albicans isolate and one C. krusei isolate. This excellent correlation between the CLSI and the Etest assays for caspofungin in vitro susceptibility testing was in keeping with that reported previously by others (18). However, this correlation was overall lower for amphotericin B than for caspofungin, in line with data reported previously by Fleck et al. (7), who found 89% and 98% EAs for amphotericin B and caspofungin, respectively. With a different study design and comparing the Etest to the EUCAST broth dilution assay, Dannaoui et al. (4) previously found a 75% TABLE 3 Details of amphotericin B MICs of five isolates that displayed
one major categorical error in at least one center with the Etest or CLSI methoda
Species
MIC (mg/liter) determined by: Etest
CLSI method Montpellier Marseille Nice Nîmes
C. krusei 1.5 1.5 1 0.5 1
C. krusei 2 0.75 2 0.38 1
C. parapsilosis 4 0.25 0.19 0.75 0.5
C. krusei 3 0.75 3 2 1
a
Outlying MICs are underlined.
TABLE 4 Details of categorical agreement errors for caspofungin testing by Etestein each center compared to the CLSI reference method, using new
interpretative breakpoints depending on speciesf
Testing site
Categorical errorg
No. of isolates with error
Total no. of errors Categorical agreement (%) C. albicans (n⫽ 116) C. glabrata (n⫽ 28) C. krusei (n⫽ 10) C. tropicalis (n⫽ 13) C. parapsilosis and others (n⫽ 31) Montpellier mE 0 15 5b 1d 0 22 88.88 ME 0 0 0 0 0 VME 1a 0 0 0 0 Marseille mE 0 15 5b 1d 0 23 88.38 ME 0 0 0 0 0 VME 1a 0 1c 0 0 Nice mE 0 15 5b 1d 0 23 88.38 ME 0 0 0 0 0 VME 1a 0 1c 0 0 Nîmes mE 0 15 5b 1d 0 23 88.38 ME 0 0 0 0 0 VME 1a 0 1c 0 0
aThe same C. albicans isolate in the 4 centers. b
The same C. krusei isolates in the 4 centers.
cThe same C. krusei isolate in 3 centers. d
The same C. tropicalis isolate in the 4 centers.
eConsidered breakpoint of 2 mg/liter. f
See reference19.
gmE, minor error; ME, major error; VME, very major error.
Ranque et al.
EA for both drugs and 77% and 88% CAs for amphotericin B and caspofungin, respectively.
Unsurprisingly, we found elevated MICs of caspofungin for C.
parapsilosis, since it is known that the usually significantly higher
MICs of caspofungin are the consequence of a recently identified functional point mutation in the Fks1 gene of this species (8). Our finding of significantly elevated caspofungin MICs for C. krusei was also in keeping with previous reports by others (17,19). Note-worthy, the MIC50of the 10 C. krusei strains studied encompassed
the newly revised CLSI clinical breakpoints defining caspofungin resistance at an MIC of⬎0.5 mg/liter (19). Furthermore, C. krusei displayed significantly higher MICs of amphotericin B, as evi-denced by the results of the Etest but not the CLSI assay. The discrepancy between the results of these two assays is in keeping with the fact that amphotericin B resistance is more easily detected by the Etest than by broth microdilution techniques (11,21). The emergence of a multidrug resistance profile of C. krusei was re-cently reported (17). Fortunately, this species remains relatively infrequently isolated in the clinical setting (9,13,15).
In conclusion, our findings for amphotericin B and caspofun-gin indicate that Etest susceptibility testing results are reproduc-ible between laboratories and correlate well with the results of the reference broth microdilution CLSI technique. The Etest assay is well suited to the routine clinical laboratory and can thus be used in this setting to monitor the in vitro susceptibilities of clinical yeast isolates. Altogether, these findings strongly support the rel-evance of implementing hospital laboratory-based regional mon-itoring of yeast epidemiology and Etest-based antifungal drug sus-ceptibility.
ACKNOWLEDGMENTS
We thank Philippe Rispail, who collected the yeast isolates in Montpellier, and all laboratory staff who participated in this study.
This work was supported by an unrestricted grant from MSD France.
REFERENCES
1. Arikan S. 2007. Current status of antifungal susceptibility testing meth-ods. Med. Mycol. 45:569 –587.
2. Clinical and Laboratory Standards Institute. 2008. Reference method for broth dilution antifungal susceptibility testing of yeasts: third edition (M27-A3). CLSI, Wayne, PA.
3. Clinical and Laboratory Standards Institute. 2008. Reference method for broth dilution antifungal susceptibility testing of yeasts: third informa-tional supplement (M27-S3). CLSI, Wayne, PA.
4. Dannaoui E, et al. 2010. Comparison of antifungal MICs for yeasts ob-tained using the EUCAST method in a reference laboratory and the Etest in nine different hospital laboratories. Clin. Microbiol. Infect. 16:863– 869.
5. Espinel-Ingroff A, et al. 2005. International and multicenter comparison of EUCAST and CLSI M27-A2 broth microdilution methods for testing susceptibilities of Candida spp. to fluconazole, itraconazole, posacona-zole, and voriconazole. J. Clin. Microbiol. 43:3884 –3889.
6. Fera MT, La Camera E, De Sarro A. 2009. New triazoles and echinocan-dins: mode of action, in vitro activity and mechanisms of resistance. Ex-pert Rev. Anti Infect. Ther. 7:981–998.
7. Fleck R, Dietz A, Hof H. 2007. In vitro susceptibility of Candida species to five antifungal agents in a German university hospital assessed by the reference broth microdilution method and Etest. J. Antimicrob. Che-mother. 59:767–771.
8. Garcia-Effron G, Katiyar SK, Park S, Edlind TD, Perlin DS. 2008. A naturally occurring proline-to-alanine amino acid change in Fks1p in Candida parapsilosis, Candida orthopsilosis, and Candida metapsilosis accounts for reduced echinocandin susceptibility. Antimicrob. Agents Chemother. 52:2305–2312.
9. Gonzalez GM, Elizondo M, Ayala J. 2008. Trends in species distribution and susceptibility of bloodstream isolates of Candida collected in Monter-rey, Mexico, to seven antifungal agents: results of a 3-year (2004 to 2007) surveillance study. J. Clin. Microbiol. 46:2902–2905.
10. Hope WW, Drusano GL. 2009. Antifungal pharmacokinetics and phar-macodynamics: bridging from the bench to bedside. Clin. Microbiol. In-fect. 15:602– 612.
11. Krogh-Madsen M, Arendrup MC, Heslet L, Knudsen JD. 2006. Am-photericin B and caspofungin resistance in Candida glabrata isolates re-covered from a critically ill patient. Clin. Infect. Dis. 42:938 –944. 12. Matar MJ, et al. 2003. Correlation between E-test, disk diffusion, and
microdilution methods for antifungal susceptibility testing of fluconazole and voriconazole. Antimicrob. Agents Chemother. 47:1647–1651. 13. Mokaddas EM, Al-Sweih NA, Khan ZU. 2007. Species distribution and
antifungal susceptibility of Candida bloodstream isolates in Kuwait: a 10-year study. J. Med. Microbiol. 56:255–259.
14. Muller R, Buttner P. 1994. A critical discussion of intraclass correlation coefficients. Stat. Med. 13:2465–2476.
15. Ostrosky-Zeichner L, et al. 2003. Antifungal susceptibility survey of 2,000 bloodstream Candida isolates in the United States. Antimicrob. Agents Chemother. 47:3149 –3154.
16. Perlin DS. 2009. Antifungal drug resistance: do molecular methods pro-vide a way forward? Curr. Opin. Infect. Dis. 22:568 –573.
17. Pfaller M, et al. 2011. Use of epidemiological cutoff values to examine 9-year trends in susceptibility of Aspergillus species to the triazoles. J. Clin. Microbiol. 49:586 –590.
18. Pfaller MA, et al. 2010. Comparison of European Committee on Antimi-crobial Susceptibility Testing (EUCAST) and Etest methods with the CLSI broth microdilution method for echinocandin susceptibility testing of Candida species. J. Clin. Microbiol. 48:1592–1599.
19. Pfaller MA, Castanheira M, Messer SA, Moet GJ, Jones RN. 2011. Echinocandin and triazole antifungal susceptibility profiles for Candida spp., Cryptococcus neoformans, and Aspergillus fumigatus: application of new CLSI clinical breakpoints and epidemiologic cutoff values to charac-terize resistance in the SENTRY Antimicrobial Surveillance Program (2009). Diagn. Microbiol. Infect. Dis. 69:45–50.
20. Pfaller MA, Diekema DJ, Sheehan DJ. 2006. Interpretive breakpoints for fluconazole and Candida revisited: a blueprint for the future of antifungal susceptibility testing. Clin. Microbiol. Rev. 19:435– 447.
21. Pfaller MA, Messer SA, Bolmstrom A. 1998. Evaluation of Etest for determining in vitro susceptibility of yeast isolates to amphotericin B. Diagn. Microbiol. Infect. Dis. 32:223–227.
22. Pfaller MA, Messer SA, Bolmstrom A, Odds FC, Rex JH. 1996. Multisite reproducibility of the Etest MIC method for antifungal susceptibility test-ing of yeast isolates. J. Clin. Microbiol. 34:1691–1693.
23. Rodriguez-Tudela JL, et al. 2007. Statistical analyses of correlation be-tween fluconazole MICs for Candida spp. assessed by standard methods set forth by the European Committee on Antimicrobial Susceptibility Testing (E.Dis. 7.1) and CLSI (M27-A2). J. Clin. Microbiol. 45:109 –111. 24. Sanglard D, Coste A, Ferrari S. 2009. Antifungal drug resistance mech-anisms in fungal pathogens from the perspective of transcriptional gene regulation. FEMS Yeast Res. 9:1029 –1050.