Rolling shear modulus and damping factor of spruce and
decayed spruce estimated by modal analysis
Sandy Isabelle Schubert
1,2,*, Daniel Gsell
2, Ju¨rg
Dual
3, Masoud Motavalli
2and Peter Niemz
1 1Institute of Building Materials, ETH Zu¨rich, Zu¨rich,
Switzerland
2
Structural Engineering Research Laboratory, EMPA,
Duebendorf, Switzerland
3
Institute of Mechanical Systems, ETH Zu¨rich, Zu¨rich,
Switzerland
*Corresponding author.
Sandy Isabelle Schubert, Institute of Building Materials, ETH Zentrum CLA H31, 8092 Zu¨rich, Switzerland
Tel.: q41-446326106
E-mail: [email protected]
Abstract
Modal analysis was used to determine the rolling shear
modulus of Norway spruce samples that were either
untreated or inoculated with fungi. The resonance
fre-quencies of centimeter-range cuboids were measured
using contact-less laser interferometry. A
three-dimen-sional theoretical model describing the orthotropic
behavior of the material was used to calculate the
reso-nance frequencies. Using an iterative scheme based on
the least-squares method, the value of the rolling shear
modulus was then extracted. In this first investigation,
the decrease in the rolling shear modulus and the weight
loss of Norway spruce inoculated with white-rot fungi
Heterobasidion annosum and Ganoderma lipsiense were
studied for three different exposure times ranging from 4
to 12 weeks. Comparison of measured and theoretical
resonance frequencies confirmed that operation was in
the applicable range of the theoretical model for the
inoc-ulated specimens. A decrease in rolling shear modulus
of up to 10% (H. annosum) and 50% (G. lipsiense) was
found.
Keywords: Ganoderma lipsiense; Heterobasidion
anno-sum; modal analysis; resonant ultrasound spectroscopy;
rolling shear modulus; white rot.
Introduction
Fungal degradation of wood results in considerable
losses in the commercial value of logs and hazards to
the environment by loss of stability. Wood decay leads
to decreases in weight and stiffness, as well as to
chang-es in the damping factor and moisture content. This
influ-ences the velocity of structural wave propagation in the
material and the natural frequencies of wooden
struc-tures. The aim of this work was to study the first three of
these factors in an appropriate frequency and
deforma-tion range according to non-destructive testing methods
using sound propagation or vibrations. These methods
might be used to determine the state of degradation.
Until now, most investigators have studied the velocity
of the longitudinal wave propagating along the fiber axis
(v
L) (Niemz et al. 2000) or perpendicular to the growth
rings (v
R) of wood (Wilcox 1988; Schwarze and Fink 1994)
in specimens of centimeter size using frequencies from
300 Hz to 1 MHz. According to Bauer and Kilbertus
(1991), v
Rand the velocity of transverse waves
propa-gating along either the radial or the tangential axis and
polarized with respect to the other direction (along the R
or T axis; v
RT) were significantly more sensitive to decay
due to the brown-rot fungus Gloeophyllum trabeum than
the velocities of all other principle directions. For the
white-rot fungus Coriolus versicolor, the sensitive
veloc-ities were the velocity of the longitudinal wave
propagat-ing tangential to the growth rpropagat-ings, v
T, and v
RT.
‘‘Ultrasonic tomography’’ of standing trees, as
pro-posed by Divos and Szalai (2002) and Rust (2000), is
based on time-of-flight measurements of the
quasi-lon-gitudinal wave in the radial-tangential plane on many
points around the cross-section. Depending on the
wavelength (lsvf
y1, where f is the frequency) and the
diameter of the trunk, a reasonable frequency range for
measurements of this kind is 10–50 kHz. Another
com-mon approach for non-destructive testing in wood
sci-ence and in many other fields is modal analysis, recently
applied to standing trees by Axmon et al. (2002, 2004).
Natural frequencies, which were supposed to be
sensi-tive to Heterobasidion annosum decay of Norway spruce,
corresponded to the ‘‘ovaling’’ mode and were in the
range of 50 Hz to 2 kHz. The frequency of this ovaling
mode depends on the diameter of the trunk, the density
and the elastic constant C
44s
G
RTof the material, i.e., the
velocity of the transversal wave
y1, which was
y
v s G
RT RTr
shown to be sensitive to decay in a study by Bauer and
Kilbertus (1991).
Before the approach of Axmon et al. (2002, 2004) can
be investigated theoretically, knowledge of the influence
of fungal decay on the density and shear modulus G
RTis
required. The shear modulus G
RTis by far the lowest
elas-tic constant of softwood, and thus the lowest natural
fre-quencies of a wooden cube depend only on G
RT. Hence,
modal analysis of small wooden specimens was chosen
in this work (see Figure 1). The frequency and
deforma-tion range of the non-destructive methods mendeforma-tioned are
also satisfied by this method (5–15 kHz and
m
m-range
deformation). Experimental modal analysis identifies the
natural frequencies of the specimens. In addition, the
natural frequencies need to be calculated using a
theo-retical model. Thus, G
RTwas determined using an
itera-tive scheme obtained by a least-squares fit. In the
literature, this method is often called resonant ultrasound
spectroscopy (RUS), as reviewed by Migliori et al. (2001).
Figure 1 Definition of the coordinate system and geometry of the cube (left) and the cuboid (right). L, R and T refer to the longitudinal (fiber), radial and tangential directions, respectively.
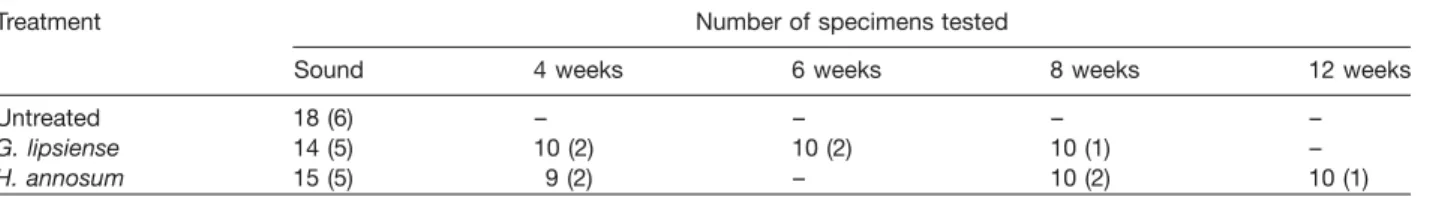
Table 1 Number of specimens for which the shear modulus GRTwas determined.
Treatment Number of specimens tested
Sound 4 weeks 6 weeks 8 weeks 12 weeks
Untreated 18 (6) – – – –
G. lipsiense 14 (5) 10 (2) 10 (2) 10 (1) –
H. annosum 15 (5) 9 (2) – 10 (2) 10 (1)
Values in parentheses denote the number of cubic specimens.
As the material damping of wood is significantly higher
than the damping of the materials used for RUS to date,
modifications of the experimental set-up and the data
processing were required. The shear modulus G
RTand
the damping of untreated and inoculated Norway spruce
(Picea
abies)
were
determined
by
RUS
in
this
investigation.
Two important white-rot fungi, H. annosum and G.
lipsiense (Etheridge 1955; Worrall et al. 1983; Rayner and
Boddy 1988), were chosen. According to the literature,
H. annosum leads to preferential degradation of lignin in
Norway spruce for both naturally decayed (Blanchette
1984) and laboratory decayed (Schwarze et al. 1997)
wood. On the other hand, Blanchette et al. (1985)
report-ed that G. lipsiense leads to selective delignification or
simultaneous degradation of lignin and cellulose in birch
wood under natural or laboratory decay conditions,
respectively.
Materials and methods
Specimens, fungal treatment and climatic conditions
Clear wooden samples (Figure 1) were sawn from a board of spruce (Picea abies) tangential to the growth rings. Untreated specimens were conditioned at 208C and 65% relative humidity (RH) before GRT was determined. The number of specimens measured and their distribution over the exposure times are list-ed in Table 1. Subsequently the samples were drilist-ed at 1038C, weighed individually and sterilized with ethylene oxide to prevent contamination with other fungi. To establish appropriate condi-tions for colonization by H. annosum (DSM 2728, EMPA No. 620) and G. lipsiense (Uni Freiburg 250593.1, EMPA No. 646) all spec-imens were steamed twice for 10 min to achieve a moisture content of )28%. The samples were inserted into Kolle flasks containing agar and covered with mycelia of either H. annosum or G. lipsiense; exposure was carried out at 228C and 75% humidity. At the end of each exposure period, all adherent
myce-lia were removed and the specimens are weighed to estimate the moisture content. Before applying RUS, the decayed spec-imens were again conditioned at 208C and 65% humidity. The dry weight losses and the moisture content after sample deg-radation were assessed by drying samples at 1038C.
Resonant ultrasound spectroscopy
Experimental set-up The experimental set-up for RUS is shown in Figure 2A. A white noise signal was generated by a function generator (Stanford Research DS345), while the band-width of the signal was restricted to 0–25 kHz by a low-pass filter (Krohn-Hite 3988). A piezoelectric transducer (2.80 =3.85=1 or 2.15=2.15=1 mm3, mass m
p-2% of the speci-men mass) glued to the specispeci-men surface changes its thickness according to the amplified (Krohn-Hite 750) electrical field applied and excites the specimen. Displacement of the sample surface was determined using a heterodyne laser interferometer (Polytech OFV3001), while retro-reflective tape on the sample surface enhances the necessary reflection. A demodulator (MH PD4) was used because of the low displacement range, as explained by Dual et al. (1996). Since all expected resonance frequencies were above 1000 Hz, a high-pass filter at 500 Hz was applied to the measured signal and it was digitized by an A/D converter (NI 5911) with a sampling rate of 1 MHz and an effective vertical resolution of 17.5 bit.
Signal processing Resonance frequencies fi and damping
factors dj were determined by a matrix pencil algorithm as described by Hua and Sarkar (1990). The condition for applying this method is that the amplitude y(t) of the signal can be described by a finite sum of M exponential functions:
M ydt i2pf t j j y t s
Ž .
8
A ej e qn t ,Ž .
(1) s j 1where Ajis the complex amplitude, fiis the frequency,djis the
damping factor of the j-th harmonic part, n(t) is the measurement noise and i is the imaginary unit. The energy content of the noise signal used is low and uniformly distributed within the frequency range considered. Hence, the structural response within the range considered has a finite number of frequencies of high energy – the resonance frequencies – and can be written in the form of Eq. (1). All steps of the signal processing procedure are described in Figure 2B.
Theoretical model The finite element method (FEM) may be used to calculate resonance frequencies, but in RUS a much faster method, based on a parametrical description of the defor-mation state, is necessary. As proposed by Demarest (1971), the components of the displacement were expressed using Legen-dre polynomials:
T T
u x,t sq t P x ,i
Ž
.
iŽ . Ž .
with is1,2,3, (2)where qiis the time-dependent unknown coefficient vector and P is a matrix of polynomials describing the deformation state of the cuboid:
Figure 2 (A) Experimental set-up and (B) signal processing procedure. Bx1E Bx2E Bx3E C F C F C F w x P x s p ,p ,«,p ,
Ž .
1 2 N with p sPj m Ps Pr , (3) DbG DcG DdGwhere P is a Legendre polynomial of order m, s or r and b, c and d are the dimensions of the cuboid. For correct description of the deformation, it is necessary to satisfy the completeness of the polynomial approach, and therefore all possible permu-tations of the Legendre polynomial orders m, s and r for m,s,rs0,1,«,L subject to mqsqrFL, are selected. Hence, the size of P is Ns(Lq3)(Lq2)(Lq1), where L is the maximum poly-nomial order.
Hooke’s law s(x,t)sC´(x,t) is used to describe the relation between the stresses s and the linear strains ´ in terms of the stiffness tensor C, where linear kinematic relations give ´sLqT,
with L a matrix containing the spatial derivatives of P. With the separational approach for the coefficients q(t)saeivtin
Hamil-ton’s principle, the following eigenvalue problem was derived:
2
yvMqK C as0, (4)
Ž
Ž ..
with matrices of mass M and stiffness K:
T T
Ms
|
rPP dV and Ks|
rLCL dV. (5)V V
Implementing the effect of the piezoelectric element mass mp, the matrix M was extended to:
mp
T T
Ms
|
rPP dVq|
PP dS, (6) SpV Sp
where Spis the surface area onto which the piezoelectric ele-ment was glued. The accuracy of the model with the piezoelec-tric element was checked by comparing the results with finite element calculations using 3D solid elements. The difference
between the FE calculations and the polynomial approach of polynomial order Ls15 was approximately 0.02% and 0.6% for the first and second resonance frequency, respectively, whereas the CPU time required by the polynomial approach is less than 1/50th of that for FE calculations.
Iterative scheme Since no closed-form solution exists for the elements of the stiffness tensor C in Eq. (4), an iterative scheme was applied to solve the inverse problem. Reasonable starting values for the stiffness tensor C were chosen. As described in the Introduction, the lowest natural frequencies mainly depend on C44, and thus the iteration scheme was only carried out for this elastic constant. The new values forCnwere derived from
44
the least-squares method, minimizing the error between the measured (fi) and calculated (fcali ) frequencies:
M 2 cal F C s
Ž
44.
8
Ž
f yf ,i i.
(7) s i 1subject to Eq. (4). Applying the Taylor expansion around the ini-tial valueC0, the value for the next iteration step was obtained:
44 n 0 C 5C HDC ,44 44 44 with DC44 y1 Bw≠F C
Ž
.
z E 44 0C
x
|
F
5F CŽ
44.
. (8) 0 y ≠C ~ D 44 C44sC44GThe new valueCnis a better estimation thanC0 and is used
44 44
for the subsequent step. The iteration was carried out until the changes in the values of the stiffness tensor are sufficiently small. For the results shown in the next section, the element C44 was determined by fitting the first two resonance frequencies; see Figure 3 for the dominant influence of C44. For complete-ness, the values used for the stiffness tensor C were: C11s15600, C22s950, C33s650, C12s640, C23s350, C13s510, C55s750 and C66s800, all in MPa; the starting value for C44was 35 MPa. By varying each value of the stiffness tensor C by
Figure 3 Relative difference in the resonance frequencies for a 10% higher value of the corresponding element of the stiffness
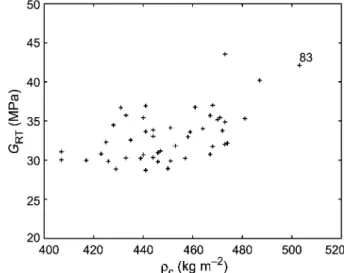
tensor. Figure 4 Shear modulus GRTof 47 untreated specimens as a
function of density rc at 208C and 65% RH. Mean values: s33.2"3 MPa and s450"20 kg my3; Rs0.56.
¯ ¯
GRT rc
Table 2 Rolling shear modulus GRT values reported in the literature. GRT Density MC Reference (MPa) (kg my3) (%) 35 423 9.8 Stamer (1935) 37 500 12 Hearmon (1948) 41 NS 12.5 Neuhaus (1983)
75 409 NS Bucur and Archer (1984)
36 400 8.0–12.0 Bucur (1987)
58 447 10.0–13.0 Dumail et al. (2000)
30 450 NS Go¨rlacher (2002)
NS, not specified. approximately 10%, the relative differences of the extracted C44
varied by only 0.003–0.17%.
Results and discussion
The elastic constant C
44s
G
RTof the untreated wood was
determined for 47 specimens, as shown in Figure 4. The
mean value G
¯
RTs
33.2"3 MPa, with a moisture content
(MC) of 12.5"0.5% is in accordance with the literature
(Table 2). To compare the damping behavior of different
specimens or materials, it is common to define the
atten-uation factor Dsd(2pf
0)
y1
,
where f
0is the resonance
fre-quency. The attenuation factor D was determined for 41
specimens, with a mean value of D
¯ s0.016"0.001.
The shear modulus G
RTof one control specimen was
measured before and after the drying process to estimate
the influence of oven drying. Before both measurements,
the sample was conditioned under climate conditions of
208C/65% RH. The estimated difference in G
RTwas
q
2.3%, while the moisture content decreased from 12%
to 11%.
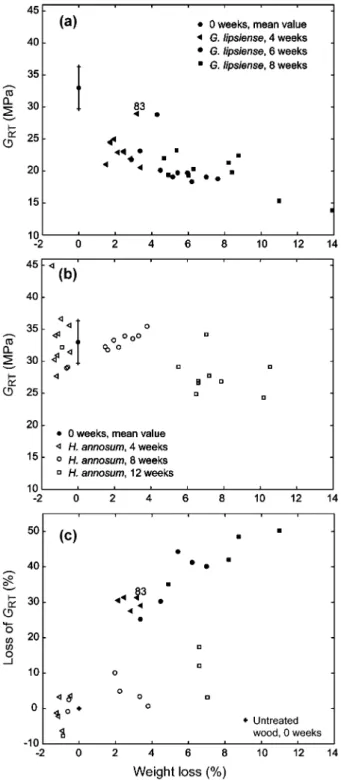
Despite the fact that both pathogens had completely
grown over the specimens after the first exposure period,
G. lipsiense and H. annosum showed diverse destructive
activity. The G
RTvalues for 30 specimens degraded by
G. lipsiense, depicted in Figure 5A, are distinguishably
lower value (down to 50%) than for untreated specimens.
According to the lower mass loss after 4 and 8 weeks,
H. annosum degraded the wood constituents more
slow-ly than G. lipsiense. The effect on the elastic constant
G
RTwas small and could only be distinguished after
12 weeks of exposure (Figure 5B). Both pathogens
resulted in slightly higher values for the attenuation factor
D for inoculated compared to untreated specimens,
whereas the deviation was greater for inoculated
sam-ples. The theoretical model used for calculation of the
frequencies considers an orthotropic and homogeneous
cuboid. Because of fungal decay, the inhomogeneity may
increase and the geometry may differ slightly from a
cuboid. The differences between the measured and
cal-culated natural frequencies are a measure of the
com-mensurability of the model. For untreated specimens,
these differences for the first and second natural
fre-quency were 0.7% on average, and a maximum error of
2%. For samples decayed by G. lipsiense, the mean
dif-ference (1.0%, 1.4% and 1.7%) and maximum error
(1.7%, 2.5% and 5.5%) increased with exposure time (4,
6 and 8 weeks, respectively). The mean values
demon-strate that the specimens were still in good agreement
with the model. No significant changes could be
observed for H. annosum based on the mean difference
(0.4%, 0.6% and 0.4%) and maximum error (1.3%, 2.6%
and 1.6% for 4, 8 and 12 weeks, respectively).
The weight loss, stiffness, damping and MC results for
all inoculated specimens are summarized in Table 3. The
equilibrium MC of the untreated and decayed specimens
differed slightly, but did not result in significant changes
in G
RT. Relative changes in the shear modulus G
RTwere
analyzed for half of the specimens by measuring their
values before and after exposure under climatic
condi-tions of 208C/65% RH. The results of the relative
meas-urements depicted in Figure 5C show the different
relations between the decrease in stiffness and the
weight loss of specimens decayed by H. annosum and
G. lipsiense. Because of the potential influence of the
mass of fungal mycelia on the weight loss, no linear
regression analysis was carried out for the data in Figure
5. The importance of relative measurements should be
emphasized. For specimen No. 83 in Figure 5, the high
G
RTvalue after exposure is only due to the large stiffness
Figure 5 Rolling shear modulus GRTas a function of weight loss due for (A) G. lipsiense and (B) H. annosum. (C) Relationship between the decrease in GRTand weight loss.
value for the untreated specimen (Figure 4), as the
per-centage decrease in G
RTis similar to that for the other
samples.
The motivation for this study was to assess the
influ-ence of fungal wood decay on elastic waves or
reso-nances, which might be used for non-destructive testing
of standing trees. Therefore, the significant information is
the change in the relation between stiffness and density,
i.e., the wave velocity and impedance. In our case, the
variation in the velocity of the transverse wave v 5
RTand the impedance
describe the
y1
y
G
RTr
z s
RTy
rØG
RTinfluence. Consequently, the velocity v
RTin a decayed
region was related to the values for the untreated wood
by the coefficient d
vRT:
D D
v
RT DG
RTd 5
vRTv
,
with v 5
RTy
r
D,
(9)
RT
where the superscript D indicates the values are for a
decayed specimen. By analogy, the coefficient for
impe-dance (d
zRT) was defined, which describes the reflection
of the transverse wave. These coefficients were
calcu-lated using the results of the relative measurements in
Table 4. As can be observed in Figure 6, the velocity v
RTand impedance z
RTwere sensitive to the degradation
pat-tern of G. lipsiense. Thus, analysis of the wave
propa-gation
and
reflection
phenomena
or
resonances
represents a promising non-destructive method for
detecting areas decayed by G. lipsiense. On the other
hand, degradation by H. annosum in the early stages was
sensitive to neither velocity nor impedance.
Until now, the change in MC because of fungal activity
has been neglected in evaluation of the velocity v
RT. For
these laboratory-decayed specimens, the higher MC
would lead to an approximately 22% and 14% higher
density for H. annosum and G. lipsiense, respectively,
and a reduced shear modulus. Therefore, the reduction
in v
RTdue to the MC would be relevant in comparison
with the decrease in stiffness after decay by H. annosum.
Comparing this result for H. annosum in Norway spruce
with results reported by Schwarze (1995), who measured
the velocity v
Rfor spruce decayed by H. annosum and
control specimens after 12 weeks of exposure, it is
evi-dent that the changes in velocity at stages with small
weight loss were because of higher MC rather than a
decrease in stiffness due to decay.
Conclusions
Resonant ultrasound spectroscopy was successfully
applied to specimens of Norway spruce to determine the
shear modulus G
RTand the attenuation factor D in the
required frequency range. The orthotropic behavior of
wood was correctly described in the three-dimensional
theoretical model and the measurement was contact-less
and non-destructive. Thus, the method allows evaluation
of relative changes in G
RTdue to fungal decay or different
climatic conditions. The latter is also interesting for
research in mechanical pulping to investigate the
non-local rolling shear modulus. It should also be possible to
determine the shear modulus and other elastic constants
of plywood and solid wood panels, although a different
geometry may be required.
Our results showed that the agreement required for the
model and modeled object was met for untreated and
inoculated specimens. Hence, this method can be used
to study the variation of G
RTand damping D for various
types of host-fungus relations. For G. lipsiense, the
decrease in G
RTresulted in a significant change in the
transverse velocity v
RTand the impedance z
RT. Whereas,
degradation by H. annosum showed no significant
influ-ence on the relation between the decrease in stiffness
and weight loss. Comparison of this result with other
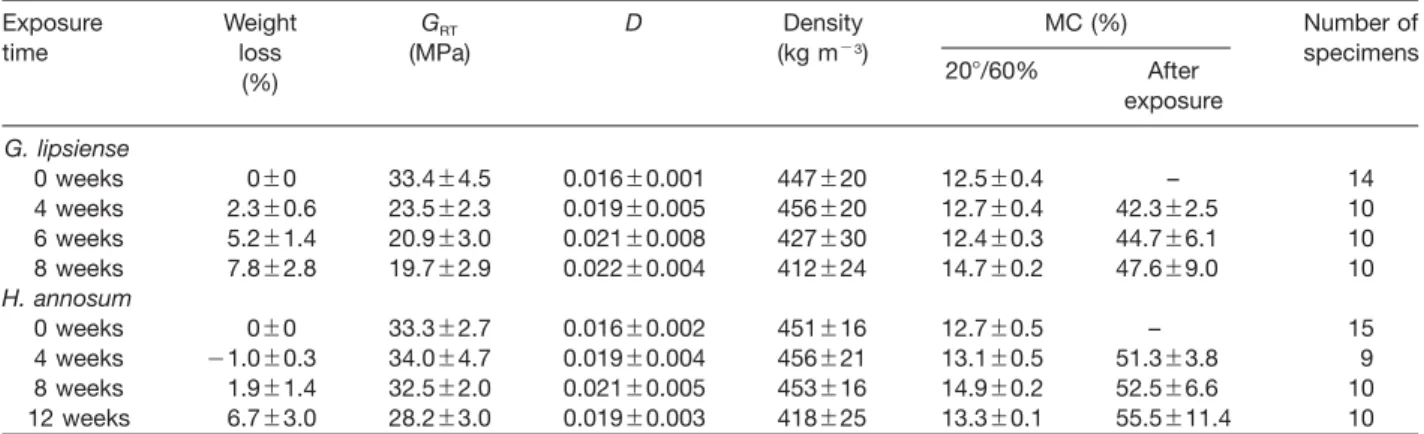
Table 3 Summary of the results for G. lipsiense and H. annosum.
Exposure Weight GRT D Density MC (%) Number of
time loss (MPa) (kg my3)
208/60% After specimens (%) exposure G. lipsiense 0 weeks 0"0 33.4"4.5 0.016"0.001 447"20 12.5"0.4 – 14 4 weeks 2.3"0.6 23.5"2.3 0.019"0.005 456"20 12.7"0.4 42.3"2.5 10 6 weeks 5.2"1.4 20.9"3.0 0.021"0.008 427"30 12.4"0.3 44.7"6.1 10 8 weeks 7.8"2.8 19.7"2.9 0.022"0.004 412"24 14.7"0.2 47.6"9.0 10 H. annosum 0 weeks 0"0 33.3"2.7 0.016"0.002 451"16 12.7"0.5 – 15 4 weeks y1.0"0.3 34.0"4.7 0.019"0.004 456"21 13.1"0.5 51.3"3.8 9 8 weeks 1.9"1.4 32.5"2.0 0.021"0.005 453"16 14.9"0.2 52.5"6.6 10 12 weeks 6.7"3.0 28.2"3.0 0.019"0.003 418"25 13.3"0.1 55.5"11.4 10
Table 4 Coefficients for the significant parameters as a function of the exposure time.
Exposure Weight Decrease in dvRT dzRT Number of
time loss (%) GRT(MPa) (%) (%) specimens
G. lipsiense 4 weeks 2.8"0.4 29.9"1.5 84.8"0.9 82.6"0.9 5 6 weeks 5.3"1.3 36.2"7.2 81.2"4.4 78.3"4.8 5 8 weeks 8.2"2.2 43.9"6.0 77.3"3.1 72.3"4.8 4 H. annosum 4 weeks y1.0"0.3 y0.6"3.7 99.2"1.5 101.0"2.2 5 8 weeks 1.6"1.7 3.5"3.5 98.1"1.9 98.4"2.1 5 12 weeks 4.8"3.3 6.2"9.5 98.4"3.9 95.1"6.0 4
Figure 6 Wave velocity vRTand impedance zRTof inoculated specimens as a function of velocity and impedance of the untreated specimens.
studies of laboratory-decayed wood confirms that the
wave velocity and impedance are influenced in the early
stages of H. annosum decay in Norway spruce by
chang-es in MC rather than by degradation. Since the fungal
influence on the MC in laboratory-decayed specimens
cannot be conferred to naturally decayed wood, we
pro-pose to study the influence of fungi on the MC in
stand-ing trees.
Acknowledgements
The inoculation of fungal pathogens by Markus Heeb from EMPA, St. Gallen is gratefully acknowledged.
References
Axmon, J., Hansson, M., Sornmo, L. (2002) Modal analysis of living spruce using a combined Prony and DFT multichannel method for detection of internal decay. Mech. Syst. Signal Proc. 16:561–584.
Axmon, J., Hansson, M., Sornmo, L. (2004) Experimental study on the possibility of detecting internal decay in standing Picea abies by blind impact response analysis. Forestry 77:179–192.
Bauer, C., Kilbertus, G. (1991) Ultrasonic technique for deter-mining the extent of fungus attack of beech and pine wood. Holzforschung 45:41–46.
Blanchette, R.A. (1984) Screening wood decayed by white rot fungi for preferential lignin degradation. Appl. Environ. Mir-crobiol. 48:647–653.
Blanchette, R.A., Otjen, L., Effland, M.J., Eslyn, W.E. (1985) Changes in structural and chemical components of wood delignified by fungi. Wood Sci. Technol. 19:35–46.
Bucur, V. (1987) Varieties of resonance wood and their elastic constants. J. Catgut Acoust. Soc. 47:42–48.
Bucur, V., Archer, R.R. (1984) Elastic constants for wood by an ultrasonic method. Wood Sci. Technol. 18:255–265. Demarest, H.H. (1971) Cube-resonance method to determine
the elastic constants of solids. J. Acoust. Soc. Am. 49:768–775.
Divos, F., Szalai, L. (2002). Tree evaluation by acoustic tomog-raphy, In: 13th International Symposium on Nondestructive Testing of Wood, Berkeley, CA, USA. pp. 251–256. Dual, J., Ha¨geli, M., Pfaffinger, M.R., Vollmann, J. (1996)
Exper-imental aspects of quantitative nondestructive evaluation using guided waves. Ultrasonics 34:291–295.
Dumail, J.F., Olofsson, K., Salme´n, L. (2000) An analysis of rolling shear of spruce wood by the Iosipescu method. Holzfor-schung 54:420–426.
Etheridge, D.E. (1955) Comparative studies of North American and European cultures of the root rot fungus, Fomes annosus (Fr.). Can. J. Bot. 33:416–428.
Go¨rlacher, R. (2002) A method for determining the rolling shear modulus of timber. Holz Roh- Werkstoff 60:317–322. Hearmon, R.F.S. The Elasticity of Wood and Plywood.
Depart-ment of Scientific and Industrial Research, London, 1948. Hua, Y., Sarkar, T.K. (1990) Matrix pencil method for estimating
parameters of exponentially damped undamped sinusoids in noise. IEEE Trans. Acoust. Speech Signal Process. 38:814– 824.
Migliori, A., Darling, T., Baiardo, J., Freibert, F. (2001) Resonant ultrasound spectroscopy (RUS). In: Modern Acoustical Tech-niques for the Measurement of Mechanical Properties, Vol. 39. Ed. Levy, M. Academic Press, San Diego. pp. 189–220. Neuhaus, H. (1983) Elastic behavior of spruce wood as a
func-tion of moisture content. Holz Roh-Werkstoff 41:21–25. Niemz, P., Graf, E., Lanz, B., Hebeisen, S. (2000) Einfluss des
Befalls holzzersto¨render Pilze auf Schallgeschwindigkeit und Eigenfrequenz bei Fichten- und Buchenholz. Holzforschung Holzverwertung 6:121–124.
Rayner, A.D.M., Boddy, L. Fungal Decomposition of Wood. Wiley, Chichester, 1988.
Rust, S. (2000). A new tomographic device for the nondestruc-tive testing of trees, In: 12th International Symposium on Nondestructive Testing of Wood, Sopron, Hungary. pp. 233–237.
Schwarze, F.W.M.R. Entwicklung und biomechanische Auswir-kungen von holzzersetzenden Pilzen in lebenden Ba¨umen und in vitro. SVK-Verlag, 1995.
Schwarze, F.W.M.R., Fink, S. (1994) Ermittlung der Holzzerset-zung am lebenden Baum. Neue Landschaft 3:182–193. Schwarze, F.W.M.R., Lonsdale, D., Fink, S. (1997) An overview
of wood degradation patterns and their implications for tree hazard assessment. Arboricult. J. 21:1–32.
Stamer, J. (1935) Elastizita¨tsuntersuchungen an Ho¨lzern. Ing. Arch. 4:1–8.
Wilcox, W.W. (1988) Detection of early stages of wood decay with ultrasonic pulse velocity. For. Prod. J. 38:68–73. Worrall, J.J., Parmeter, J.R.,Cobb, F.W. (1983) Host
specializa-tion of Heterobasidion annosum. Phytopathology 73:304– 307.