HAL Id: hal-01436109
https://hal.archives-ouvertes.fr/hal-01436109v2
Submitted on 3 Apr 2017HAL is a multi-disciplinary open access archive for the deposit and dissemination of sci-entific research documents, whether they are pub-lished or not. The documents may come from teaching and research institutions in France or abroad, or from public or private research centers.
L’archive ouverte pluridisciplinaire HAL, est destinée au dépôt et à la diffusion de documents scientifiques de niveau recherche, publiés ou non, émanant des établissements d’enseignement et de recherche français ou étrangers, des laboratoires publics ou privés.
Ro-vibrational spectroscopy in hybrid fs/ps- CARS for
N 2 thermometry
M. Nafa, M. Scherman, A. Bresson, A. Aubin, A. Godard, B. Attal-Tretout,
P. Joubert
To cite this version:
M. Nafa, M. Scherman, A. Bresson, A. Aubin, A. Godard, et al.. Ro-vibrational spectroscopy in hybrid fs/ps- CARS for N 2 thermometry. Aerospace Lab, Alain Appriou, 2016, �10.12762/2016.AL12-10�. �hal-01436109v2�
Testing in Aerospace Research
Ro-Vibrational Spectroscopy
in Hybrid fs/ps-CARS
for N
2
Thermometry
M. Nafa
(ONERA / Institut UTINAM, UMR CNRS 6213)
M. Scherman,
A. Bresson, A. Aubin, A. Godard, B. Attal-Tretout
(ONERA)
P. Joubert
(Institut UTINAM, UMR CNRS 6213) E-mail: michael.scherman@onera.fr DOI : 10.12762/2016.AL12-10
R
o-vibrational CARS spectroscopy is performed on the Q-branch of N
2in the
hybrid fs/ps regime. A new optical setup has been mounted using a single laser
source and a spectral filtering stage based on a volume Bragg grating and a
Fabry-Perot etalon, in order to achieve a good enough resolution. CARS spectra are recorded
in ambient air at a 1 kHz repetition rate. However, a CH
4/air flame is probed at 2 Hz,
in order to obtain a strong enough signal to enable thermometry. The theoretical
treatment is also detailed and provides the calculated spectrum, properly compared to
experimental profiles in order to retrieve the temperature. The accuracy of the hybrid
fs/ps-CARS thermometry is satisfactory as regards the state of the art, but further
experiments are in progress to increase the repetition rate of the measurement in hot
gases.
Introduction, Context
CARS spectroscopy for diagnostics in reactive flows
Laser techniques have high spatial and temporal resolution, enabling locally and temporally resolved measurements of temperature and species concentration. Among the various optical diagnostics, non-linear techniques provide stronger and collimated signals allowing highly luminous media at high temperature and pressure to be stud-ied in situ [1]. One of them, coherent anti-Stokes Raman scattering (CARS), was developed at ONERA [2] and extensively used for tem-perature measurements in hostile reactive environments of interest in the aeronautic field [3] [4].
CARS is a nonlinear spectroscopic technique that was first introduced by Maker et al. [5]. As illustrated in Figure 1 (a), a CARS process takes place when three laser beams, namely pump, Stokes and probe, at the respective frequencies ωP, ωS and ωPr , propagate through a me-dium having Raman active ro-vibrational modes ωαβ , described by the vibration and rotation quantum numbers υ and J of the ro-vibrational levels α and β associated with the transition. When pump and Stokes fulfill ωp-ωS= ωαβ , a new wave is generated at the anti-Stokes frequency ωAS=ωPr+ωαβ. It results from the inelastic scattering of the wave ωPr by the molecular vibrations, coherently driven by the
Pump Stokes Probe anti-Stokes
J
ʋ
ω
αβ (a) (b)Figure 1 – (a) Sketch of the CARS process: generation of an anti-Stokes signal by a N2 molecule, with rotational and vibrational degree of freedom designated by their respective quantum number J and υ , excited by three laser pulses, pump, Stokes and probe. (b) Illustration of CARS diagnostics in a CH4 /air flame.
incident waves at ωp and ωS . By scanning the Stokes wavelength, the molecular spectrum can be obtained [6], while a broadband pulse allows it to be recorded in a single laser shot [7].
Over the last three decades, ns and ps-CARS spectroscopy appeared to be very well suited to gas phase diagnostics, such as tempera-ture and concentration measurements in flames, as illustrated in Figure 1 (b). CARS diagnostics were used in this regime at a repetition rate of a few Hz, although 100 kHz CARS thermometry was recently demonstrated with ps-pulses using burst pulse lasers [8]. However, over the last ten years, the development of femtosecond lasers en-abled to take advantage of good stability from shot to shot to increase the measurement accuracy, as well as high peak power to enhance the CARS process efficiency and allowing high repetition rate mea-surements [9]. Also, laser pulses benefit from large bandwidths, which were used to excite and probe wide spectral ranges in a single shot [10] [11] [12], thereby providing the broadband spectroscopy demonstrated previously [7] [13].
However, although gas spectroscopy was straightforward in the nanosecond or picosecond regime, a good enough spectral resolu-tion was not easily achieved in the fs-regime due to the large band-width involved in the interaction. Moreover, the stationary approxima-tion is no longer valid when the state lifetime becomes larger than the laser pulse duration and transient solutions of the system evolution thus need to be calculated [14]. Recently, a mixed regime called hy-brid fs/ps, has been proposed to take advantage of both the broad-band spectral range excited by fs-pulses, and the good resolution provided by ps-pulses [15]. It opens new possibilities for CARS diag-nostics, and was successfully used to demonstrate single-shot pure-rotational [16] and under-resolved ro-vibrational [17] thermometry, ultra-broadband kHz punctual and 1D-CARS spectroscopy [18], and finally 10 Hz 2D-thermometry using pure rotational CARS [19]. In that context, our paper is aimed at investigating some specific properties of ro-vibrational CARS spectroscopy in the hybrid fs/ps regime and its potential application to thermometry.
Hybrid fs/ps-CARS spectroscopy for thermometry
The basic principle of temperature measurements by CARS is to probe the relative population of the molecular levels from which the thermodynamic temperature of the molecular system is drawn. The temperature is derived from the observed Q-branch (Δ J=0, Δv=+1) of the N2 CARS spectrum, as illustrated in
Figure 2 (a), which is fitted to a library of theoretical shapes simu-lated assuming temperatures, potentially distinct, for vibration and rotation of N2 molecules [20]. This technique is appropriate for di-agnostics in non-equilibrium or very luminous reactive flows, such as plasma and flames, since the CARS process efficiency is high and the Raman shift of N2 is well separated from those of other chemical species.
Hybrid fs/ps-CARS is described as a pump/probe experiment, and is illustrated in Figure 2. First, the medium is excited by ultra-short pump and Stokes fs-pulses that allow efficient broadband excitation of a set of Raman coherences, depicted in Figure 2 (b). Then, a nar-rowband ps-probe pulse interrogates the medium during a time that drives the final resolution on the anti-Stokes spectrum, as described in Figure 2 (c). Also, the excitation is separated from the probing of the coherences when using a pump/probe delay τ, which repre-sents a new degree of freedom, compared to ns-CARS, to improve CARS performances, as illustrated in Figure 2 (d). As a result, non-resonant background rejection, which was a main limitation of ns-CARS, is optimized using τ [21] [22], thanks to the long-lived co-herences induced from short pulse excitation. The timescale of the process has been well described by time diagrams in [1]. Moreover, as will be described later, in that particular time scale of photon interactions, the final anti-Stokes spectrum is shaped by both the molecular spectral signature and the temporal dephasing between rotational lines. It was used to drive the interferences and improve the diagnostic performances [23], [24], or to perform time-domain spectroscopy [15]. τ Stokes Pump Probe t (d) Temporal sequence of the laser pulses
Temporal domain ʋ ʋ' J' ω00 ω11 3 2 1 0 3 2 1 0 ω22 ω33 ʋ J J (a) Molecular ro-vibrational states Spectral domain ωαβ ωP ωS = ωP-ωS Stokes Pump (b) 2-photon excitation of the coherence ωPr ωAS ωαβ ωPr+ωαβ Probe Anti-Stokes (c) Probing the coherences ωP ωPr ωS ωAS Stokes Pump Anti-Stokes Probe (e) Nonresonant background generation
Figure 2 – Sketch of the light-matter interaction in hybrid fs/ps-CARS. (a) Energy level diagram of the N2 rotational ( J ) and vibrational (υ) structure, and Q-branch associated Raman transitions ωαβ . (b) Broadband excitation of the molecular coherences using a femtosecond pump and Stokes pulses at the respec-tive frequencies ωP and ωS . (c) Narrowband probing using a picosecond probe pulse at frequency ωPr and generating a well resolved anti-Stokes spectrum at ωAS=ωPr+ωαβ . (d) Temporal sequence of the laser pulses, in which pump and Stokes overlap and τ is the pump/probe delay. (e) Two-photon absorption (TPA) scheme contributing to CARS signal.
Experimental setup
General description of the experiment
The experimental setup is sketched in Figure 3. The laser beams gen-eration stage, which is illustrated in Figure 3 (a), is based on a single industrial Yb:KGW laser (LightConversion) that delivers 150 fs – 1 mJ pulses at a 1 kHz repetition rate. A commercial optical parametric am-plifier (OPA) with a second harmonic converter (LightConversion) is used to generate the tunable Stokes wavelength. It produces a 150 fs broadband (114 cm-1) pulse of 21 µJ energy at the Stokes
wave-length of 583.5 nm. A leakage from the OPA pump, at 515 nm, is used to produce both the broadband (130 cm-1) pump pulse of 60 µJ
energy, and the picosecond probe pulse. The latter is obtained by spectral filtering using a Fabry-Perot Etalon (FPE) and a volume Bragg grating (VBG, Optigrate). The narrowband pulse (0.7 cm-1) is used
as the CARS probe with about 1 µJ energy. Residual spectral para-sites are filtered out using high rejection filters (Semrock). The delay between the various pulses is controlled by two motorized transla-tion stages. Recombinatransla-tion of the beams and focalizatransla-tion in a planar folded-BOXCARS geometry [25] are achieved using a dichroic mirror and a 300 mm focal length lens as shown in Figure 3 (b). The anti-Stokes signal is collected using a lens and a collection of interference filters (Semrock). It is then analyzed using a 750 mm spectrometer (Sopra) equipped with a 1800 line/mm grating, and coupled to an electron-multiplying CCD camera (Roper), as shown in Figure 3 (c). The flame was produced out of a McKenna burner, supplied by a CH4/air mixture at an equivalent ratio ϕ=1. The flat premixed flame is shown in Figure 1 (b).
Ps-probe spectral shaping
The temporal profile of the probe beam acts as a time-window to provide the molecular response. As a result, the probe bandwidth directly drives the resolution of the spectroscopy. Much effort has been devoted to precisely shape this spectral and temporal profile, as detailed in the following.
Various methods have been investigated by the hybrid fs/ps-CARS community, in order to generate the well suited picosecond pulse out of a femtosecond one. They are all aimed at narrowing the pulse bandwidth enough to resolve the fine structure of the spectrum, and to impose the right phase mask to generate an optimal temporal pro-file for the probe pulse. In particular, spatial light modulators [26] [27] [28], commercial filters [29], Fabry Perot etalons [30] [31], and non-linear bandwidth compressors [32] were implemented and tested in this double objective. They enabled the generation of pulses with few wavenumbers spectral width, and with asymmetrical temporal shape that proved to be optimal for CARS signal generation [33] [34]. In our case, the bandwidth condition is given by the spacing of the rotational lines, which is less than 1 cm-1 in N
2, thus pushing the previously
mentioned techniques to a challenging limit.
Monolithic devices are used in our case to shape both the amplitude and phase of the spectral profile. A volume Bragg grating (VBG) was used as a commercially available ultra-narrow amplitude filter [35]. The modulation of the refractive index, encoded in the thick trans-parent material, reflects a very thin part of the input spectrum that fulfills the Bragg condition. In our setup, a 10 mm thick VBG in photo-thermo-refractive (PTR) glass is used to generate a 0.7 cm-1 (FWHM)
pulse, as shown in Figure 4 (a).
Phase shaping was achieved using a 100 µm thick FPE that was added upstream from the VBG, to reduce the energy and peak power delivered to the latter. The linewidth of the FPE frequency comb is 1.8 cm-1, thus simplifying the superposition of the VBG reflection
peak on the FPE transmission peak. The amplitude profile at the out-put of the filtering stage is thus fully driven by the VBG filter. How-ever, the phase step that occurs at the FPE resonance peak is en-coded into the spectrum of the pulse, and enables the generation of a time-asymmetric probe pulse, as plotted in Figure 4 (b). The temporal profile of the probe pulse was obtained by recording the CARS signal of pure Ar while scanning the pump-probe delay over an adequate range (~100 ps) [16]. In this case, the nonresonant CARS signal is proportional to the instantaneous superposition of the short pump/Stokes excitation (~150 fs FWHM) with the long probe pulse (~30 ps FWHM), thus providing a simple way to sample the temporal intensity profile of the probe (Figure 4(b)).
The Fourier Transform of the temporal profile has been calculated, assuming a flat temporal phase. The intensity (dotted line) and the phase (thick solid line) of the spectrum are plotted in Figure 4 (a). Good agreement between the calculated intensity profile and the experimental spectrum (thin solid line) is observed, validating the flat temporal phase assumption. Moreover, the phase step that char-acterizes asymmetric pulses generated by FPE could be evaluated. As a result, this set of commercial filters enabled a well suited probe profile to be shaped, i.e., temporally asymmetric, and spectrally narrow enough to probe the rotational lines of N2 , as will be seen later on.
Laser beams generation
Light/matter interaction Detection
Yb:KGW Laser 1 mJ - 170 fs - 1 kHz 1030 nm 1167 nm (a) (b) (c) IF IF IF HWP PBS Dichroic CH4 Air FPE VBG MTS MTS HWP HWP 515 nm Spectral filtering Temporal synchroni-zation Spectral narrowing Mobile 120x75 cm optical table Spatial recombination 583.5 nm 114 cm-1 21 µJ 515 nm 130 cm-1 60 µJ BOXCARS 515 nm 0.7 cm-1 1 µJ OPA SHG
anti-Stokes Spectro-meter
CCD
Stokes Pump Probe
Figure 3 – Experimental setup: (a) laser beam generation, (b) light-matter interaction in the CH4 /air premixed flame with planar BOXCARS geometry, (c) anti-Stokes detection. OPA: Optical Parametric Amplifier, SHG: second harmonic generation, IF: interferential filter, PBS: polarizing beam splitter, HWP: half-wave plate, FPE: Fabry-Perot etalon, VBG: volume Bragg grating, MTS: motorized translation stage.
Characterization of the pump/Stokes excitation
The effective Raman bandwidth excited by the pump/Stokes pulses was measured by recording the nonresonant CARS signal in Ar. The spectral excitation profile (~100 cm-1 FWHM) centered on the N
2 first
vibrational band is shown in Figure 5. The amplitude distribution of the various ro-vibrational lines of N2 at flame temperature (~2500 K) is shown in blue for comparison. The excitation bandwidth is thus well suited for N2 spectroscopy in combustion, since the main intense vibrational bands, v=0→v'=1, v=1→v'=2 and v=2→v'=3, are included in the green excitation window in Figure 5.
This bandwidth is driven by the pump and Stokes spectral and tempo-ral profiles. Indeed, while Fourier transform limited pump and Stokes pulses allow the excitation of a large spectral range, a chirp on one pulse, which delays the frequencies contained in the optical spec-trum, may decrease the bandwidth, which is effectively excited, as illustrated in the spectrograms of Figure 6 (a). In our case, a com-mercial auto-correlator (Geco, LightConversion) is used to measure the pulse duration. The Stokes pulse proved to be Fourier transform limited, but a chirp was observed on the pump pulse. This aspect is investigated experimentally in Figure 6 (b), by monitoring the
Experimental spectrum 1.0 0.7 cm-1 Frequency (cm-1) 6 0.8 4 0.6 2 0.4 0
Intensity (a.u.) Phase (rad)
0.2 -2 0 -3 -2 -1 0 1 2 3 -4 -6 arg(FFT{l(t)}) |FFT{l(t)}|² 1.0 30 ps Pump/Probe delay (ps) 0.8 0.6 0.4 Intensity (a.u.) 0.2 0 -40 -20 0 20 40 60 80 (a) (b)
Figure 4 – (a) Spectral and (b) temporal characterization of the generated probe pulse through the filtering stage. (a) The experimental spectrum (thin solid line) is compared to the intensity (dotted line) and phase (thick solid line) of the Fourier transform of the temporal profile.
1.0 CARS signal of Ar N2 spectral lines Raman shift (cm-1) 0.8 0.6 0.4
CARS signal (u.a.)
0.2 0.0 2220 2240 2260 v=2 → v'=3 v=1 → v'=2 v=0 → v'=1 2280 2300 2320 2340 2360
Figure 5 – Nonresonant CARS signal of Ar (green filled curve), illustrating the bandwidth effectively excited by pump and Stokes pulses, compared to the theoretical CARS spectrum of N2 in a flame (blue lines).
Stokes Pump
No chirp Chirp on pump
Excited vibration time time Frequency 0 0 -t 0 0 -t0 Ω (a) Pump/Stokes interaction in Ar 35000 30000 25000 2400 20000 15000 10000 5000 0 -400 -300 -200 -100 0 100 200 300 400 2300 2200 2100 Pump/Stokes delay (fs) Raman Shift (cm-1) CCD hits (b)
Figure 6 – Effect of a chirp on the CARS spectrum. (a) Illustration of the vibra-tion range excited by a Fourier transform Stokes pulse and a Fourier transform (left), or chirped (right), pump pulse. (b) Experimental CARS spectrum (verti-cal) collected in Ar versus the pump/Stokes delay (horizontal).
location of the Ar CARS signal when the pump/Stokes delay is scanned. This effect was used in order to finely tune the excitation profile in the selected spectral range, by adjusting the pump/Stokes delay. In addition, it is important to quantify the chirp of the CARS excitation pulses in order to accurately simulate the CARS spectrum. Indeed, it may influence the temporal dephasing of the various excited coherences and thus the shape of the final spectrum, as will be seen later on. Finally, compensating techniques can be implemented to in-crease the excitation window.
N
2spectroscopy
Ro-vibrational signature in the hybrid ps/fs regime
Resolving the ro-vibrational band structure
A major species of interest for thermometry is N2. CARS spectra of N2 were recorded in ambient air and in a CH4 / air flame, in or-der to evaluate the performances of the setup for thermometry. Figure 7 shows the experimental spectra recorded (a) in the ns-regime, which represents for us a typical reference spectrum, and (b) in the hybrid fs/ps-regime. An enlargement of the fundamen-tal band of the Q-branch (2300-2335 cm-1) is shown, to outline
the rotational features provided by the two techniques. It appears that the two regimes allow both the vibrational and the rotational structures to be seen: three vibrational bands (v = 0 → v' = 1, v = 1→ v' = 2 and v = 2 → v' = 3) can be distinguished in the hot spectra, each one being composed of well-resolved rotational
lines, with characteristic 1/4 alternation amplitude of the even/ odd lines [36]. It is of major importance in the diagnostics of non-equilibrium media that the two population distributions, cor-responding to vibrational and rotational temperatures, are able to be measured independently [20].
As in ns-CARS, the sensitivity of hybrid fs/ps-CARS to temperature can be appreciated by comparing the hot and cold spectra. In ambi-ent air (in blue), the signal is restricted to a 15 cm-1 spectral range
centered on the first rotational lines of the fundamental band, whereas in the hot spectra (in red) rotational lines are distributed over three vi-brational bands. The performance of hybrid fs/ps-CARS ro-vivi-brational thermometry is thus expected to be comparable to that obtained in ns-CARS, since a similar type of information can be retrieved from the spectra.
Coherent beating of the Raman lines
As mentioned before, one of the specificity of hybrid fs/ps-CARS over traditional ns-CARS is the ability to separate the process into two steps. We consider that the fast excitation of the ro-vibrational coher-ences through pump and Stokes pulses can be separated from the medium interrogation by the probe pulse in the second step. In the gas phase, introducing a delay τ between these two steps is allowed, since the lifetime of the coherences (~few 100 ps to few ns) is large compared to the duration of the probe pulse (30 ps) [22]. This allows some limitations of ns-CARS to be circumvented, such as nonreso-nant background interference [21], as well as enabling new measure-ment strategies to be found [23].
2360 2340 2320 2300 2280 2200 0.0 0.2 0.4 0.6 0.8 1.0 2240 2220 2260
CARS signal (a.u.)
CARS signal (a.u.)
N2 flame N2 flame N2 ambiant N2 ambiant 2335 2330 2325 2320 2300 0.0 0.2 0.4 0.6 0.8 1.0 2310 2305 2315 Raman shift (cm-1) Raman shift (cm-1) 2360 2340 2320 2300 2280 2200 0.0 0.2 0.4 0.6 0.8 1.0 2240 2220 2260 2335 2330 2325 2320 2300 0.0 0.2 0.4 0.6 0.8 1.0 2310 2305 2315 Raman shift (cm-1) Raman shift (cm-1)
CARS signal (a.u.)
CARS signal (a.u.)
N2 flame
N2 flame
N2 ambiant
N2 ambiant
(a) (b)
Figure 7 – Comparison of (a) ns-CARS and (b) the hybrid fs/ps-CARS spectra of the N2 Q-branch obtained in ambient air (blue) and in flame (red). Bottom: enlargement of the fundamental vibrational band.
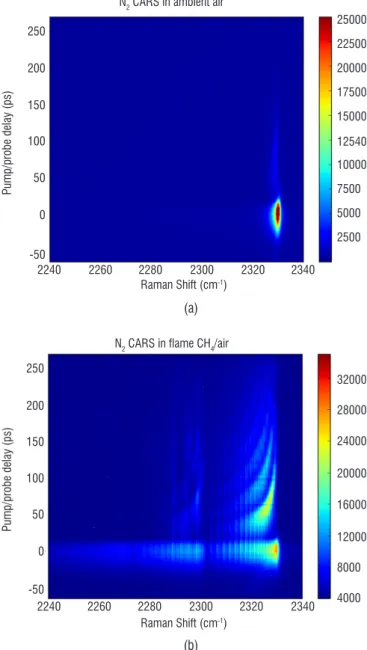
In Figure 8, the probe pulse delay is continuously scanned from -70 to 270 ps on the vertical axis using motorized delay lines. The CARS spectrum is monitored along the horizontal axis in am-bient air, Figure 8 (a), and in the flame, Figure 8 (b). The zero delay position reported in the 2D plot is experimentally checked by maximizing the nonresonant signal. As previously observed in hybrid fs/ps CARS [15] [34] [23] [37] [31], periodic extinctions and revivals of the signal appear at positive delays, more particu-larly in Figure 8 (b), in which a broader range of ro-vibrational lines is populated by temperature.
In order to follow the modulation of individual Raman lines versus the pump/probe delay, an enlargement of the fundamental band is shown in Figure 9 (a). The evolution of the CARS amplitude at specific Ra-man shifts, corresponding to several rotational lines (11< J <37), is shown in Figure 9 (b). A rising edge is first observed at zero delay, when the probe coincides with the pump/Stokes excitation, which contains resonant and nonresonant contributions to the signal.
As the probe delay increases, the nonresonant contribution disap-pears, and the resonant amplitude decays due to the finite lifetime of the coherences. Moreover, the CARS signal exhibits a sinusoidal pattern, whose amplitude and period decrease as a function of the quantum number J.
This behavior is attributed to interferences between rotational lines that occur in the hybrid fs/ps regime, as has already been observed by many authors [12] [37] [34] [23] [31] [38]. Indeed, as illustrat-ed by Figure 10 (a), the multiples ro-vibrational coherences ωαβ are excited simultaneously by pump and Stokes pulses. Then, during the free evolution that follows, the phase of each coherence evolves at its own frequency ωαβ , thus becoming dephased and rephased with respect to each other (Figure 10 (b)). Finally, during the inter-rogation step operated by the probe pulse, the contributions of the various lines may overlap, depending both on the line separation N2 CARS in ambient air
20000 25000 17500 22500 15000 250 50 12540 10000 7500 5000 2500 2240 2260 2280 2300 2320 2340 200 0 150 -50 100 Pump/probe delay (ps) Raman Shift (cm-1) (a)
N2 CARS in flame CH4/air
24000 32000 20000 28000 16000 250 50 12000 8000 4000 2240 2260 2280 2300 2320 2340 200 0 150 -50 100 Pump/probe delay (ps) Raman Shift (cm-1) (b)
Figure 8 – Experimental investigation of the N2 CARS spectrum (horizontal axis) evolution versus the pump/probe delay (vertical axis) (a) in ambient air, and (b) in a CH4 /air flame.
24000 32000 20000 28000 16000 250 50 12000 8000 4000 2305 2310 2315 2320 2325 2330 200 0 150 -50 100 Pump/probe delay (ps) Raman Shift (cm-1) (a) Pump/probe delay (ps) CARS signal -50 0 50 100 150 200 250 35 J 30 25 2015 1.2 1.0 0.8 0.6 0.4 0.2 0.0 (b)
Figure 9 – (a) Evolution of the N2 CARS spectrum (horizontal axis) centered on the fundamental vibrational band versus the pump/probe delay (vertical axis). (b) Evolution of the CARS intensity of the various rotational lines J of the fundamental vibrational band versus pump/probe delay.
and the probe linewidth. Consequently, they interfere constructively or destructively, depending on whether they are in or out of phase, and as a result the anti-Stokes intensity is modulated as plotted in Figure 10 (c).
Laser pulses temporal sequence: Anti-Stokes intensity: Pump Constructive Constructive Probe Stokes
Evolution of the molecular coherences: (a) τ (b) (c) t t t 1/Δw w00 w11 Destructive
Figure 10 – (a) Typical laser sequence of the hybrid fs/ps-CARS process in-volving pump, Stokes and probe pulses. (b) Illustration of the dephasing and rephasing that occur between two ro-vibrational coherences, ω00 and ω11,
when the pump/probe delay τ evolves. (c) Effect of the dephasing on the
anti-Stokes intensity when the contributions at ω00 and ω11 interfere: a modulation
is observed with a period of 1/Δω, where Δω=|ω00– ω11|.
In order to determine the modulation period, the Fourier Transform of the temporal evolution of the even Raman lines is processed in Figure 11 (a). For each J number, a main peak is observed at nonzero wavenumber, which corresponds to the modulation observed in the temporal domain. In Figure 11 (b), the peak spectral position is plotted as a function of the J value. It must be compared to the local spectral interval between rotational lines, which is calculated and also plotted along the vertical axis. It is given at first order in J by the expression:
(
)
2 e J 1
w α
∆ = + (1)
where αe is the rotation-vibration coupling constant. The good agree-ment between calculations and experiagree-ment confirms the possibility of using the hybrid fs/ps regime to perform spectroscopy with a resolu-tion better than the probe linewidth (0.7 cm-1). Moreover, this
interfer-ence pattern can be used as a spectral filter, in order to selectively at-tenuate or enhance specific spectral zones, as proposed by [23] [24].
Nonresonant background rejection
In the hybrid fs/ps regime, nonresonant background interference can be reduced by using a pump/probe delay [34], [33] [39] [28], as well as by crossing the polarizations of the pump, Stokes and probe beams, as has previously been done in ns-CARS spectroscopy [40] [41] [1]. CARS spectra in the CH4/air flame have been recorded for three polarization configurations for the pump, Stokes and probe giv-en in Figure 12 (a), (b) and (c). A Glan-polarizer is added upstream from the spectrometer to analyze the anti-Stokes signal.
The first configuration corresponds to parallel polarizations; the second one corresponds to the conventional technique of a 60° rotated Stokes [1] [42]; in the third one, the probe polarization is orthogonal to those of the pump and Stokes. In the three cases, the orientation of the anti-Stokes analyzer has been rotated every 10°, and CARS spectra have been acquired at each position, with 0° referring to the pump polarization direction. Typical spectra at the maximum and minimum CARS signal amplitude are shown in Figure 12 (a), (b) and (c). Because of a poor signal-to-noise ratio, due to the high degree of polarization of the anti-Stokes beam, the spec-trum of Figure 12 (a) is given at 80° while extinction occurs at 90°, and the spectrum of Figure 12 (c) is given at 10° while extinction occurs at 0°. The amplitudes of the resonant (R) and nonresonant (NR) contributions are estimated using the CARS intensity at 2330 cm-1 and 2360 cm-1 respectively, and are shown in Figure 12 (d), (e)
and (f). As expected, R and NR contributions appear respectively in phase and in quadrature for the parallel and the 60° rotated Stokes configuration schemes. This is illustrated in the CARS spectra, which show no distortion for the parallel case (Figure 12 (a)), and whose R and NR relative weight evolves in an opposite way to that of the 60°-Stokes (Figure 12 (b)), when the Glan analyzer is turned. It can be noticed that almost no NR contribution is observed in the 90°-crossed probe scheme and that the spectrum remains unaf-fected by nonresonant interference when the analyzer is crossed with respect to the probe. Indeed, CARS acquisitions in Ar with the parallel and the 90°-crossed probe configurations revealed that the latter permits the NR amplitude to be reduced by a factor of 8, while the resonant amplitude remained at similar level.
FFT amplitude (a.u.) 1.0 1.0 10 14 12 16 1.2 0.8 0.8 0.6 0.6 0.4 0.4 0.2 0.0 Wavenumber (cm -1) 18 J 22 20 2426 28 Line spacing
Spectral position of the modulation peak
wavenumber (cm -1) J 1.0 10 15 1.2 0.8 0.6 0.4 20 25 30 (a) (b)
Figure 11 – Spectral analysis of the rotational line modulation on the first vibrational band. (a) Spectral modulation peak obtained by Fourier transform of the line CARS intensity temporal evolution as a function of the rotational quantum number J, and (b) comparison of the peak position (triangle) obtained experimentally with the local spectral interval between two successive Raman lines (circle), calculated using spectroscopic constants, as a function of J.
90° 0° 5000 0 1500 500 2000 1000 2500 0 25000 10000 30000 15000 0° 80° (averaged) 35000 20000 40000 2240 2260 2280 2300 2320 2340 2360 2380 Raman Shift (cm-1) anti-Stokes polarizer Pump Stokes Probe CDD counts CCD counts 0.0 -50 0 50 80 0.4 0.8 0.2 0.6 1.0 resonant nonresonant x 30
Anti-Stokes Glan polarizer orientation (°)
(a) (d) 90° 0° 30° 90° (averaged) Raman Shift (cm-1) 2000 4000 6000 8000 10000 0 2240 2260 2280 2300 2320 2340 2360 2380 anti-Stokes polarizer Pump Stokes (60°) Probe 0 300 100 400 600 200 500 700 CDD counts CCD counts -50 0 30 50 90 resonant nonresonant x 15 0.0 0.4 0.8 0.2 0.6 1.0 1.2
Anti-Stokes Glan polarizer orientation (°)
(b) (e) Raman Shift (cm-1) 2240 2260 2280 2300 2320 2340 2360 23800 300 100 400 200 500 5000 0 25000 10000 30000 15000 35000 20000 Probe (90°) Pump Stokes 90° 0° anti-Stokes polarizer 10° (averaged) 90° CCD counts CDD counts
Anti-Stokes Glan polarizer orientation (°)
-50 0 10 50 90 resonant nonresonant x 100 0.0 0.4 0.8 0.2 0.6 1.0 (c) (f)
Figure 12 – N2 CARS spectra at maximum and minimum signal amplitude obtained by rotating Glan-analyzer (a) parallel beams, (b) 60°-rotated Stokes, and (c) 90°-crossed probe. Resonant (blue circles) and nonresonant (green circles) contributions recorded for the 3 configurations are displayed in (d), (e) and (f).
2D plots of the CARS spectra of N2 in a flame versus probe delay are shown in Figure 13 (a) for parallel polarizations, and in Figure 14 (a) for the crossed-probe configuration. At zero delay, a nonresonant contribution appears at the foot of the resonant line pattern only for parallel polarization. This can be seen in the spectra extracted from the dataset at 0 and 25 ps, shown in Figure 13 (b) and Figure 14 (b), in which the NR amplitude at 2360 cm-1 is always zero for the
crossed-probe polarization. Moreover, the zero delay spectrum for the crossed polarization shows no distortion by NR contribution, while its shape at 25 ps is very similar to that obtained in the parallel configuration, since the signal is assumed to be purely resonant at this probe delay. The crossed-probe configuration is observed to drastically attenuate the NR background, while the R signal is maintained. Attenuation is even stronger than expected from the conventional calculations [1], and thus attributed to the short pulse regime properties. Moreover, resonant contributions are maintained in this case, whereas a probe delay may lead to spectral distortions as a result of coherent line interferences. In-deed, polarization configuration, achieved using the 3 beam excitation of the hybrid regime, may provide a strong attenuation of the two photon
absorption (TPA) contributions to the CARS signal (Figure 2 (e)), thereby acting in favor of the R/NR ratio optimization. This should increase the mea-surement accuracy, since the temperature information is mainly enclosed in the resonant part, which is sensitive to the Boltzmann distribution. More-over, a temperature estimation procedure should gain reliability, since the nonresonant contribution amplitude is usually left as a free parameter of the fit, or estimated from an assumption about the chemical composition of the medium, which introduces a bias in the measurement. Other polarization configurations will be studied in the future, in our laboratory.
Theoretical model and experimental spectra
Description of the model
We use a frequency-domain model equivalent to that reported by Stauffer et al. [37]. In the time-domain, the CARS amplitude is obtained by multiplying the probe pulse amplitude by the molecu-lar response, convolved with the pump/Stokes excitation profile. We calculate the CARS amplitude as a function of the Raman shift
20000 40000 25000 15000 35000 250 50 25 0 10000 30000 5000 200 0 150 -50 100 Pump/probe delay (ps) CDD counts Raman Shift (cm-1) 2240 2260 2280 2300 2320 2340 2360 2380 CDD counts 20000 15000 5000 0 10000 2240 2260 2280 2300 2320 2340 2360 2380 Pump StokesProbe Raman Shift (cm-1) Δt = 0 ps Δt = 25 ps (a) (b)
Figure 13 – N2 CARS spectra recorded with vertical pump, Stokes and probe polarizations. (a) Evolution of the spectrum (horizontal axis) with the probe delay (vertical axis). The two dashed lines indicate the 0 and 25 ps delays. (b) Spectra recorded at the 0 and 25 ps probe delay
20000 40000 25000 15000 35000 250 50 25 0 10000 30000 5000 200 0 150 -50 100 Pump/probe delay (ps) CDD counts Raman Shift (cm-1) 2240 2260 2280 2300 2320 2340 2360 2380 CDD counts 5000 10000 15000 20000 2240 2260 2280 2300 2320 2340 2360 2380 Pump Stokes Probe Raman Shift (cm-1) (90°) Δt = 0 ps Δt = 25 ps 0 (a) (b)
Figure 14 – N2 CARS spectra recorded with vertical pump and Stokes, and horizontal probe polarizations. (a) Evolution of the spectrum (horizontal axis) with the probe delay (vertical axis). The two dashed lines indicate the 0 and 25 ps delays. (b) Spectra recorded at the 0 and 25 ps probe delay.
ω = ωpump - ωStokes, by convolving two terms: the molecular excitation, Aexcitation(ω,τ), which takes into account the pump/probe delay τ, and the probe spectrum Aprobe(ω). The CARS intensity is thus given by:
(
)
(
)
( )
2, ,
CARS excitation probe
I w τ = A w τ ⊗A w (2)
Modeling of the molecular excitation
The molecular excitation Aexcitation(ω,τ) is expressed as the nonlinear susceptibility χ(3)(ω), weighted by the effective spectral profile H(ω)
of the pump/Stokes excitation, and dephased by a term ϕ(ω,τ) that takes into account the free evolution of the coherences during the pump/probe delay τ:
Aexcitation(ω,τ) = H(ω) χ(3)(ω)ϕ(ω,τ) (3)
The third order susceptibility χ(3)(ω) is composed of resonant and
nonresonant contributions. The resonant amplitude depends on the pump, Stokes and probe polarizations, on the temperature, and the number density [1] [43]. Raman cross-sections, together with Dop-pler and collisional line broadening, are needed to properly simulate the profile. The resonant CARS susceptibility χR( )3
( )
w is a sum of thenearby Raman lines expressed by [43]:
( )3
( )
. . . , 2 2. R Doppler Doppler d i W i d αβ αβ αβ αβ αβ σ π w w χ w ρ σ σ − − Γ = ∆ Ω ∑
(4) where:- α and β are two ro-vibrational levels coupled by a Raman al-lowed transition, - d d αβ σ Ω
is the spontaneous Raman cross-section of the
α → β transition,
- ωαβ is the Raman shift of the α → β transition,
- Δραβ is the population difference between the α and β levels, which is a function of temperature (Boltzmann distribution), - Γαβ stands for the collisional broadening of the α → β
transi-tion, the linewidths Γαβ were taken from a fit of N2 lines with an energy gap law standing for collisional effects including motional narrowing [44],
- σDoppler is the Doppler broadening,
-
(
)
2 t i e W a ib dt a t ib π +∞ − −∞ + = − +∫
is the complex error function, giving the spectral profile of each transition [43] considered as a complex Voigt profile resulting from Doppler and collisional effects.Apart from the resonant CARS signal, a nonresonant background is generated, which is modeled as a constant scalar χ( )NR3 , potentially complex [37]. The whole susceptibility χ(3)(ω) is thus obtained by:
( )3
( )
( )3( )
( )3
R NR
χ w =χ w +χ (5) The excitation amplitude profile H(ω) is introduced to take into ac-count the finite excitation bandwidth of the pump and Stokes pulses.
It has been modeled by a real profile, since the dephasing between the different spectral parts, which can be nonzero due to the chirp of the pump pulse, is assumed to be negligible in our case. Indeed, the 2D plot in Figure 8 shows that all Raman lines are located at the same delay τ = 0 along the abscissa, thus proving that coherences are not delayed significantly with respect to each other. Indeed, the excitation time window is limited to ~150 fs by the short duration of the Stokes pulse. In comparison, the smallest temporal modulation period ob-served in the Raman lines, estimated to be of about 20 ps in Figure 8, is thus two orders of magnitude larger than the excitation window. In Figure 15, two different experimental conditions are shown. The pump/Stokes excitation profiles are shifted by 40 cm-1 to outline the
effect on the CARS spectrum. Experimentally, excitation profiles are obtained by recording the CARS signal in Ar and by adjusting the temporal shift of the pump, thus providing |H(ω)|².
CARS spectrum excitation profile Normalized intensity Raman Shift (cm-1) 0.0 0.4 0.8 0.2 0.6 1.0 2240 2260 2280 2300 2320 2340 2360 2380 (a) 2240 2260 2280 2300 2320 2340 2360 2380 CARS spectrum excitation profile Normalized intensity Raman Shift (cm-1) 0.0 0.4 0.8 0.2 0.6 1.0 (b)
Figure 15 – CARS experimental spectra (blue) acquired over 5000 shots in a premixed CH4/air flame, with pump/Stokes excitation profiles |H(ω)|²
(dashed line) centered at (a) 2320 cm-1 and (b) 2280 cm-1.
The dephasing term ϕ(ω,τ) is used to model the free evolution of the coherences during the time delay τ separating the excitation and the probing. It is expressed by:
(
,)
eiwτφ w τ = (6)
Finally, the complete molecular excitation is expressed by:
(
,)
( ) ( )
iexcitation
Modeling of the probing step
During this step, the probe spectral pattern Aprobe(ω) is convoluted to the molecular excitation Aexcitation(ω,τ), in order to produce the CARS spectrum. The final resolution is thus driven by the spectral width of the probe. In the temporal domain simulation, the crucial parameter is shown to be the pulse duration. The latter corresponds to the tem-poral window in which the molecular response is probed [37]. Finally, the CARS intensity can be expressed as follows:
( )
( ) ( )
( )
2i
CARS probe
I w = H w χ w ewτ⊗A w (8) Since the probe spectral pattern is much narrower than the excitation profile, the factor H(ω) can be extracted from the convolution product and the calculation is implemented as follows:
( )
( )
2( )
( )
2i
CARS probe
I w = H w ⋅χ w ewτ⊗A w (9)
The probe spectrum Aprobe(ω) is measured (Figure 4 (a), thin solid line) and adjusted to fit a Voigt profile. However, a proper approach may be to consider the full complex amplitude of the probe spectrum, which can be obtained by recording the spectral shape with a spec-trometer, and/or a combination of interferometric techniques such as FROG [45]. The excitation profile |H(ω)|² is obtained by measur-ing the nonresonant response in Ar, as detailed previously. An overall view of the algorithm, including the convolution by apparatus function of the spectrometer, is summed up in Figure 16.
Temperature measurements
The temperature is measured by comparing the experimental spec-trum to a set of simulated spectra. A least-square algorithm, run over a bank of spectra, simulated by varying the temperature in 10 K steps and normalized to the unit maximum, leads to the best fit. The free parameter of the fit is thus the temperature, whereas the pump/probe delay and the nonresonant background amplitude are fixed. The least-square minimization range is chosen between 2250 cm-1 (lowest line
of v=2 band) and 2350 cm-1, which provides information on both the
R and NR contributions, as illustrated in Figure 5. In particular, it en-ables the choice of the fixed NR amplitude to be validated a posteriori. The accuracy of the thermometric setup has been tested on two sets of experimental data at zero probe delay. The first set is a stack of 1000 single shots spectra, acquired at a repetition rate of 1 kHz in ambient air. The second one is composed of 100 spectra recorded in a premixed-CH4/air flame with equivalent ratio ϕ = 1.0 at atmospheric pressure. Each hot spectra is averaged over 500 shots, in order to reach a signal-to-noise ratio (SNR) beyond 120. The criticality of the SNR in hybrid fs/ps-CARS has been recently investigated by Kearney [46]. The probe delay parameter has been respectively fixed to 5.5 ps and 1.5 ps for the first and the second set, due to a small variation in the optical paths during the laser beam alignment.
Figure 17 and Figure 18 show a typical experimental spectrum (blue) superposed to its best fit (green). Temperature histograms, represented in Fig. 17 (b) and Fig. 18 (b), have been processed and were used to quantify the mean temperature T , standard deviation σT , and relative precision defined by the σT / T ratio, which quantifies Loading of: , , Doppler d d αβ αβ αβ σ ρ σ ∆ Ω Γ computation χ(3) R(ω) +χ(3)
NR ⋅eiwτ ⊗Aprobe
( )
w 2 ⊗functionapparatus ⋅ Η( )
w 2Figure 16 – Schematic view of the hybrid fs/ps-CARS simulation algorithm
2240 2260 2280 2300 2320 2340 2360 2380 experiment simulation (1960 K) residual Normalized intensity Raman Shift (cm-1) 0.0 0.4 0.8 0.2 0.6 1.0 1850 1900 1950 2000 2050 Occurences Temperature (K) 2 0 6 12 4 10 8 14 (a) (b)
Figure 17 – CARS thermometry in a CH4 /air flame. (a) Typical experimental spectrum (blue), average best fit (green), and residual contribution (black) down-shifted by 0.1 along the vertical axis. (b) Temperature histogram: T = 1960 K, σT = 35 K
the repeatability of the measurement. In ambient air and in the flame, the estimated mean temperatures were respectively 295 and 1960 K, with corresponding precisions of 5.2% (15 K) and 1.7% (35 K). The temperature in the flame was measured to be slightly lower than the adiabatic CH4 /air flame temperature (~2200 K). This was attributed to experimental misalignment of the probed volume in the flame, and to nonzero pump/probe delay adjustment. This measurement will be reproduced in a better controlled flame and using a well-calibrated procedure to accurately and rapidly control the pump/probe delay. It is comparable to the few percent precision obtained with hybrid fs/ ps rotational CARS [46], fs-CPP-CARS [47], and ns-CARS [48] in a flame. To go further in the characterization of the techniques, single shot thermometry at low and high temperatures would be of great significance, in order to avoid integrating spectra over the flame temperature fluctuations. This new process in our setup development would require a more energetic probe, whose small bandwidth is currently achieved at the expense of an important loss of energy, due to the filtering technique used. Using nonlinear techniques [32], so as to achieve more efficient narrowing, would be one way to achieve this goal.
Perspectives and conclusion
In summary, hybrid fs/ps-CARS was used to properly resolve ro- vibrational structures of the Q-branch of N2 . The resolution was good enough to observe both rotational and vibrational features in a single spectrum, as had already been done in ns-CARS, thus opening the way to instantaneous rotational and vibrational temperature measure-ments. Moreover, time domain spectroscopy was used, in order to resolve sub-probe bandwidth details in the spectrum.
Temperature measurements were performed in the flame, by com-paring simulations to experiments, with good accuracy. The model will be improved by taking into account non-diagonal elements of the relaxation matrix, i.e., motional narrowing effects. The calculation of motional narrowing in hybrid fs/ps-CARS is under study, in order to achieve our final objective, which is to probe both high pressure and high temperature media. The long probe duration that is required for spectral resolution will be further combined to an increase in the en-ergy of the probe, to achieve single shot measurements
2240 2260 2280 2300 2320 2340 2360 2380 experiment simulation (295 K) residual Normalized intensity Raman Shift (cm-1) 0.0 0.4 0.8 0.2 0.6 1.0 240 260 280 300 320 340 360 Occurences Temperature (K) 50 0 100 250 200 150 300 (a) (b)
Figure 18 – CARS thermometry in ambient air. (a) Typical experimental spectrum (blue), average best fit (green), and residual contribution (black) downshifted by 0.1 along the vertical axis. (b) Temperature histogram: T = 295 K, σT = 15 K
Acknowledgments:
Frederic Grisch is greatly thanked for his constant support and advice regarding both the experiments and the simulations. We also thank Hans Stauffer and Sean Kearney, who helped us to clarify important theoretical aspects through fruitful discussions.
We are grateful to Jean Pierre Faleni and Thomas Schmid for their technical assistance with the burner design and gas supply.
Funding was provided by the SESAME program of the Conseil Régional d’Ile de France (13016393), thanks to which part of the equipment was obtained.
References
[1] S.A.J. DRUET and J.-P.E. TARAN - CARS Spectroscopy. Prog.Quant. Electronics, vol. 7, p. 1, 1981.
[2] S.A.J. DRUET, B. ATTAL, T.K. GUSTAFSON and J.P. TARAN - Electronic Resonance Enhancement of Coherent Anti-Stokes Raman Scattering. Physical Review A, vol. 18, no. 4, p. 1529, 1978.
[3] BLOEMBERGEN - Nonlinear Optics. 31977th ed.: WA Benjamin New York, 1965.
[4] A.C. ECKBRETH - Laser Diagnostics for Combustion Temperature and Species. 2nd ed. Amsterdam: Gordon and Breach Publishers, 1996.
[5] P.D. MAKER and R.W. TERHUNE - Study of Optical Effects Due to an Induced Polarization Third Order in the Electric Field Strength. Phys. Rev, vol. 137, no. 3A, p. A801, 1965.
[6] P.R. REGNIER and J.P.-E. TARAN - On the Possibility of Measuring Gas Concentrations by Stimulated Anti-Stokes Scattering. Applied Physics Letters, vol. 23, p. 240, 1973.
[7] W.B. ROH, P.W. SCHREIBER and J.P.-E. TARAN - Single-Pulse Coherent Anti-Stokes Raman Scattering. Single-pulse Coherent anti-Stokes Raman Scattering, vol. 29, no. 3, p. 174, 1976.
[8] S. ROY, P.S. HSU, N. JIANG, M.N. SLIPCHENKO and J.R. GORD - 100-kHz-Rate Gas-Phase Thermometry Using 100-Ps Pulse from a Burst-Mode Laser. Optics Letters, vol. 40, no. 21, p. 5125, 2015.
[9] S. ROY, W.D. KULATILAKA, D.R. RICHARDSON, R.P. LUCHT and J.R. GORD - Gas-Phase Single-Shot Thermometry at 1 kHz Using Fs-CARS Spectroscopy. Optics Letters, vol. 34, no. 24, p. 2857, 2009.
[10] C.C. HAYDEN and D.W. CHANDLER - Femtosecond Time-Resolved Studies of Coherent Vibrational Raman Scattering in Large Gas-Phase Molecules.. The Journal of Chemical Physics, vol. 103, no. 24, p. 10465, 1995.
[11] P. BEAUD, H.-M. FREY, T. LANG and M. MOTzKUS - Flame Thermometry by Femtosecond CARS. Chemical Physics Letters, vol. 344, p. 407, 2001. [12] B. LAVOREL, H. TRAN, E. HERTz, O. FAUCHER, P. JOUBERT, M. MOTzKUS, T. BUCKUP, T. LANG, H. SKENDEROVI, G. KNOPP, P. BEAUD and H.M. FREY -
Femtosecond Raman Time-Resolved Molecular Spectroscopy. Comptes Rendus Physique, vol. 5, p. 215, 2004.
[13] S. ROY, T. MEYER and J.R. GORD - Broadband Coherent Anti-Stokes Raman Scattering Spectroscopy of Nitrogen Using a Picosecond Modeless Dye
Laser. Optics Letters, vol. 30, no. 23, p. 3222, 2005.
[14] W. zINTH - Transcient Coherent Raman Scattering in the Time and Frequency Domain. Optics Communications, vol. 34, no. 3, p. 479, 1980. [15] B.D. PRINCE, A. CHAKRABORTY, B.M. PRINCE, and H.U. STAUFFER - Development of Simultaneous Frequency- and Time-Resolved Coherent
Anti-Stokes Raman Scattering for Ultrafast Detection of Molecular Raman Spectra. The Journal of Chemical Physics, vol. 125, p. 044502, 2006.
[16] J.D. MILLER, S. ROY, M.N. SLIPCHENKO, J.R. GORD, and T.R. MEYER - Single-Shot Gas-Phase Thermometry Using Pure-Rotational Hybrid
Femtosecond-Picosecond Coherent Anti-Stokes Raman Scattering. Optics Express, vol. 19, no. 16, p. 15627, 2011.
[17] J.D. MILLER, M.N. SLIPCHENKO, T.R. MEYER, H.U. STAUFFER, and J.R. GORD - Hybrid Femtosecond/Picosecond Coherent Anti-Stokes Raman
Scattering for High-Speed Gas-Phase Thermometry. Optics Express, vol. 35, no. 14, p. 2430, 2010.
[18] A. BOHLIN and C.J. KLIEWER - Two-Beam Ultrabroadband Coherent Anti-Stokes Raman Spectroscopy for High Resolution Gas-Phase Multiplex
Imaging. Applied Physics Letters, vol. 104, p. 031107, 2014.
[19] A. BOHLIN and C.J. KLIEWER - Communication: Two-Dimensional Gas-Phase Coherent Anti-Stokes Raman Spectroscopy (2D-CARS): Simultaneous
Planar Imaging and Multiplex Spectroscopy in a Single Laser Shot. The Journal of Chemical Physics, vol. 138, p. 221101, 2013.
[20] D. MESSINA, B. ATTAL-TRETOUT and F. GRISCH - Study of a Non-Equilibrium Pulsed Nanosecond Discharge at Atmospheric Pressure Using Coherent
Anti-Stokes Raman Scattering. Proceedings of the Combustion Institute, vol. 31, no. 1, p. 825, 2007.
[21] W. zINTH, A. LAUBEREAU and W. KAISER - Time Resolved Observation of Resonant and Non-Resonant Contributions to the Nonlinear Susceptibility. Optics Communications, vol. 26, no. 3, p. 457, 1978.
[22] F.M. KAMGA and M.G. SCEATS - Pulse-Sequenced Coherent Anti-Stokes Raman Scattering Spectroscopy: A Method for Suppression of the Nonresonant
Background. Optics Letters, vol. 5, no. 3, p. 126, 1980.
[23] J.D. MILLER, C.E. DEDIC and T.E. MEYER - Vibrational Femtosecond/Picosecond Coherent Anti-Stokes Raman Scattering with Enhanced Temperature
Sensitivity for Flame Thermometry from 300 to 2400 K. Journal of Raman Spectroscopy, vol. 46, p. 702, 2015.
[24] M. SCHERMAN, M. NAFA, T. SCHMID, A. GODARD, A. BRESSON, B. ATTAL-TRETOUT and P. JOUBERT - Rovibrational Hybrid fs/ps CARS Using a
Volume Bragg Grating for N2 Thermometry. Optics Letters, vol. 41, no. 3, p. 488, 2016.
[25] A.C. ECKBRETH - BOXCARS: Crossed-Beam Phase-Matched CARS Generation in Gases. Applied Physics letters, vol. 32, p. 421, 1978.
[26] D. ORON, N. DUDOVICH, D. YELIN AND Y. SILBERBERG - Narrow-Band Coherent Anti-Stokes Raman Signals from Broad-Band Pulses. Physical Review Letters, vol. 88, no. 6, p. 063004, 2002.
[27] S. ROY, P. WRzESINSKI, D. PESTOV, T. GUNARATNE, M. DANTUS and J.R. GORD - Single-Beam Coherent Anti-Stokes Raman Scattering Spectroscopy
of N2 Using a Shaped 7 Fs Laser Pulse. Applied Physics Letters, vol. 95, p. 074102, 2009.
[28] S.O. KONOROV, M.W. BLADES and R.F.B. TURNER - Lorentzian Amplitude and Phase Pulse Shaping for Nonresonant Background Suppression and Enhanced
[29] O. KATz, J.M. LEVITT, E. GRINVALD and Y. SILBERBERG - Single-Beam Coherent Raman Spectroscopy and Microscopy via Spectral Notch Shaping. Optics Express, vol. 18, no. 22, p. 22693, 2010.
[30] V. KUMAR, R. OSELLAME, R. RAMPONI, G. CERULLO and M. MARANGONI - Background-Free Broadband CARS Spectroscopy from a 1-MHz Ytterbium Laser. Optics Express, vol. 19, no. 16, p. 15143, 2011.
[31] S.P. KEARNEY, D.J. SCOGLIETTI and C.J. KLIEWER - Hybrid Femtosecond/Picosecond Rotational Coherent Anti-Stokes Raman Scattering Temperature
and Concentration Measurements Using Two Different Picosecond-Duration Probes. Optics Express, vol. 21, no. 10, p. 12327, 2013.
[32] S.P. KEARNEY and D.J. SCOGLIETTI - Hybrid Femtosecond/Picosecond Rotational Coherent Anti-Stokes Raman Scattering at Flame Temperatures
Using a Second-Harmonic Bandwidth-Compressed Probe. Optics Letters, vol. 38, no. 6, p. 833, 2013.
[33] J.D. MILLER, M.N. SLIPCHENKO and T.R. MEYER - Probe-Pulse Optimization for Nonresonant Suppression in Hybrid fs/ps Coherent Anti-Stokes Raman
Scattering at High Temperature. Optics Express, vol. 19, no. 4, p. 13326, 2011.
[34] H.U. STAUFFER, J.D. MILLER, S. ROY, J.R. GORD and T.R. MEYER - Hybrid Femtosecond/Picosecond Rotational Coherent Anti-Stokes Raman Scattering
Thermometry Using a Narrowband Time-Asymmetric Probe Pulse. The Journal of Chemical Physics, vol. 136, no. 11, p. 111101, 2012.
[35] J. LUMEAU, V. SMIRNOV, A. GLEBOV and L.B. GLEBOV - Ultra-Narrow Bandpass Filters Based on Volume Bragg Grating Technologies. Proc. of SPIE, vol. 7675, p. 76750H, 2010.
[36] HERzBERG - Molecular Spectra and Molecular Structure. I. Spectra of Diatomic Molecules.: Van Nostrand, 1950.
[37] H.U. STAUFFER, J.D. MILLER, M.N. SLIPCHENKO, T.R. MEYER, B.D PRINCE, S. ROY and J.R GORD - Time- and Frequency-Dependent Model of Time-Resolved
Coherent Anti-Stokes Raman Scattering (CARS) with a Picosecond-Duration Probe Pulse. The Journal of Chemical Physics, vol. 140, p. 024316, 2014.
[38] C.E. DEDIC, J.D. MILLER and T.R. MEYER - Dual-Pump Vibrational/Rotational Femtosecond/Picosecond Coherent Anti-Stokes Raman Scattering
Temperature and Species Measurements. Optics Letters, vol. 39, no. 23, p. 6608, 2014.
[39] D. ORON, N. DUDOVITCH and Y. SILBERBERG - Femtosecond Phase-and-Polarization Control for Background-Free Coherent Anti-Stokes Raman
Spectroscopy. Physics Review Letters, vol. 90, no. 21, p. 213902, 2003.
[40] A.F. BUNKIN, S.G. IVANOV and N.I. KOROTEEV - Soviet Technical Physics Letters. vol. 3, p. 182, 1977.
[41] L.A. RAHN, L.J. zYCH and P.L. MATTERN - Background Free CARS Studies of Carbon Monoxide in a Flame. Optics Communications, vol. 30, no. 2, p. 249, 1979.
[42] F. VESTIN, M. AFzELIUS and P.-E. BENGTSSON - Development of Rotational CARS for Combustion Diagnostics Using a Polarization Approach. Proceedings of the Combustion Institute, vol. 31, no. 1, p. 833, 2007.
[43] F. EL-DIASTY - Coherent Anti-Stokes Raman Scattering: Spectroscopy and Microscopy. Vibrational Spectroscopy, vol. 55, no. 1, p. 1, 2011.
[44] M. DHYNE, M. LEPERE, and P. JOUBERT - Semiclassical Line Broadening Calculations, Using an Ab Initio Potential Energy Surface, in Q-Branch and
S-Branch of N2 Perturbed by H2 . Journal of Raman Spectroscopy, vol. 43, p. 2008, 2012.
[45] C. DORRER and M. JOFFRE, Characterization of the Spectral Phase of Ultrashort Light Pulses. Compte-rendu de l'Académie des Sciences de Paris, p. 1415, 2001. [46] S.P. KEARNEY - Hybrid fs/ps Rotational CARS Temperature and Oxygen Measurements in the Product Gases of Canonical Flat Flames. Combustion and
Flame, vol. 162, no. 5, p. 1748, 2015.
[47] D.R. RICHARDSON, R.P. LUCHT, W. D. KULATILAKA, S. ROY and J.R. GORD - Theoretical Modeling of Single-Laser-Shot, Chirped-Probe-Pulse
Femtosecond Coherent Anti-Stokes Raman Scattering Thermometry. Applied Physics B, vol. 104, no. 3, p. 699, 2011.
[48] T. SEEGER and A. LEIPERTz - Experimental Comparison of Single-Shot Broadband Vibrational and Dual-Broadband Pure Rotational Coherent
Anti-Stokes Raman Scattering in Hot Air. Applied Optics, vol. 35, no. 15, p. 2665, 1996.
Acronyms
CARS (Coherent Anti-Stokes Raman Scattering) FPE (Fabry Perot Etalon)
OPA (Optical Parametric Amplifier) NR (Nonresonant)
R (Resonant)
AUTHORS
Malik Nafa, graduated from the Institut d’Optique Graduate School in 2014. He is now a PhD student at ONERA working on the hybrid fs/ps CARS setup and on the simulation model described in this paper for thermometry applications in reactive flows.
Michael Scherman received his PhD in 2012 from Université
Pierre et Marie Curie. He has been a research scientist at
ONERA since then, in charge of the development of coherent and spontaneous Raman techniques applied to diagnostics in gaseous reactive flows, material characterization and biological sample studies.
Alexandre Bresson, received his Ph.D. degree in 2000, for his work on “quantitative imaging based on a laser-induced fluorescence technique” at ONERA – the French aerospace lab. He has been working for 4 years at ONERA, specifically on the development of optical diagnostic tools for combustion. Since 2004, he has continued his research on the use of cold atoms for on-board inertial sensing. He currently leads the “laser source and metrology” research unit at ONERA, in Palaiseau.
Alexandre Aubin is a student from the Institut Universitaire de
Technologie d’Orsay. He built a stabilized CH4/air flame, which is used in the lab as a reference of temperature for the CARS experiments.
Antoine Godard received his PhD from the Laboratoire Charles
Fabry de l’Institut d’Optique in 2003. His research interests at
ONERA concern the development of innovative laser sources based on nonlinear optics and their applications (gas sensing, onboard applications, etc.).
Brigitte Attal-Trétout performed the first Coherent Anti-Stokes Raman Scattering spectroscopy (CARS) experiments at ONERA. The so-called “resonant” version of CARS was created within this framework and used to record the first spectra of iodine. Since then, the Raman techniques and their degenerated version have been very widely applied to the measurement of traces in reactive environments. Brigitte Attal-Trétout has worked on optical metrology and nonlinear spectroscopy applied to plasmas and flames. She has directed a research unit and oriented field of applications to nano-object detection during their synthesis together with atom concentration measurements during material synthesis and in propellants flames. Finally, she constructed a CARS microscope for biology. Brigitte Attal-Trétout is currently a research director and scientific deputy of the Department of instrumentation and sensing.
Pierre Joubert works on the topic of molecular spectroscopy. He has performed semi-classical calculations of line broadening and line shifting coefficients applied to molecular systems involved in combustion media. He has also developed new spectral line profile models implemented using various thermometry techniques for a wide range of pressures and temperatures. He is the head of a physics and astrophysics research group at the UTINAM Institute. Pierre Joubert is currently a professor at Franche-Comté University.