Publisher’s version / Version de l'éditeur:
Journal of Building Physics, 35, 2, pp. 1-22, 2011-08-05
READ THESE TERMS AND CONDITIONS CAREFULLY BEFORE USING THIS WEBSITE.
https://nrc-publications.canada.ca/eng/copyright
Vous avez des questions? Nous pouvons vous aider. Pour communiquer directement avec un auteur, consultez la
première page de la revue dans laquelle son article a été publié afin de trouver ses coordonnées. Si vous n’arrivez pas à les repérer, communiquez avec nous à PublicationsArchive-ArchivesPublications@nrc-cnrc.gc.ca.
Questions? Contact the NRC Publications Archive team at
PublicationsArchive-ArchivesPublications@nrc-cnrc.gc.ca. If you wish to email the authors directly, please see the first page of the publication for their contact information.
NRC Publications Archive
Archives des publications du CNRC
This publication could be one of several versions: author’s original, accepted manuscript or the publisher’s version. / La version de cette publication peut être l’une des suivantes : la version prépublication de l’auteur, la version acceptée du manuscrit ou la version de l’éditeur.
For the publisher’s version, please access the DOI link below./ Pour consulter la version de l’éditeur, utilisez le lien DOI ci-dessous.
https://doi.org/10.1177/1744259111411652
Access and use of this website and the material on it are subject to the Terms and Conditions set forth at
Thermal response of basement wall systems with low emissivity
material and furred airspace
Saber, H. H.; Maref, W.; Swinton, M. C.
https://publications-cnrc.canada.ca/fra/droits
L’accès à ce site Web et l’utilisation de son contenu sont assujettis aux conditions présentées dans le site LISEZ CES CONDITIONS ATTENTIVEMENT AVANT D’UTILISER CE SITE WEB.
NRC Publications Record / Notice d'Archives des publications de CNRC: https://nrc-publications.canada.ca/eng/view/object/?id=7f55d2bf-21c7-433c-a3a1-835d25f94995 https://publications-cnrc.canada.ca/fra/voir/objet/?id=7f55d2bf-21c7-433c-a3a1-835d25f94995
T he rm a l re sponse of ba se m e nt w a ll syst e m s w it h low e m issivit y m a t e ria l a nd furre d a irspa c e
N R C C - 5 3 9 6 2
S a b e r , H . H . ; M a r e f , W . ; S w i n t o n , M . C .
O c t o b e r 2 0 1 1
A version of this document is published in / Une version de ce document se trouve dans:
Journal of Building Physics, 35, (2), pp. 1-22, August-05-11, DOI:
10.1177/1744259111411652
http://www.nrc-cnrc.gc.ca/irc
The material in this document is covered by the provisions of the Copyright Act, by Canadian laws, policies, regulations and international agreements. Such provisions serve to identify the information source and, in specific instances, to prohibit reproduction of materials without written permission. For more information visit http://laws.justice.gc.ca/en/showtdm/cs/C-42
Les renseignements dans ce document sont protégés par la Loi sur le droit d'auteur, par les lois, les politiques et les règlements du Canada et des accords internationaux. Ces dispositions permettent d'identifier la source de l'information et, dans certains cas, d'interdire la copie de documents sans permission écrite. Pour obtenir de plus amples renseignements : http://lois.justice.gc.ca/fr/showtdm/cs/C-42
Thermal Response of Basement Wall Systems with Low
Emissivity Material and Furred Airspace
Hamed
H.
Saber, Wahid Maret, and Michael C. Swinton
Building Envelope and Structure Program
Institute for Research in Construction, National Research Council Canada Bldg. M-24, 1200 Montreal Road, Ottawa, Ontario, Canada K1A OR6
http://irc.nrc-cnrc.gc.ca/irccontents.html Abstract
In basement wall systems, airspaces can contribute in obtaining a higher thermal resistance, if a low emissivity material such as reflective foil is installed within a furred-airspace. In this study, numerical simulations were conducted using the hygrothermal model "hygiRC-C" that was developed at the National Research Council of Canada's Institute for Research in Construction (NRC-IRC) to investigate the steady-state and transient thermal performance of basement wall systems. This model solves simultaneously the energy equation in the various material layers, surface-to-surface radiation equation in the Furred- Airspace Assembly (FAA) , Navier-Stokes equation for the airspace, and Darcy and Brinkman equations for the porous material layers. The wall systems used in the simulations incorporate a low emissivity material (foil with emissivity
=
0.04) bonded to a moulded/expanded polystyrene (EPS) foam that is installed in a furred-airspace assembly. The furring is installed horizontally and covered with a gypsum board. The structural element of the wall (external layer) is a poured-in-place concrete. Walls with and without FAA were considered in this study. Also, consideration was given to investigate the effect of the above-grade and below-grade portions of the wall on the thermal performance when these walls are subjected to two different Canadian climates. Results showed that at steady state condition, the effective thermal resistance (R-value) of the wall with a FAA depends on the soil, outdoor and indoor temperatures. Additionally, these wall configurations resulted in an energy savings of -17% compared to walls without FAA when these walls are subjected to two different climate conditions.Keywords : Basement wall, above-grade, below-grade, furred-airspace assembly, low emissivity material, thermal modelling, thermal resistance, R-value, heat transfer by natural convection and radiation.
Background
In many parts of the U.S. and other warmer countries , the house basement is considered to be outside the building envelope, whereas in Canada the house basement is presumed to be inside the envelope. Over the past decades, a large proportion of newly built Canadian basements have become used as habitable space. This trend continues to drive builder marketing and energy performance requirements for new houses in many regions of Canada. Although not necessarily lived in, the
basement spaces (and heated crawl spaces) are connected to the above-ground spaces through open stairwells and air circulation ducts in houses with forced-air systems. Indoor air in the basement, including its relative humidity, temperature and its contaminants, is shared with the rest of the house: The National Building Code (NBC) of Canada includes minimal requirements for basement spaces and recognizes this aspect [1].
Fundamental performance requirements for basements have been detailed in earlier work [2]. However, a new development in reconciling expectations and requirements emerged during the early phases of the Basement Guidelines Project [3]. It became apparent that in Canada, there exist diverse uses for basements, as well as diverse expectations on how it should perform. In the Basement Guidelines project it was proposed that the marketplace would be well served by a classification system based on the intended use of the basement and the severity of environmental loads (e.g. accounting for locations that are subject to periodic flooding).
Heat loss from basements can account for a significant portion of the total heat loss from a home. It is clear that a home with a basement must have insulated basement walls . In older homes, heat loss from an un-insulated basement was estimated to account for up to one third of the heating cost in some cases [4]. This varied depending on many factors, such as the air tightness of the building envelope, the amount of insulation in the house and the height of the above-grade and below-grade portions of the basement wall systems. The need for basement wall insulation resulted in the development of many insulated basement systems now available to builders and consumers in the marketplace [3]. By improving basement thermal performance, the net cost of owning and operating homes can be reduced and moisture-related problems can be minimized as well.
Two questions can properly be raised: how much basement thermal insulation should be provided, and on which side of the wall should it go? While thermal insulation may be placed in three positions: on the inside, on the outside and in the middle of the basement wall, the material choice and the insulation placement may affect the overall performance of the basement wall system. Some external insulation systems, in addition to controlling heat losses, may also increase the durability of the basement wall.
Exterior basement insulation performs many functions. It provides not only thermal resistance between the soil and the interior but also protects the structure from a challenging environment (e.g. moisture from wet soils, heaving and adhering soils due to frost action). It provides a means of water management at the interface of the soil and insulation, while promoting drying out of the structure.
Assessing the thermal and moisture performance of exterior insulation basement systems was one among a range of investigations carried out within the basement guidelines project at the National Research Council Canada's Institute for Research in Construction (NRCC-IRC) to assess their moisture control and thermal effectiveness [5,
6, 7 and 8]. A detailed discussion of the results of these field investigations is available in [9]. Subsequently, the project consortium commissioned an economic study to assess the cost effectiveness of a number of basement systems employing a range of moisture protection and thermal insulation strategies, both exterior and interior. Kesik [1 0] represented the first opportunity to synthesize results from these related studies and to provide a comprehensive discussion of the findings.
Of the three insulation placement options (inside, outside and in the middle of the foundation wall), the most common approach in Canada has been to insulate basements internally. It is believed that this market trend is driven mainly by economic considerations. Externally insulated basements have a major cost factor associated with protecting the exposed above-grade portion of the insulation assembly [1 0] which, in the case of new construction, can involve shifting the house structure outward to compensate for the thickness of the exterior basement insulation.
As well, internally insulated basements are often coupled with interior basement finishing and therefore offer a "higher perceived value" to the homebuyer [11]. As such, the focus of this paper is on innovative internally insulated basement wall systems, and specifically those featuring reflective foils facing air spaces in the basement wall assembly.
In this study, the NRC-IRC's hygrothermal model "hygiRC-C" is used to investigate both steady-state and transient thermal performance of basement wall systems. This model solves the 2D and 3D Heat, Air and Moisture (HAM) transport equations. This model was benchmarked against the hygiRC-2D model that was previously developed at NRC-IRC, and test results in a number of projects.
In the case of accounting for heat, air and moisture transport, the 2D version of the present model was used to predict the drying rate of a number of full-scale wall assemblies subjected to different time dependent exterior and interior boundary conditions [12]. The results showed that the overall agreements between the present model and the hygiRC-2D model [13 and 14] as well as the experimental measurements were good.
In the case of accounting for heat and air transport (no moisture transport), the 3D version of the present model was used to conduct numerical simulations for different full-scale wall assemblies with and without penetration to represent a window in order to predict the effective thermal resistance (R-value) with and without air leakage [15]. The predicted R-values for these walls were in good agreement (within ±5%) with the measured R-values in Guarded Hot Box (GHB) [16, 17]. Also, the present model was used to assess the dynamic heat transmission characteristics through two Insulating Concrete Form (ICF) wall specimens installed in the NRC-IRC's Field Exposure of Walls Facility (FEWF). The results showed that the present model predictions were in good agreement with experimental data [18].
For foundation wall systems, airspace can contribute in obtaining a higher R-value, if a low emissivity material such as aluminum foil is installed within a furred-airspace assembly. The impact of low emissivity on R-value was examined in a previous study [19]. In that study, the 2D version of the present model was used to conduct sensitivity parametric analyses in order to investigate the effect of low emissivity of foil laminated to XPS foam when used within a furred -airspace assembly. In that work, furring strips made of spruce (19 mm x 38 mm) were installed horizontally. Since there were no vertical studs in the wall assembly, the 2D version of the present model was suitable for this study. The results showed that the modelled foundation wall system with foil of emissivity 0.05 increased the effective R-value by -10% in the case of the indoor and outdoor temperatures of +20°C and -20°C, respectively [19].
Recently [20], the 3D version of the present model was benchmarked against the experimental data of a full-scale above-grade wall system consisting of 2"x6" wood frame construction with stud cavities filled with friction-fit glass fibre batt insulation and a foil bonded to wood fibreboard installed in a furred-assembly (the foil is facing the airspace and the interior finishes) . Results showed that the predicted R-value of this wall specimen (4 .19 m2KIW) was in good agreement with the measured value (4.24 m2KIW) [20]. Thereafter, the present model was used to quantify the contribution of low foil emissivity to the wall R-value. The results showed that a wall system with foil emissivity of 0.04 can increase the wall R-value by 0.34 m2KIW (2 ft2 hr °F/BTU) compared to the case of no foil installed in the wall system [20].
The objective of this paper is to use the present model to investigate the change in the effective R-value at steady-state conditions and transient thermal response of full-scale foundation wall systems (including the above-grade and below-grade portions of the wall) with low emissivity material and furred -airspace assemblies when these walls are subjected to different Canadian climates. Additionally, the present model is used to conduct transient simulations in order to determine the energy savings due to having foundation wall system with furred-airspace assembly compared to a foundation wall system without furred - airspace assembly. No moisture transport is accounted for in this study. The present model solves simultaneously the energy equation in the various material layers, surface-to-surface radiation equation in the furred- airspace assembly, Navier-Stokes equation for the airspace, and Darcy equation (Darcy number < 1
o-
6) andBrinkman equation (Darcy number > 1
o-
6) for the porous material layers. The fulldescriptions of the present model are available in [19] and [20].
Wall Description, Assumptions, and Initial and Boundary Conditions
Figure 1 shows a basement wall system with foil bonded to expanded polystyrene (EPS) foam in a furred-airspace assembly having airspace next to the foil. The measured foil emissivity of 0.04 [20] was used in this study. The furred-airspace assembly consists of 19 mm x 64 mm wood furring strips installed horizontally at 406 mm (16") center-to-center and was closed with a gypsum board (12.7 mm thick). The structural element of the wall (external layer) is a poured-in-place concrete (200 mm thick) . Two basement walls were modeled with above-grade and below-grade heights
of 598 mm and 1,840 mm (Wall-FAA 1 ), and 495 mm and 1,943 mm (Waii-FAA2), respectively. Consideration was given to investigate the effect of the climate conditions on the wall thermal performance. The soil temperatures were measured at -2 m away from the walls at 5 different elevations (see Figure 1). In order to quantify the contribution of having a furred-airspace assembly with foil bounded to EPS foam on the energy savings, two reference walls were considered. These reference walls are Waii-R1 and Waii-R2, which are identical to Waii-FAA1 and Waii-FAA2, respectively, but without furred-airspace assembly. It was assumed that all material layers and the soil are in good contact. Since there were no vertical studs in the wall assembly and that the furring is installed horizontally, the 20 version of the present model is suitable for this study.
An initial and uniform temperature of 1 0°C was assumed in the different components of wall systems and soil. The boundary conditions used in the numerical simulations are shown in Figure 1. At the left boundary of the soil (2 m away from the wall), the temperature was measured at five locations (at y = 0, 500, 1100, 1570 and 1690 mm for Waii-FAA1 [21, 22, 23], and at y = 0, 483, 1092, 1549 and 1943 mm forWaii-FAA2 [24]) and shown in Figure 2 and Figure 3, for Wall-FAA 1 and Waii-FAA2, respectively. These measured temperatures were taken as temperature boundary condition at the left boundary of the soil. Between these measured locations, however, the temperature of the soil at the left boundary was evaluated from the measured temperatures by linear interpolation. Both the top boundary of the soil and the left boundary of the above-grade portion of the wall system are subjected to convective boundary conditions with a heat transfer coefficient of 22.1 W/(m2K) and an air temperature equal to the measured outdoor temperature (see Figure 4a and Figure 4b). Similarly, the interior surface of the gypsum board is subjected to a convective boundary condition with heat transfer coefficient of 7.11 W/(m2K) and an air temperature equal to the measured indoor temperature (Figure 4a and Figure 4b). The top boundary of the wall was assumed adiabatic and sealed (no heat and mass transfer).
The boundary condition on the bottom boundary of the walls and soil are assumed to be adiabatic. During some periods within the year, the bottom boundary may lose/gain heat. As such, the predicted thermal performances of different wall systems in this study are qualitative performances. To predict the quantitative thermal performance, however, the soil temperature under the wall systems needs to be measured and taken as a temperature boundary condition instead of applying adiabatic boundary condition at the bottom boundary of the wall systems. On the other hand, these temperatures were not measured. Because all boundary conditions described in this section for walls with furred-airspace assembly (Waii-FAA1 and Waii-FAA2) are taken to be the same as for walls without furred-airspace assembly (reference walls: Waii-R1 and Waii-R2), it might be urged that the difference in the thermal performance of these walls would reflect the contribution due to the furred-airspace assembly.
Material Properties
The properties of the soil depend on the type of soil and its moisture content. Even for the same type of the soil, these properties change widely [25 and 26]. Similarly, the properties of the concrete change widely as well [25]. Table 1 lists the properties of the different materials that have been used in the numerical simulations for all wall systems (WER-FAA1, Waii-FAA2, Waii-R1 and Waii-R2) . All material properties were assumed to be independent on the temperature (Table 1 ). To account for the heat transfer by radiation in the furred-airspace assemblies, the opacity of the airspace is considered as transparent so that the radiation rays from the surface boundaries of the airspace enclosure (foil , furring and drywall) are not blocked. Since there is no radiation through the solid material layers, both furring and drywall are treated as opaque bodies. The accumulation of dust particles and/or condensation on the surface of the foil will affect the foil emissivity. In previous studies [19, 20], numerical simulations were conducted to obtain the R-value as a function of the foil emissivity (ranging from 0 up to 0.9). The results showed that increasing the foil emissivity from 0.04 (measured value for a clean foil) to 0.9 (foil surface is fully covered by dust, or no foil installed in the wall system) resulted in a decrease in R-value by -9% [20]. In this study, a foil emissivity of 0.04 was taken equal to the measured value and the emissivity of the furring and drywall was assumed equal to 0.9 [20].
Results and Discussions
It was shown in previous studies for above-grade wall systems [19 and 20] that a foil with low emissivity has two interactive and competing effects on the wall R-value, namely: (i) an increase in wall R-value due to lower net radiative heat flux in the furred - airspace assembly, and (ii) a decrease in R-value due to stronger convection currents in the airspace. The former effect outweighs the latter effect, resulting in a net increase in the effective R-value for a wall system with low foil emissivity. In this study, the effect of both above- and below-grade portions of the wall on the effective R-value as well as the transient thermal response of walls with and without furred-airspace assembly are investigated. The numerical simulations were conducted for a period of two years for all wall systems. The temperature measurements of the soil, outdoor and indoor that were used in the simulations are shown in Figure 2 and Figure 4a, and Figure 3 and Figure 4b for Waii-FAA1 and Waii-R1, and Waii-FAA2 and Wall-R2 [21, 22, 23], respectively. For Waii-FAA1 and Waii-R1, time= 0 corresponds to June 5, 1996 at 15:19:04 while for waii-FAA2 and Waii-R2, time = 0 corresponds to January 2, 2003 at 11:00:00 [24].
Steady-state simulations for predicting R-values
The effective R-value of the wall with furred-airspace assembly (Waii-FAA1) was calculated at steady-state conditions during the first year. During this year, average temperature measurements of soil, outdoor and indoor were taken at two weeks intervals. Figure 5 shows an example of the average temperatures of soil, outdoor and indoor at t = 7 day (averaging within t = 0- 14 day), t = 147 day (averaging within
t
=
140 - 238 day), and t=
231 day (averaging within t=
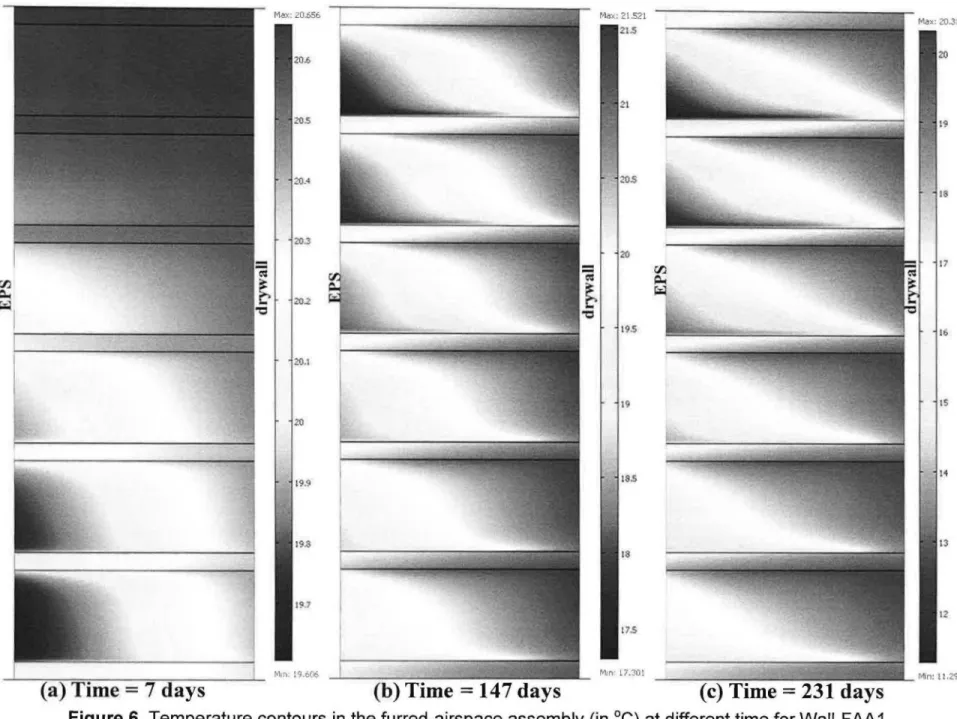
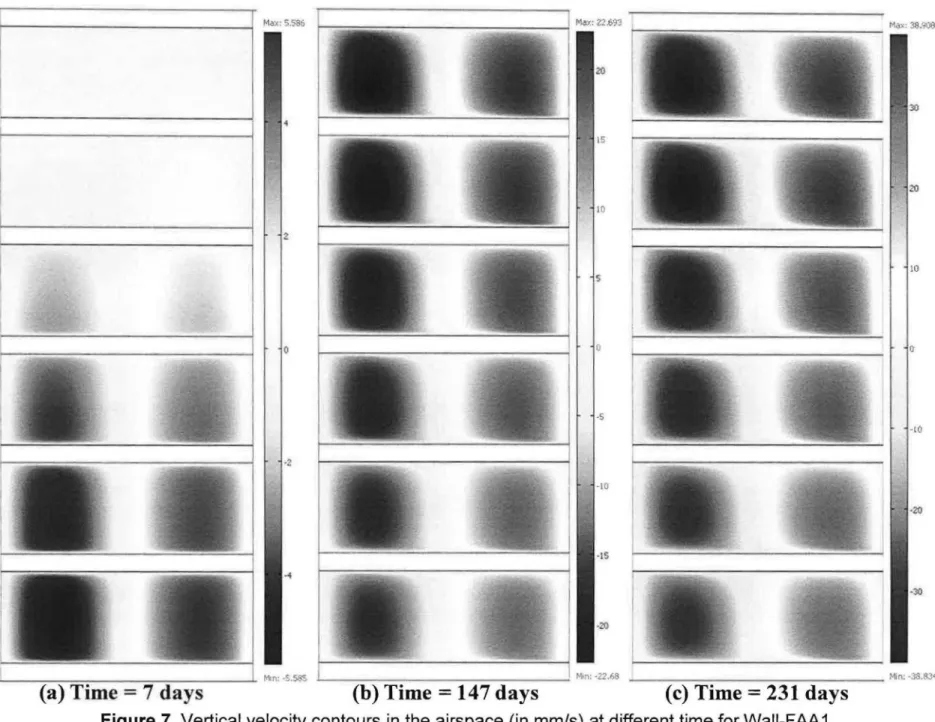
224 - 238 day). The temperature contours in the furred-airspace assembly (FAA) are shown in Figure 6a, b, and c and the corresponding vertical velocity contours in the six airspaces of the FAA are shown in Figure ?a, b, and cat t=
7, 147 and 231 day, respectively.In the above-grade portion of the wall at t = 7 day, the outdoor temperature (22.6°C) is close to the indoor temperature (20.7°C). As such, the temperature distribution in the upper two airspaces is approximately uniform, resulting in no convection current in these airspaces (see Figure ?a). In the below-grade portion of the wall at this time (t
=
7 day), however, the lowest soil temperature occurred in the lower portion of the wall (see Figure 5). As such, the temperature gradient across the furred-airspace assembly decreases with the distance along the wall (Figure 6a), resulting in a stronger convection current in the lower airspaces than in the upper airspaces (Figure ?a). Conversely, in the above-grade portion of the wall at t = 147 day, the outdoor temperature (5.4°C) is lower than the indoor temperature (22.2°C) resulting in a high temperature gradient across the upper portion of the furred-airspace assembly (Figure 6b). As such, strong convection current occurred in the upper two airspaces (Figure ?b). In the below-grade portion of the wall at this time (t = 147 day), the highest soil temperature occurred at the bottom of the wall (Figure 5). As such, the temperature gradient across the furred-airspace assembly increases with the distance along the wall (Figure 6b), resulting in a stronger convection current in the upper airspaces than that in the lower airspaces (Figure ?b).A similar trend in terms of the temperature and velocity distributions in the furred-airspace assembly occurred in both the above- and below-grade portions of the wall at t = 231 day as that at t = 147 day. However, because both outdoor and soil temperatures at t = 231 day are lower than that at t = 147 day, the convection current in the airspaces at t = 231 day is stronger than that at t = 147 day (see Figure ?b and Figure ?c). For example, the highest vertical upward velocity at t = 231 day is 38.91
mmls,
which is about 71% higher than that at t=
147 day (22.69 mm/s). As such, the thermal conductance of the furred-airspace assembly at t = 231 day is greater than that at t=
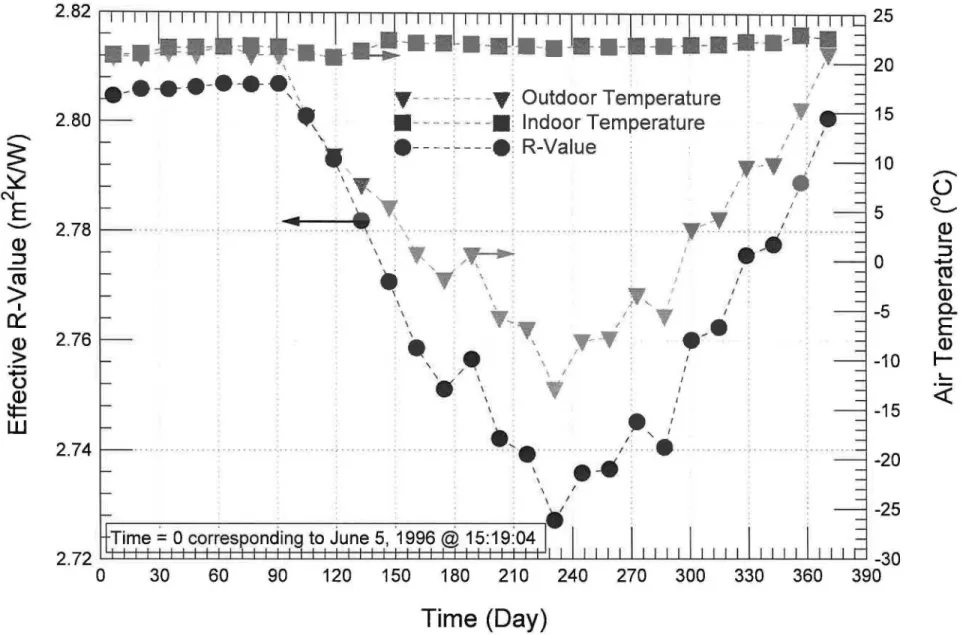
147 day, resulting in a lower R-value at the former than at the latter (see Figure 8).Figure 8 shows the dependence of the effective R-value of Wall-FAA 1 on the environmental conditions (soil, outdoor and indoor temperatures) during the first year of simulation at steady-state conditions. As indicated earlier, the temperature measurements of the soil, outdoor and indoor were averaged over a period of 2 weeks. Because the outdoor and indoor conditions affected the radiation and convection in the airspace for Wall-FAA 1, the obtained R-value is affected by these conditions. As shown in Figure 8, the lower temperature gradient across the wall results in a higher effective R-value. The highest effective R-value of this wall was 2.81 m2KMI which occurred at t = 91 day. Additionally, the lowest effective R-value (2.73 m2KMI) occurred at t = 231 day, at which Waii-FAA1 was subjected to the highest temperature gradient across it. During the first year, the maximum change in the effective R-value was -3% (see Figure 8). Similarly, the R-value for wall without
FAA (Waii-R1) was calculated at different outdoor and indoor conditions. However, for Waii-R1 (200 mm concrete, 76.2 mm EPS, and 12.7 mm gypsum), the R-value is not affected by the outdoor and indoor conditions. This is because the thermal conductivity of the different layers was taken constant (see Table 1 ). The obtained nominal R-value for Waii-R1 was 2.28 m2
KJW,
and the yearly average R-value of Waii-FAA1 was 2.77 m2KJW,
which is 21.5% higher than Waii-R1. As such, it is expected that the heat loss from Waii-FAA1 will be smaller than that from Waii-R1 as explained below.Transient simulations for predicting Energy Use
Four transient numerical simulations were conducted for a period of two years in order to quantify the contribution of having furred-airspace assembly with low foil emissivity (0.04) bonded to EPS foam on the energy savings. The first two simulations were conducted for Waii-FAA1 and Waii-R1 (same as Waii-FAA1 but without FAA) using the same soil, outdoor and indoor temperatures shown in Figure 2 and Figure 4a. While the other two simulations were conducted for Waii-FAA2 and Waii-R2 (same as Waii-FAA2 but without FAA) using the same soil, outdoor and indoor temperatures shown in Figure 3 and Figure 4b. Note that the temperature measurements were taken every 6 hr and 1 hr for Waii-FAA1 and Waii-R1 [21, 22, 23], and Waii-FAA2 and Waii-R2 [24], respectively.
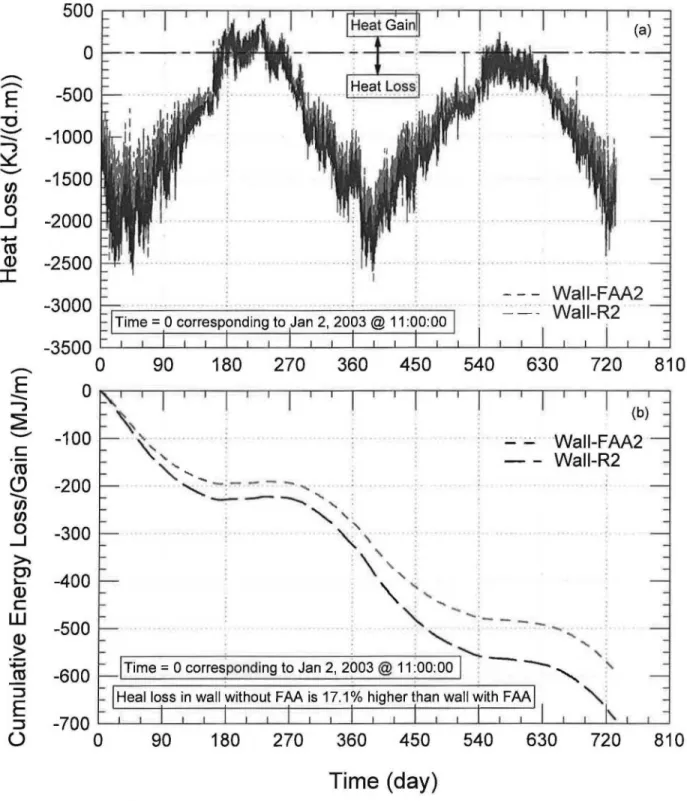
Figure 9a and Figure 1 Oa show the rate of heat loss/gain per unit width of the wall (in KJ/(d.m)) from the interior surface of the drywall of Wall-FAA 1 and R1, and Waii-FAA2 and Waii-R2, respectively. In these figures, positive and negative heat rate represent heat gain (i.e. heat into the building) and heat loss (i.e. heat out the building), respectively. As shown in these figures, the rate of heat loss from walls with FAA (Waii-FAA1 and Waii-FAA2) is lower than that for walls without FAA (Waii-R1 and Waii-R2). For example, the heat loss from Wall-FAA 1 at t
=
270 day is 1510 KJ/(d.m), which is about -16% lower than that for Waii-R1 (1745 KJ/(d.m)). Furthermore, for Waii-F AA 1 and Waii-R 1, the heat gain during two years is approximately zero (i.e. no cooling load is needed). While, for FAA2 and Waii-R2 there is heat gain during the summer of the first year (i.e. cooling load is needed) and approximately no heat gain during the summer of the second year.The rate of heat loss/gain shown in Figure 9a and Figure 1 Oa were used to derive the accumulative energy loss/gain per unit width of the wall (in MJ/m) over a two years period. These results are shown in Figure 9b and Figure 1 Ob for FAA1 and Waii-R-1, and Waii-FAA2 and Waii-R2, respectively. During the two years of simulation, these figures clearly show that the energy loss from the walls with FAA is always lower than that for the walls without FAA (Waii-R1 and Waii-R2). At the end of the second year, the energy loss from Waii-R1 was 771 MJ/m, which is 17.7% higher than that of Waii-FAA1 (655 MJ/m, see Figure 11a). Similarly, at the end of the second year, Figure 10b and Figure 11b show that the energy loss from Waii-R2 was 691 MJ/m, which is 17.1% higher than that Waii-FAA2 (590 MJ/m, see Figure 11b). As such, walls with FAA and low foil emissivity (0.04) bounded to EPS foam result in an
energy savings of about 17% compared to walls without FAA when these walls are subjected to two different climate conditions.
Summary and Conclusions
The present model was used to conduct numerical simulations in order to investigate the steady-state and transient thermal performance of a foundation wall system (including the abovegrade and belowgrade portions of the wall) having a Furred -Airspace Assembly (FAA) that incorporates a low emissivity material (foil) . This model was benchmarked in a previous study by comparing its predictions against experimental data generated by a commercial laboratory for an above-grade wall assembly. The external layer of the foundation wall is poured-in-place concrete and the internal layer is gypsum board. In order to quantify the contribution of a furred-airspace assembly with foil bounded to EPS foam on the energy savings in foundation wall systems (Wall-FAA 1 and Wai-FAA2) , two reference walls were considered in this study (Wall R1 and R2) . These reference walls are identical to Wall-FAA 1 and Waii-FAA2 but without furred-airspace assembly. Walls with and without FAA were subjected to two different climate loads where the measurements of soil temperature (2 m away from the wall), outdoor temperature and indoor temperature were used . Results showed that at steady-state condition, the effective R-value of wall with FAA can vary by as much as -3%, depending on the soil, outdoor and indoor temperatures through the year. Moreover, these wall configurations resulted in an energy savings of -17% compared to the walls without FAA. This is on-going research . The present model will be used to investigate the transient thermal response of foundation wall systems with furring installed vertically, and subjected to different Canadian climate conditions. The results of this effort will be reported at a later date.
Acknowledgement
The authors would like to thank Ms. Marianne Armstrong and the Canadian Centre for Housing Technology for providing the temperature measurements of the soil, outdoor and indoor for Waii-F AA2 and Waii-R2.
References
1. CMHC-Research Highlight, Technical Series 06-1 09 "Occupancy-based Classification for Design and Construction of Residential Basements", August 2006.
2. Kesik, T., "Basement System Performance", Proceedings, CSCE 7th Conference on Building Science and Technology, March 20 & 21, 1997, Toronto, pp.227-241. 3. Swinton, M.G., Kesik, T.J., "Performance Guidelines for Basement Envelope
Systems and Materials: Final Research Report", Research Report, NRC Institute for Research in Construction, (199), pp. 193. 2005-10-01.
4. Timusk, J., Insulation Retrofit of Masonry Basements, Department of Civil Engineering, University of Toronto, Toronto, Canada, 1981 .
5. Swinton, M.C., Bamberg, M.T., Maret, W., Normandin, N., Marchand, R.G., InSitu Performance Evaluation of Exterior Insulation Basement System (EIBS) -EPS Specimens. Institute for Research in Construction, NRCC, Ottawa, 1999 (A-3132.1).
6. Swinton, M.C. , Bamberg, M.T., Maret, W., Normandin, N., Marchand, R.G., In-Situ Performance Evaluation of Exterior Insulation Basement System (EIBS) . Spray Polyurethane Foam. Institute for Research in Construction, NRCC, Ottawa, 2000 (A-3132.3).
7. Swinton, M.C., Bamberg, M.T., Maret, W., Normandin, N., Marchand, R.G., InSitu Performance Evaluation of Exterior Insulation Basement System (EIBS) -Glass Fibre Specimens. Institute for Research in Construction, NRCC, Ottawa, 2000 (A-3129.1) .
8. Swinton, M.C., Bamberg, M.T., Maret, W., Normandin, N., Marchand, R.G ., InSitu Performance Evaluation of Exterior Insulation Basement System (EIBS) -Mineral Fibre Specimens. Institute for Research in Construction, NRCC, Ottawa, 2000 (A-3129.2).
9. Swinton, M.C., Bamberg, M.T., Kumaran, M.K., Normandin, N. and Maret, W . Performance of Thermal Insulation on the Exterior of Basement Walls. Construction Technology Update No. 36, Institute for Research in Construction, NRCC, Ottawa, 1999.
10. Kesik, T., "Economic Assessment of Basement Systems", Contract Report No. 338326, Institute for Research in Construction, National Research Council of Canada, Ottawa, March 2000.
11. Yost, N., Lstiburek, J., "Basement Insulation Systems", Research Report- 0202 by Building Science Corporation , PP. 21, 2002.
12. Saber, H. H., Maret, W., Lacasse, M.A., Swinton, M.C., Kumaran, K.,
"Benchmarking of hygrothermal model against measurements of drying of full-scale wall assemblies", 2010 International Conference on Building Envelope Systems and Technologies, ICBEST 2010, Vancouver, British Colombia Canada, June 27-30, 2010, pp. 369-377.
13. Maret, W., Kumaran, M.K., Lacasse, M.A., Swinton, M.C., van Reenen, D., "Laboratory measurements and benchmarking of an advanced hygrothermal model", Proceedings of the 121h International Heat Transfer Conference
(Grenoble, France, August 18, 2002), pp. 117-122, October 01 , 2002 (NRCC-43054).
14. Maret, W., Lacasse, M.A., Kumaran , M.K., Swinton, M.C., "Benchmarking of the advanced hygrothermal model-hygiRC with mid-scale experiments", eSim 2002 Proceedings (University of Concordia , Montreal, September 12, 2002), pp. 171-176, October 01, 2002 (NRCC-43970).
15. Elmahdy, A. H., Maret, W., Swinton, M.C., Saber, H. H., Glazer, R., "Development of energy ratings for insulated wall assemblies", 2009 Building Envelope Symposium (San Diego, CA. 2009-10-26) pp. 21-30, 2009.
16.Saber, H.H., Maref, W. , Elmahdy, A.H ., Swinton, M.C., Glazer, R. "3D thermal model for predicting the thermal resistances of spray polyurethane foam wall assemblies", Building XI Conference, December 5-9, 2010, Clearwater Beach, Florida, USA
17. Saber, H. H., Maret, W., Elmahdy, A. H., Swinton, M.C., Glazer, R. "3D heat and air transport model for predicting the thermal resistances of insulated wall assemblies, International Journal of Building Performance Simulation, in print, 2010.
18. Saber, H.H., Maret, W., Armstrong, M., Swinton, M.C., Rousseau, M.Z., Gnanamurugan, G., "Benchmarking 3D thermal model against field
measurement on the thermal response of an insulating concrete form (ICF) wall in cold climate", Building XI Conference, December 5-9, 2010, Clearwater Beach, Florida, USA.
19. Saber, H.H., and Swinton, M.C., "Determining through numerical modeling the effective thermal resistance of a foundation wall system with low emissivity material and furred - airspace", 2010 International Conference on Building Envelope Systems and Technologies, ICBEST 2010, Vancouver, British Colombia , Canada, June 27-30, 2010, pp. 247-257.
20 . Saber, H.H., Maret, W., Swinton, M.C. and St-Onge, C., "Thermal analysis of above-grade wall assembly with low emissivity materials and furred airspace", Journal of Building and Environment, in print, 2011.
21. Swinton, M.C., Bamberg , M.T., Kumaran, M.K., and Maret, W. "In-situ performance of expanded molded polystyrene in the exterior insulation systems (EIBS)", Journal of Thermal Envelope & Building Science, 23, (2), pp. 173-198, 1999.
22.Maref, W., Swinton, M.C., Bamberg, M.T., Kumaran, M.K., Normandin, N., and Marchand, R.G. "Three-dimensional numerical analysis technique for interpreting monitored result of the exterior insulation basement systems (EIBS) experiment" Internal Report, Institute for Research in Construction , National Research Council Canada, 814, pp. 76, 2000.
23 . Swinton , M.C., Maret, W., Bamberg , M.T., Kumaran, M.K., and Normandin, N. "Assessing heat flow patterns in basement walls with exterior insulation" Performance of Exterior Envelopes of Whole Building VIII: Integration of Building Envelopes (Clearwater Beach, Florida), pp. 1-9, 2001.
24.Armstrong, M., Swinton, M.C, and Ruest, K., Assessing the impact of cold climate on basement temperatures at the Canadian Centre for Housing Technology, National Research Council Canada, Ottawa, in press, 2010.
25.ASHRAE Handbook Fundamentals , Sl Edition , 1791 Tullie Circle, N.E., Atlanta, GA 30329, 2007.
26 .Ren , T. , Ochsner, T.E. , Horton, R., and Ju, Z., "Heat-pulse method for soil water content measurement", Soil Science Society of America Journal, vol. 67 , No. 6, pp. 1631-1634, 2003.
27. Kumaran, K., Lackey, J., Normandin, N., Tariku, F and van Reenen, D., A thermal and moisture transport property database for common building and insulating materials , Final Report from ASHRAE Research Project 1018-RP, pp . 1-229, 2004.
Table 1. Properties of different materials used in numerical simulations [25, 26, 27]
Density Specific heat Thermal
Material conductivity (kg/m3) (J/(kg.K)) (W/(m.K)) Soil 2470 881 2.5 Spruce 400 1630 0.09 Gypsum board 700 870 0.159 Concrete 2350 880 1.4 EPS 16 1210 0.037
"T1 Ul c:
.,
CD ...a. )> 0"' 0 < CD I (Q ...., Q.) c.. CD Q.) ::::J c.. 0"' CD 0 セ@I (Q ...., Q.) c.. CD 0"' Q.) C/) CD 3 CD ::::J ..-+ セ@ Q.) セ@ ;::::;.: ::::,-1-'0'
w 0'" 0 ::::J c.. CD c.. ..-+ 0m
"'U (/):;
-c ....,ro
c.. I Q.) ...., C/) "'C Q.) (') CD Q.) C/) C/) CD 3 0'" '< .--.. セ@ Q.) I "'Tlセ@
_...->
Q......
セ@ C" セ@!""!'-....
セ@--
....
=
tl.l=
-
セ@-
....
0=
,_, /,,,.
...
/ .... / .... I.-I' / ' Tsoi1(t, x=O,
y)
.... -,"500mm
J
...1100 mm
_ ... /1570m·m
...
QVYPセュ@,,
--00
=
-·
--'Q
=
=
0a
s
t-t-e:
n
1840mm
セ@
Concrete Laye-r (200 mm
thick)
EPS msulat10n board(3'' , 76:1. mm tJnc_k)wattJiow e
Convective boundary condition
'
EPS (76.2
mm
thick)
Ajrspace (19 mm thick)•
セ@
fe セ@ tl.l セ@ 0=
=
'"'I<
fe セ@ Q.. セ@ tl.l !""!'- 0....
....
<
-セ@ !""!'-C" fe 0e
=
"'0=
fe Q.. '"'I セ@ セ@ -セ@=
'"'I セ@ セ@ 0=
Q..-·
!""!'-....
0=
598mm
... ... L_...
' ,.Convective
boundary
condition
· · matenal (0•04)"
Gypsum board (12. 7 mm thick) Foil Furring (19 x 64 mm)
Spacing of furring= 16", 406 mm o.c.
>
Q......
セ@ C" セ@!""!'-....
f':l--
....
=
tl.l=
-セ@!""!'-....
0=
,_,
-0
0-
Q) s.... ::J...
ro
s.... Q)c..
E
Q) I-0 (f)20
15
10
5
0
0
y
= 1690 mm
y
=
1570 mm
... . -:-:-:-:-:-. .-:-:-. .-:: ... y
= 1100
mm .... : . ...
' • • セ@ • • セ@• 0 • • • • • ' • • · ' • •- - - - y
= 500 mm
:
M iddle,.
""""'
y=Omm
,.r
\
Low \ \ \"''',
\ '.
....
\. \... .
··· . . . M セ@... .... .
\
\,
\'
\ ... , I... \, '>··-f
' . IMeasurements were エ。セ・ョ@ at 2 m away from the キセャャ@ every 6 hrs :
90
180
270
360
450
540
Time
(Day)
I
Soil Es·
Co C\ 'e \Q-e
セ ᄋ@ セ@.,..
Ill...
5 E c -E ,.,. E 00 .... c::o セ@ セMe
e
'C = 10 セ@(
X630
720
Figure 2. Measurements of Soil temperature at 2m away from the Waii-FAA1 [21, 22, 23]
14
-
(.) 0_...
セ@
::J...
co
!.... Q)a..
E
Q) J--0en
20
15
10
5
0
-5
y=1943mm
y = 1549 mm
- - : - y
=
1092 mm
.
:
···:··· ··· ··.- ···:.; ..
ZᄋZNNZNNZᄋNZNZNN Zᄋセᄋᄋᄋ ケ@=
483 mm ··· · ·:···· ···-··· ···· ··· ···
y= 0 mm
:
Gセ@
:
. , / ,. ....
セ@.
,/
... -v-•
... .. .. ... .......
,(/
·--
セ@
,··
....
·:
.. ..
...
....
..
/;/"-·
I ' .... ... /:', ...
| Lセ|ゥ@
... : ... ; ...
-h/ ... ;
...
セ | ||@
.. .
\ ' • I . . I " ' \ : I " • Mcmiured T ool\(t,x=O,y) .. ' , ... , .... 2m away from the wall \ ' ,' , ' ... •OP Soil ' ' .
'
... : ... .
|セ ᄋ@ MMM セBG\Z ᄋN@... ...
High .• .. --· \ -... .:"
... __ .__
,. _ _, \ .)
'\...
..
___..-;-:
-····.···· ···
·•·· ·· · · . ... •· · ... · · •· ·· ··· ... · ·••·· ., .... •··· ·l:.owTime = 0 corresponding to Jan 2, 2003 @ 11:00:00
e e N C\ c:>
...
.e e MQッ セセセセセセセセセセセセセセセセセセセセセセセセセセセセセ@0
90
180
270
360
450
540
630
720
810
Time (day)
Figure 3. Measurements of Soil temperature at 2m away from the Waii-FAA2 [24]
-
0
0..._
Q) I.... ;::j...
co
I.... Q)a.
E
Q) I-<(-0
0..._
Q) I.... ;::j...
co
I.... Q)a.
E
Q) I-SU セセセセセセセセセセセセセセセセセセセセセ@30
25
20
15
10
5
0
-5
-10
-15
-2 0
イMMMイ]MMMGMGMMMMMMGMMMMMGMセセセMMBMGMMMN@-25
Q]MNA]]]] ]]] ]]]ZZZエZ]ZZZZZZエᄆ]セ]]]セM M MML@ MSP セccl」」・セセiiiiiiiiiiセセセセセセセセ@0
90
180
270
360
450
540
630
720
810
SU セQQQQQQjイAiitittttttttittiセセセセセセ@30
25
20
15
10
5
0
-5
-10
-15
-20
-25
MSッ セセセセセセセセセセセセセセセセセセセセセセ@0
90
180
270
360
450
540
630
720
81 0
Time
(day)
Figure 4. Measurements of outdoor and indoor temperatures for Waii-AA 1 [21, 22 , 23]
..._
u
20
0 ...rn
18
セ@ (l) ..c +""'16
E
0 !1.... セ@14
セ@rn
セ@12
rn
E
N10
+""'rn
(l) !1....8
::::::s +""'rn
!1.... (l)6
a.
E
(l) +""'4
0 (}) (l)2
C)rn
!1.... (l)0
>
<(0
9--
セaエ@t
=
231 day,
Toutdooravg=
-12 .9PC,
tゥョ、ッッイ\Zセカョ@=
21 .5°C
.-:-= .-:-:- .-:- .-[] .At t
=
147 day,
tッオエ、ッッイ Z セ|Oョ@=
UNTセc N@ T indoor 。カセ@=
22.2?C ... ;.. .... . ..
7
... ..
G- -
--8
At t
=
7 day,
T outdoor,avg=
22.6°C,
tゥョ、ッッイ
L 。セァ@
=
20. 7°C
/
-·· ... , ... ».. ···
. / . / .· - -
. . -- -- -... · --=-· · ... : . .-Mセ ᄋ@:.:..· ._. :.: ..-a:.:.·
セ M... -...
セMM... " '.--... --... ... ·:·--.. ---- --.--- ---- -- .. -.. -..
. / : - - .._-- - - -セ@
(a) Average soil temperature measurements...
[[ ᄋ NZ^ セ ZNZNN MM NNZ⦅ᄋ bセ@...
within t = 0-14 day' ... .. .. .--
-
...--
--··· ᄋᄋᄋᄋᄋᄋᄋᄋᄋᄋᄋᄋᄋᄋᄋᄋᄋᄋᄋᄋ bMセMM M MMM M -·- ·· ···· ··-- - ---- ---- ···...,.· - · -.: .. : ····.··· ···. ·· ··· ··-··· ····-.:::---
----
セ M MZMMi3
ON セ@
.-.. .. .. ":". -:---..._. ... ... (b) Average soil temperature measurements ... セ M::-... ..
MセNNNNN@ withint=140-154day :
- EJ
...
セ@
... ...
ᄋᄋᄋᄋᄋᄋMセᄋ
Mᄋ@
···
... _ / (c) Average soil temperature measurements
. ... セ@ within t = 224 - 238 day
• 0 0 0 I 0 0 0 0 o I '" I • 0 I セ@• • • • • 0 • • • • • • • • ' • • 0 o • • • • • • • • 0 • 0 • ' • • • • • • • • • • • • • • • • • • • • • • • • • • • • ' • • • • • • • • • • • • • 0 0 • '" oO "' 0 • 0 I I I I I • I • "'
t = 0 corresponding to June 5, 1996 @ 15:19:04-y = 0 at the bottom of the wall
0.5
セ@
···.
··· ·· ····
1.0
Y
(m)
-
-...
N MZM N セ@.
'9----1.5
2.0
Figure 5. Average temperatures of soil, outdoor and indoor (averaging within 2 week) at different time during the 1st year (Waii-FAA1 [21, 22, 23])
2CJ.4 20.3 :10.2 195 20.1 19 19.9
ays
(b) Time= 147
days
(c)
Time= 231
days
Figure 6. Temperature contours in the furred-airspace assembly (in °C) at different time for Wall-FAA 1
18
18
I?
16
2
. ' .
G セ@
t
.
l
セ@
-(a)
Time= 7
days
...
()セ@
w
2.80 2.78 2.76 2.74 . .T--
· ----
M セ@Outdoor Temperature
• - -· ·-- ·· -- -•: Indoor Temperature
e---e:
R-Value
I I Iy-·
:'
I| セ@
. ./:
..
...
セ@
... :
...
Zエ NセG」@
... -... ···-·· ...
j ... .. ...\yセ@
... .
. . / ... .
:
.
\
• ,.
セ N@
セN@
:
/
...
セ@
/\
:
./
,' :.
\
\
...
/
/
\
tセセ@
/ ·
'f'
e
. •
\
y- --.
. ,
'
.
/.
\
//
\
.
,' I I I• .,
I ,' ::
... ... ... , .... ... . ... : ... .../
.. .. . ...
, ...;
... .. ... .
.:
\
••
. I I I I . '.
. . '.•
Time = 0 correspo nding to June 5, 1996 @ 15:19:04
25 20 15 10 5 0 -5 -10 -15 -20 -25 2. 72 セᄆᄆᄆᄆᄆᄆZエᄆᄆᄆᄆᄆᄆᄆᄆZエᄆᄆᄆᄆᄆᄆセエZZᄆZᄆᄆᄆᄆᄆᄆZᄆjエZZZZエZZャ⦅⦅ャ⦅ャ⦅NlllljujN⦅⦅ェ⦅j⦅NlllャNj⦅ャ⦅ャNNNllNlluャNNNd@ -30 0 30 60 90 120 150 180 210 240 270 300 330 360 390
Time
(Day)
Figure 8. Dependence of the effective R-value on the climate conditions for Wall-FAA 1
20
-0
0---
Q) !... ::::J...
ro
!... Q) 0..E
Q) I-!... <(...-E
"'0_..
...._
--,
セ@_..
c
co
(.9...._
en
en
0 _J...
co
Q)I
...-E
...._
--,
セ@ _..c
co
(.9...._
en
en
0 _J >. C) "-Q)c
w
Q)>
...
co
::::lE
::::l0
500
0
-500
-1000
-1500
-2000
-2500
-3000
0
0
-100
-200
-300
-400
-500
-600
-700
-800
0
90
180
270
360
450
90
180
270
360
450
Time (day)
540
630
Waii-FAA1
- - · Waii-R1
540
630
720
720
Figure 9. Comparison between heat loss in wall with furred -airspace assembly (Wall-FAA 1) and wall without furred-airspace assembly (Waii-R1)
... ...
E
"'C ...---,
セ@ ... tJJ tJJ 0 ...J...
rn
Q} I ...E
-
--, セ@ ...c
rn
(!)-
tJJ tJJ 0 ...J >. 0) t.... Q}c
w
Q}>
+=0rn
:::s
E
:::s
() 500 0 -500 -1000 -1500 -2000 -2500 -3000 -3500 0 -100 -200 -300 -400 -500 -600 -700 0 0 90 180 270 360 450 540 630 720 810 (b) ·waii-FAA2 Waii-R2 90 180 270 360 450 540 630 720 81 0Time (day)
Figure 10. Comparison between heat loss in wall with furred-airspace assembly (Waii-FAA2) and wall without furred-airspace assembly (Waii-R2)
800
Time= 715 days (a)
-
E 760Heat loss in Waii-R1 is 17.7% higher than Waii-FAA1
':::;- 720 セ@ Ill Ill
.9
GQ...
QJ c w I"CC...
{2-
E ... -. セ@ Ill Ill 0 ... セ@...
680 セMMM 640 -600 560 720 680 '·-Wall with FAA (Waii-FAA1) 655
Time= 733 days
Heat loss in Waii-R2 is 17.1% higher than Waii-FAA2
640 -セ@ 600 ' w I"CC
...
{2 560 520 •Wall with FAA (Waii-FAA2)
590
Wall without FAA (Waii-R1) 771
MMM セ MMMMM
(b)
Wall without FAA (Waii-R2) 691
![Table 1. Properties of different materials used in numerical simulations [25, 26, 27]](https://thumb-eu.123doks.com/thumbv2/123doknet/14130928.469060/15.918.117.800.146.355/table-properties-different-materials-used-numerical-simulations.webp)
![Figure 2. Measurements of Soil temperature at 2m away from the Waii-FAA1 [21, 22, 23]](https://thumb-eu.123doks.com/thumbv2/123doknet/14130928.469060/17.1188.100.1040.79.775/figure-measurements-soil-temperature-m-away-waii-faa.webp)
![Figure 3. Measurements of Soil temperature at 2m away from the Waii-FAA2 [24]](https://thumb-eu.123doks.com/thumbv2/123doknet/14130928.469060/18.1188.102.1039.85.760/figure-measurements-soil-temperature-m-away-waii-faa.webp)
![Figure 4. Measurements of outdoor and indoor temperatures for Waii-AA 1 [21, 22 , 23]](https://thumb-eu.123doks.com/thumbv2/123doknet/14130928.469060/19.918.121.804.129.1021/figure-measurements-outdoor-indoor-temperatures-waii-aa.webp)
![Figure 5. Average temperatures of soil, outdoor and indoor (averaging within 2 week) at different time during the 1st year (Waii-FAA1 [21, 22, 23])](https://thumb-eu.123doks.com/thumbv2/123doknet/14130928.469060/20.1188.101.1042.120.738/figure-average-temperatures-outdoor-indoor-averaging-different-waii.webp)