HAL Id: hal-00296764
https://hal.archives-ouvertes.fr/hal-00296764
Submitted on 6 Jun 2006
HAL is a multi-disciplinary open access
archive for the deposit and dissemination of
sci-entific research documents, whether they are
pub-lished or not. The documents may come from
teaching and research institutions in France or
abroad, or from public or private research centers.
L’archive ouverte pluridisciplinaire HAL, est
destinée au dépôt et à la diffusion de documents
scientifiques de niveau recherche, publiés ou non,
émanant des établissements d’enseignement et de
recherche français ou étrangers, des laboratoires
publics ou privés.
A virtual tornadic thunderstorm enabling students to
construct knowledge about storm dynamics through
data collection and analysis
W. A. Gallus Jr., C. Cervato, C. Cruz-Neira, G. Faidley
To cite this version:
W. A. Gallus Jr., C. Cervato, C. Cruz-Neira, G. Faidley. A virtual tornadic thunderstorm enabling
students to construct knowledge about storm dynamics through data collection and analysis. Advances
in Geosciences, European Geosciences Union, 2006, 8, pp.27-32. �hal-00296764�
www.adv-geosci.net/8/27/2006/
© Author(s) 2006. This work is licensed under a Creative Commons License.
Advances in
Geosciences
A virtual tornadic thunderstorm enabling students to construct
knowledge about storm dynamics through data collection and
analysis
W. A. Gallus Jr., C. Cervato, C. Cruz-Neira, and G. Faidley
3025 Agronomy, Iowa State University, Ames, Iowa, 50011, USA
Received: 15 September 2005 – Revised: 10 February 2006 – Accepted: 5 March 2006 – Published: 6 June 2006
Abstract. A visually realistic tornadic supercell
thunder-storm has been constructed in a fully immersive virtual reality environment to allow students to better understand the complex small-scale dynamics present in such a storm through data probing. Less-immersive versions have been created that run on PCs, facilitating broader dissemination. The activity has been tested in introductory meteorology classes over the last four years. An exercise involving the virtual storm was first used by a subset of students from a large introductory meteorology course in spring 2002. Sur-veys were used at that time to evaluate the impact of this activity as a constructivist learning tool. More recently, data probe capabilities were added to the virtual storm activity en-abling students to take measurements of temperature, wind, pressure, relative humidity, and vertical velocity at any point within the 3-D volume of the virtual world, and see the data plotted via a graphical user interface. Similar surveys ap-plied to groups of students in 2003 and 2004 suggest that the addition of data probing improved the understanding of storm-scale features, but the improved understanding may not be statistically significant when evaluated using quizzes reflecting short-term retention. The use of the activity was revised in 2005 to first have students pose scientific ques-tions about these storms and think about a scientific strategy to answer their questions before exploring the storm. Once again, scores on quizzes for students who used the virtual storm activity were slightly better than those of students who were exposed to only a typical lecture, but differences were not statistically significant.
Correspondence to: W. A. Gallus Jr.
1 Introduction
In 1996, the U.S. National Research Council (in the National Science Education Standards; NRC, 1996) and the National Science Foundation (Shaping the Future; NSF, 1996) urged that all students have access to excellent undergraduate ed-ucation in science, and that these students learn science by direct experience with the methods and processes of inquiry. Such methods are common in the fields of chemistry and physics where laboratory experiments allow students to di-rectly measure quantities with instruments and experience phenomena with their senses. In meteorology, the difficulty of reproducing most atmospheric phenomena in the class-room restricts similar applications.
To get around this restriction for at least one atmospheric phenomenon, we have developed a tool that takes advantage of most people’s inherent fascination with severe weather and tornadoes and allows students to discover, measure, and explore in a virtual supercell thunderstorm environment. The virtual storm will be described in this paper, and preliminary results from pedagogical studies using the tool will be pre-sented.
2 Background
The content and teaching methodology for the introductory meteorology course where the virtual storm activity has been tested at Iowa State University is based on a constructivist approach (e.g., Yarger et al., 1999). With this approach, the individual learner ‘constructs’ his/her own knowledge and skills (e.g., Dewey, 1933/1998) based upon their current and past knowledge. Bruner (1990) outlines the principles of constructivist theory as:
28 W. A. Gallus Jr. et al.: Virtual tornadic thunderstorm enabling students to construct knowledge
1
Fig. 1. Two users of the virtual storm, nearing the tornado within
the CAVE™ environment.
1. Instruction must be concerned with the experiences and contexts that make the student willing and able to learn (readiness);
2. Instruction must be structured so that it can be easily grasped by the student;
3. Instruction should be designed to facilitate extrapolation and/or fill the gaps.
Following these guiding principles, learning in the me-teorology class is focused on web-based simulations and weather forecasting and in-class activities where students discover principles and formulate hypotheses on their own. These are supplemented by short periods of lecturing to in-troduce fundamental principles of atmospheric physics and weather phenomena. This is also reflected in the grad-ing scale that strongly de-emphasizes traditional exams and bases the grade mainly on the activities that the students have performed on their own or in small teams. The virtual storm activity is based on the same principles of active engagement and discovery by the individual students within a virtual re-ality environment (e.g., Winn, 1993; Dede, 1995).
The goals and constructs of the virtual storm activity are similar to those of the Visual Geophysical Exploration Envi-ronment (VGEE) project (e.g., Pandya et al., 2002; Bramer et al., 2006), which combines new pedagogical models with advances in technology to create an inquiry-based geo-science learning environment (see http://www.dpc.ucar.edu/ vgee/intro.html for more details). Bramer et al. have noted that with increasingly complex technological tools such as powerful visualizations, special care must be taken with in-troductory level students to ensure that they receive the same
1
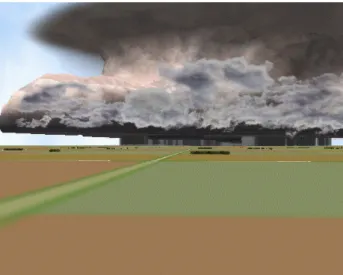
Fig. 2. View of the PC version of the virtual tornadic supercell
looking roughly west from a point about 25 miles away from the tornado.
benefits scientists would from the visualization. They rec-ommend the use of concept models, probes, and traditional content to achieve this goal.
3 Overview of the virtual storm
Initial development of the virtual supercell thunderstorm be-gan at a time when numerical model simulations of tor-nadic supercells did not accurately reproduce many of the well-known visual features that span a wide range of spa-tial scales (e.g., comma-shaped rain core, tornado). The nu-merical model output was not visually realistic enough to allow its direct inclusion into the virtual world. Thus, it was determined that the virtual storm would have to be cre-ated from scratch, making use of an artist frequently con-sulting with a meteorologist. Photographs, videos, and guid-ance from those with experience in tornado intercept projects were used heavily to create this visually realistic artistic ren-dering of a tornadic supercell. The result might be thought of as a 21st century three-dimensional (3-D) version of the simple two-dimensional (2-D) schematics often used in text-books to convey complex information to students. Using the method described above, a virtual supercell thunderstorm scaled to match those commonly observed was created. It could be viewed in a highly immersive CAVE™-like envi-ronment (Cruz-Neira et al., 1993) or on a desktop PC.
A view of two users within the CAVE™ environment can be seen in Fig. 1. The virtual storm represents an instant in time during the mature, roughly steady-state, stage of a tor-nadic supercell, and includes such visually realistic features as a wall cloud, tornado, tail cloud, comma-shaped rain re-gion, anvil cloud, rear-flank downdraft clear slot, mammatus,
and shelf cloud. The thunderstorm cloud itself was scaled to be roughly 10 miles across its narrow axis and 50 miles long, with anvil cloud extending far downwind at high levels. Au-dio representing the roar of the tornado, rain of varying in-tensities, and hail is also present in the appropriate regions of the storm. A view of the storm from a large distance away is shown in Fig. 2.
One design challenge faced during construction was al-lowing flexibility in the application of the virtual tool. The virtual storm was designed so that it could be used in almost any educational setting, from K-12 through graduate educa-tion. During the initial development, different software had to be used for the highly immersive CAVE™ version than for the version that would run on PCs more directly accessible to students. Changes were later made to use the VRJuggler virtual reality framework (Bierbaum et al., 2001) which al-lows the same version to be used on the desktop and in the immersive environment. This change along with the change from a proprietary graphics library to an open source one al-lows for widespread dissemination of the virtual tool on most platforms.
The distinct visual features present in the virtual storm (e.g., wall cloud, anvil cloud, tornado) can serve as the mo-tivation for students to explore and reason. In the early ver-sion of the activity, students could only experience the storm through their visual sense. Thus, when students were work-ing with the virtual storm they were given questions to guide their exploration and encourage scientific thinking such as:
1. Where is the tornado usually found within the storm? 2. Why do forecasters look for a hook shape in the rain
area to find a likely location for a tornado?
These questions, and similar ones, would require students to navigate throughout the storm. During such navigation, students would note that their entire perspective of the storm changes as they move into regions with lower cloud bases or restricted visibility due to rain (see Fig. 3). The naviga-tion can be performed as though one is driving (as would be common among National Weather Service storm “spot-ters” in the United States) or flying (which might be what researchers would experience in a research aircraft during an experiment). Questions like (1) are then used as a catalyst to have students offer explanations for why the tornado is not in the middle of the storm. The questions used at Iowa State University in 2005 to guide students in an introductory meteorology class in discovery of storm-scale processes are shown in Appendix A.
4 Data probing capability
To provide additional opportunities for students to discover, explore, and learn as scientists would, data-probing capabil-ity was added to the application via a Graphic User Inter-face (GUI). Based on observational studies in the literature
1
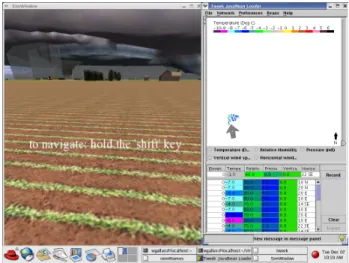
Fig. 3. PC version of activity, showing both graphical window and
GUI. Large gray arrow shows direction student is facing at left. Stu-dent has selected temperature to plot, and perturbation values are shown in color in GUI window. Data from a range of weather pa-rameters is shown in table in lower portion of GUI.
such as Wakimoto et al. (1998) and Markowski et al. (2002), a data field was created for several atmospheric parameters to match the visual features of the virtual supercell thunder-storm. Figures showing vertical motion, pressure perturba-tions and horizontal winds at different elevaperturba-tions were taken from Wakimoto et al. and assumed to roughly represent the virtual storm. Temperature perturbations and relative humid-ity values were also assigned based on Wakimoto et al. and Markowski et al., and simple parcel theory. The spatial dis-tribution of significant perturbations in these fields was care-fully matched with the depiction of the cloud and precipi-tation regions within the virtual storm. These data were in-terpolated to 5–8 vertical levels chosen to capture important layers within the storm. For instance, temperature pertur-bations near the ground (lowest kilometer or so) reflect the low-level cold pool associated with melting and evaporation of rain, and adiabatic warming within the rear-flank down-draft. At middle levels (roughly 2–8 km elevation) the warm core within the buoyant updraft can be sampled. Relative humidities depict some of the same features.
The GUI was developed using the Tweek software pack-age. Tweek is an extensible toolkit that allows a 2-D Java GUI to communicates with virtual environment applications (Hartling and Cruz-Neira, 2005). This software allowed the 2-D GUI to be separated from the virtual storm itself, which was presented within a separate graphics window (see Fig. 3). The only information passed between the two is the user’s position in the virtual space, and the direction the user is looking. The GUI allows a student to sample data at any point as they navigate in the virtual world. The measure-ments that they take are then displayed on a map, along with all prior measurements. To control the large amounts of data
30 W. A. Gallus Jr. et al.: Virtual tornadic thunderstorm enabling students to construct knowledge that can accumulate, simple color-coding is used on the map,
and more precise data readings are displayed in a separate ta-ble beneath the map. In Fig. 3, the student has sampled sev-eral points for temperature information. The sampling can occur in three dimensions – a slider scale on the right side of the GUI map allows the student to move up or down in the atmosphere. When a student samples data, the data are assumed to be collected from an instrument operating like a vertical sounder. Thus, all information in the vertical is collected at a single point by just one click of the mouse but-ton. The student not only sees the value of weather parame-ters sampled, but also knows the location where the data are valid – an arrow in the GUI window indicates the horizontal position, while elevation information is provided next to the weather data.
To improve navigation, the GUI was designed so that stu-dents can choose to either navigate around in the virtual storm graphics window (left side of Fig. 3), or simply click positions on the GUI map (right side of Fig. 3), in which case they are taken immediately to that spot in the virtual world. Although there are pros and cons for navigating in each win-dow, most students have been found to prefer to use the vir-tual world for navigation. This result is surprising since the GUI is a much faster way to probe the system, and students should quickly observe that. There is some evidence stu-dents may use the GUI more as they become more familiar with the activity. Clicking in the GUI window is the fastest way to move to a particular spot in the storm environment, but because of limited resolution, precise positioning (such as what would be needed to find the coldest temperature per-turbation at the surface in the area of heaviest rain and hail) can require navigation in the virtual storm graphics window.
5 Impact on student learning
Preliminary studies of the impact of the use of the activity on student learning have been conducted over four years. Dur-ing sprDur-ing 2002, the GUI was not available; durDur-ing 2003, a simple version of the GUI had just been developed, and stu-dents could probe for temperature information alone. The completed activity has been available to students in 2004 and 2005. During each year, surveys and quizzes were distributed to the 200–400 students enrolled in the introductory meteo-rology course at Iowa State University (MTEOR 206). One survey was performed at the beginning of the semester to determine students’ interest in various meteorological top-ics, opinions about science, and initial understanding about severe weather and tornadoes. Because the virtual storm ac-tivity itself was only available on PCs in one lab during the 4 semesters of testing, volunteers were solicited from the class with the promise of extra credit for participation. During each of the four years, between 10–25 students served as a test group for the use of the application. In all four years, it was found that final course grades for the test group were
similar to those of the remainder of the students, and thus the sample was a representative subset. Because the testing was designed to determine the impact of the activity used in a constructivist setting, the students used the virtual storm prior to any lectures being given on severe weather. These students were given instructions on how to use the activity and were then sent into the virtual world (some in teams of 2) to answer a few questions. As mentioned above these ques-tions were tailored to encourage the students to explore the system and discover the pertinent information.
After these students had completed the use of the virtual storm, they were given a survey to provide feedback on their experience with the activity. In addition, these students were given a quiz testing their understanding of severe thunder-storms with tornadoes. Later in the semester, after a tradi-tional lecture on severe thunderstorms and tornadoes, the en-tire class was given the same quiz on their understanding of these topics.
During the first year, the virtual storm group’s scores on the classroom-wide quiz improved by an average of 3.8 points over what they received when taking the quiz imme-diately after exploring the virtual storm. This result was sta-tistically significant (paired t-test, p=0.0002). The students also had a higher average score on the second quiz than the rest of the class, but the result was not statistically signif-icant, implying the virtual storm by itself was not a good means of teaching about tornadic storms. The purely visual aspect of the activity in this first year (no GUI yet available) may have limited its use as a constructivist tool (students ex-posed to the virtual storm prior to having any other teaching about severe storm dynamics). Student feedback, although usually positive, did suggest three shortcomings: (i) more in-formation was desired than just what the eye could see, (ii) navigation was cumbersome, and (iii) students often became disoriented.
Some of these shortcomings were addressed in year 2 when the simple GUI was added. The GUI allowed for the addition of other visual information, and the group of stu-dents indicated in surveys that problems with getting disori-ented disappeared. The average results from the quizzes were almost identical to the previous year. The students scored an average of 3.5 points higher on the second quiz than on the first. This was again found to be statistically significant (paired t-test, p=0.098). Once again there was also not a sta-tistically significant difference between the students that used the virtual storm and those that did not. However, variance in scores in the quiz immediately following the virtual storm activity was much less than in year 1, which together with the fact that the mean score was about the same, implies the data probing may have helped all students to do well, and resulted in less dependence of performance on prior knowledge about severe thunderstorms and tornadoes. Additional testing in year 3 showed similar results to that from the earlier years.
Finally, in 2005, the application of the activity was altered based on positive results that had been found in the use of
a science writing heuristic applied to chemistry laboratories (Rudd et al., 2002). Students were first asked to write some of their own questions about severe thunderstorms and tor-nadoes and then asked to think of data collection strategies they should perform to answer their questions. After this more methodological approach was applied, the scores of student volunteers after taking quiz two were again found to average higher than those of students who did not use the virtual activity, but differences were not statistically signifi-cant. The lack of statistical significance may be due to the fact that constructivist activities such as this one have their greatest benefit in long-term retention or application of ma-terial (Lehrer, 1993), and the use of multiple choice quizzes immediately after exposure to the activity to measure impact during these four years is a poor measure of its impact (Ful-lan, 1993; Reeves and Okey, 1996). It is also likely, however, that the use of the activity without any prior lecturing on the topic put students at a disadvantage, as they may have lacked a sufficient existing knowledge base on to which they could integrate new knowledge (Yarger and Thomas, 1999).
6 Conclusions
A virtual tornadic thunderstorm has been developed to al-low student exploration and discovery of storm-scale atmo-spheric dynamics. The virtual storm has been developed us-ing VR software that allows for widespread dissemination and use on both PCs and immersive systems. The visual real-ism of the storm and a user-friendly GUI that allows students to collect and display meteorological data permit the entire tool to be used in a wide range of educational settings from K-12 (elementary school students enjoy simply “touring” the storm as though it were a video game, whereas high school students are able to make meaningful conclusions based on weather data they collect) through graduate-level meteorol-ogy courses.
Learning outcomes collected during four consecutive years with the Virtual Tornado activity in various stages of development suggest that this tool is best used to comple-ment instruction in the traditional lecture environcomple-ment. Al-though most students feel comfortable navigating in a virtual learning environment, they still require guidance to grasp the complexity of a severe thunderstorm system and to under-stand the causes of the multiple phenomena occurring within the system. Future work should include testing with groups of students having exposure to lecture material prior to use of the virtual storm activity. In addition, improvements in the impact of the activity might also be obtained by exposing stu-dents to more simple applets (e.g., Ackerman and Whittaker 2005) demonstrating processes important in severe storm and tornado formation prior to use of the virtual storm itself.
Appendix A
The following comments and questions were used to guide students in their use of the virtual storm activity during test-ing in 2005.
This exercise will place you in a virtual environment where you will experience a severe thunderstorm similar to those occurring in nature. Before beginning, think about the severe storms you may have experienced in your lifetime or heard about, and storms that produce tornadoes. What are some questions you have about these types of storms, and features you don’t fully understand about them?
Think about the questions you wrote down earlier. What data do you think you will have to record to try to answer your questions? In what areas/locations do you think you would need to collect these data?
For today, we will use the structure below to investigate the storm. Please answer the questions below by spending time navigating all around the storm. In addition, keep in mind your own questions that you raised above. In some of the questions below, you will need to take temperature and wind measurements.
1. Explore the storm and sketch what you think the cloud area and precipitation area would look like if viewed from directly above, as though a weather satellite were seeing it.
2. Find the tornado in the storm, and note its location on your sketch on the previous page.
3. Describe the general wind pattern outside of the storm (what directions are the winds blowing, and how do these change as you go up in the atmosphere)?
4. Describe how the patterns of cloud and precipitation re-late to the location of the tornado, and give possible rea-sons for any symmetry or asymmetry you see (in other words, is the tornado right in the middle, toward the side, etc., and why do you think it is where it is). 5. Determine where the coldest temperature perturbation
exists near the ground, and discuss what you see going on there.
6. Explain why the temperatures may have become so cool there.
7. Explore the area within 1–2 miles of the tornado near the ground and describe what the temperature field looks like (what are the temperature perturbations and how do they vary)?
8. Explain what you think is happening to produce the temperature perturbations you see near the tornado (if it is cold, why is it cold; if it is warm, why is it warm).
32 W. A. Gallus Jr. et al.: Virtual tornadic thunderstorm enabling students to construct knowledge 9. REFLECTION: How have your ideas about severe
thunderstorms changed, if at all?
10. Try to answer your own questions that you wrote down earlier. If you need to, explore the storm and collect additional data you think you might need to answer your questions. What do you think the data are showing with respect to your questions?
11. Finally, write an explanation of tornadic storms that you would use if you had to teach 10th grade students at a local high school about the storms.
Acknowledgements. The authors thank T. Parham, P. Dixon,
M. Larson and M. Paik for their assistance with the statistical analysis. The comments of two anonymous reviewers were appre-ciated. This research was funded by NSF CCLI grant DUE0127465. Edited by: E. Cutrim, M. Ramamurthy, S. Nativi, and L. Miller Reviewed by: anonymous referees
References
Ackermann, S. and Whittaker, T.: http://profhorn.meteor.wisc.edu/ wxwise, 2005.
Bierbaum, A. D., Just, C., Hartling, P., Meinert, K., Baker, A., Cruz-Neira, C.: VR Juggler: A virtual platform for virtual reality ap-plication development, IEEE VR 2001, Yokohama, Japan, March 2001, 89–96, 2001.
Bramer, D. J., Scheitlin, T., Deardorff, R., Elliott, E., Hay, K., Mar-lino, M., Middleton, D., Pandya, R., Ramamurthy, M., Wein-groff, M., and Wilhelmson, R.: Using an interactive JAVA-based environment to facilitate visualization comprehension, Preprints, 18th Conference on IIPS, Amer. Meteor. Soc, Atlanta, GA, J11.2., 2006.
Bruner, J., 1990: Acts of meaning. Cambridge, MA: Harvard Uni-versity Press.
Cruz-Neira, C., Sandin, D., and DeFanti, T.: Surround-screen Projection-based Virtual Reality: the design and implementation of the CAVE, SIGGRAPH 93 Conference Proceedings, 27, 135– 142, 1993.
Dede, C.: The evolution of constructivist learning environments: immersion in distributed, virtual worlds, Educational Tech-nology, 35(5), 46–52, http://www.virtual.gmu.edu/ss pdf/constr. pdf, 1995.
Dewey, J.: How we think (Rev. ed.), Boston, MA, Houghton Mifflin Company, 1933/1998.
Fullan, M.: Change Forces: Probing the Depth of Educational Re-form, Falmer Press, 162 pp., 1993.
Hartling, P. and Cruz-Neira, C.: Tweek: A framework for cross-display graphical user interfaces, Computational Science and its Applications – ICCSA 2005: International Conference, Singa-pore, May 9–12, 2005, Proceedings, Part III, Lecture Notes in Computer Science, 3482, 1060–1069, 2005.
Lehrer, R.: Authors of knowledge: Patterns of hypermedia design, in: Computers as Cognitive Tools, edited by: Lajoe, S. P. and Derry, S. J., Lawrence Erlbaum Press, 197–227, 1993.
Markowski, P. M., Straka, J. M., and Rasmussen, E. N.: Direct thermodynamic observations within the rear-flank downdraft of nontornadic and tornadic supercells, Mon. Wea. Rev., 130, 1692– 1721, 2002.
National Research Council: National Science Education Standards, National Academy Press, Washington, D.C., 1996.
National Science Foundation: Shaping the Future: New Expec-tations for Undergraduate Education in Science, Mathematics, Engineering, and Technology, (NSF 96-139) Washington D.C., 1996.
Pandya, R., Bramer, D., Elliot, D., Hay, K. E., Marlino, M., Middle-ton, D., Ramamurthy, M., Scheitlin, T., Weingroff, M., and Wil-helmson, R.: An inquiry-based learning strategy from the VGEE, Proceedings of the Eleventh Symposium on Education, Orlando, FL, Amer. Meteor. Soc., 4.2., 127–128, 2002.
Reeves, T. C. and Okey, J.: Alternative assessment for construc-tivist learning environments, Construcconstruc-tivist Learning Environ-ments, edited by: Wilson, B., Educational Technology, 191–202, 1996.
Rudd II, J. A., Greenbowe, T., and Hand, B. M.: Recrafting the General Chemistry Lab Report., J. College Sci. Teaching, 31, 230–234, 2002.
Wakimoto, R. M., Liu, C., and Cai, H.: The Garden City, Kansas storm during VORTEX 95. Part I: Overview of the storm’s life cycle and mesocyclogenesis, Mon. Wea. Rev., 126, 372–392, 1998.
Winn, W.: A conceptual basis for educational applications
of virtual reality, http://www.hitl.washington.edu/publications/ r-93-9/, 1993.
Yarger, D. N. and Thomas, R.: Learning science in the 21st
century, http://www.page.ucar.edu/pub/cominteract/discussion/ currenttopic/current topic.htm, 1999.
Yarger, D. N., Thomas, R., Pease, L., Boysen, V., and Boysen, J. P.: A model for problem solving in introductory science courses, Proc. M/SET 99: Int. Conf. on Mathematics/Science Education and Technology, San Antonio, TX, Association for the Advance-ment of Computing in Education, 575–579, 1999.