HAL Id: inserm-00527722
https://www.hal.inserm.fr/inserm-00527722
Submitted on 22 Sep 2011
HAL is a multi-disciplinary open access
archive for the deposit and dissemination of
sci-entific research documents, whether they are
pub-lished or not. The documents may come from
teaching and research institutions in France or
abroad, or from public or private research centers.
L’archive ouverte pluridisciplinaire HAL, est
destinée au dépôt et à la diffusion de documents
scientifiques de niveau recherche, publiés ou non,
émanant des établissements d’enseignement et de
recherche français ou étrangers, des laboratoires
publics ou privés.
Cross-frequency coupling in mesiotemporal EEG
recordings of epileptic patients.
Alessandro Villa, Igor Tetko
To cite this version:
Alessandro Villa, Igor Tetko.
Cross-frequency coupling in mesiotemporal EEG recordings of
epileptic patients..
Journal of Physiology - Paris, Elsevier, 2009, 104 (3-4), pp.197-202.
Cross-frequency coupling in mesiotemporal EEG recordings of epileptic patients
Alessandro E.P. Villaa,b, Igor V. TetkocaInserm, UMR S 836, Grenoble Institut des Neurosciences, France ; University Joseph Fourier Grenoble 1, France
bNeuroheuristic Research Group, Information Systems Department ISI, University of Lausanne, Switzerland
cInst. for Bioinformatics (MIPS), GSF National Research Center, Neuherberg, Germany
Abstract
Semi-invasive foramen ovale (Fov) electrodes were used to record electrical activity in the vicinty of the inferior mesial temporal region of epileptic patients, in addition to standard scalp EEG. Third order cumulant analysis was used to measure the phase-coupled frequencies corresponding to non-linear coupling of spectral frequency components, somewhat analogous to frequencies of resonance. On the basis of the distribution of these frequencies, an index of resonance (IR) is defined as the ratio between the number of peaks in the gamma-band (40 − 55 Hz) vs. the number of peaks in the beta-band (15 − 30 Hz). The epileptogenic focus was located in the hemisphere with lower resonant frequencies because these frequencies were characteristic of a spread of the seizure over a broader area. In the case of Fov electrodes IR could differentiate a group of patients affected by a tumor compared to patients with mesial temporal sclerosis. The novel index IR appears as an interesting parameter to evaluate the level of interareal functional connectivity in Fov recordings in epileptic patients, but its usage is likely to be extended in electrophysiological studies.
Key words: Mesiotemporal lobe epilepsy, epileptic focus, cortico-cortical resonances, bispectrum, bicoherence
1. Introduction
Patients with medically refractory mesiotemporal epilepsy are characterized by an actively discharging epileptiform re-gion that induces paroxysmal behavior in a homologous site of the contralateral hemisphere (Williamson et al., 1993; Stein-hoff et al., 1995). Entrainment of both temporal and frequency domain characteristics of temporal lobe activity may depend on both local connections and external inputs, mainly cortico-cortical and thalamic (Canolty et al., 2006; Jensen and Col-gin, 2007). The exact localization and spreading pattern of the seizure can be assessed with electrophysiological recordings only from subdural and depth electrodes (King and Spencer, 1995) and is otherwise determined by neuroimaging techniques (Velasco et al., 2002; Joo. et al., 2004). However, the invasive-ness and the costs of these methods may not be made available or tolerated by several patients.
Non-invasive electroencephalographic (EEG) recordings with scalp electrodes are routinely performed on epileptic pa-tients but these data may be distorted by skull defects and un-derlying lesions or deformities of the brain (Scherg et al., 1999). Semi-invasive (foramen ovale, Fov) electrodes allow to record electrical activity in the vicinty of the inferior mesial tempo-ral region with less artifacts (Wieser et al., 1985; Carter et al., 1998) and become more often used in addition to the stan-dard international EEG 10/20 montage positions. Then, these recordings may offer the advantage of exploring mesiotempo-ral lobe activity with higher-order frequency domain analyses– bispectral analysis–that allow to determine the nonlinear com-Email addresses: Alessandro.Villa@ujf-grenoble.fr (Alessandro
E.P. Villa)
ponents of the interactions in the frequency domain (Brillinger, 1965; Lii and Helland, 1981; Schanze and Eckhorn, 1997).
Bicoherence is a normalization method which compares the actual bispectrum with a zero phase bispectrum, i.e. a bispec-trum with the highest degree of phase coupling (Nikias and Raghuveer, 1987). It shows the degree of phase coupling be-tween frequency components of one or more signals. In brain electric activity, such non-linearities would occur when two fre-quency components are in harmonic resonnance or if two brain electric waves interact and generate a new energy component at a frequency, called Quadratic Phase coupling, which is the sum of the frequencies of its source components. Bispectral analy-sis was used for the study of non-linear interactions in several animal studies (Villa et al., 1999, 2000). In human studies, bis-pectral analysis of EEG (Ning and Bronzino, 1993; Sigl and Chamoun, 1994; Johansen and Sebel, 2000) became routinely applied for studying the levels of arousals and anesthesia with controversial outcome (Hagihira et al., 2002; Miller et al., 2004; Schulz et al., 2007) and to cognitive studies of areal interactions (Freeman et al., 2003; Jensen and Colgin, 2007).
Dynamic brain oscillations have extensively been studied in epileptic patients and revealed several changes in the power spectra of EEG signal before and after the epileptic seizures (Le Van Quyen and Bragin, 2007). Recent evidence of spec-tral instabilities during the pre-ictal intervals (Aksenova et al., 2007) suggest that scalp and Fov recordings might reveal more information about the activity of neural circuits after careful analysis of bispectra. In the current study we define a novel index, called index of resonance, based on third order spec-tral (bispecspec-tral) analysis of EEG recordings. We report the ap-plication of this method to EEG data (scalp and Fov
record-ings) recorded in patients characterized by medically refractory complex partial seizures. In addition to its clinical application, such index might be used in other studies to describe dynamic changes of neural interactions.
2. Methods
2.1. Patients data
We analyzed the data of ten patients, 9 men and 1 woman (mean age, 26.6 years; range, 13-39 years), all with therapy re-fractory mesiotemporal epilepsy. Four patients were affected by mesotemporal sclerosis and underwent hippocampal amyg-dalectomy. Five were affected by different types of tumors and underwent resection of the tumor. One patient was character-ized by a traumatic lesion of the temporal lobe and underwent a 2/3 anterior temporal lobe resection. All patients were seizure-free during at least one year post-operation. The patients were consecutively examined in the local program for presurgical evaluation, which has been approved by the ethical commit-tee of the University of Bern. Informed consent about using the routine diagnostic data for research purposes was given by all patients prior to entering the presurgical evaluation program.
2.2. EEG data acquisition
For scalp EEGs the standard 10/20 montage positions were used with referential montages to two preauricular electrodes. For analyzing scalp EEG, the 18 signals from electrodes Fp1, F3, F7, F9, T3, T5, P3, C3, O1 from the left side and Fp2, F4, F6, F8, T4, T6, P4, C4, O2 from the right side were used. Fov EEG was recorded with 2 foramen ovale electrodes (Wieser et al., 1985), each having four contacts, manufacturing type CAD-FO-B4 (Ad-Tech Medical Instrument Corp., Wis-consin). We used an EEG-1032 amplifier system (La-Mont Medical, Inc., Wisconsin). After passing an anti-aliasing fil-ter with a cutoff frequency of 70 Hz and an attenuation of 24 dB/oct. The EEG signals were sampled at 200 Hz and A/D conversion had a resolution of 16 bit. We used the Har-monie 5.0 software (Stellate Systems, Montreal) for EEG data acquisition. The onset of the seizure was determined by the first clinical manifestation (in the majority of the cases an epi-gastric aura) reported by the patient or observed by a person familiar with the recognition of mesio-temporal lobe epileptic seizure. Electroencephalo-graphically, seizure onset was de-fined as the first unequivocal appearance of typical continu-ous epileptiform activity recognized by an experienced elec-troencephalographer like spikes, polyspikes, spike and wave patterns, evolving and spreading low-amplitude fast or high-amplitude slow EEG rhythms, which preceded, accompanied or followed clinical signs. Short (< 2s) bursts of epileptiform EEG potentials without any symptoms or behavioral signs were not interpreted as seizures. The complete EEG recordings were visually inspected and analyzed to make sure that no seizures were missed.
We analyzed 23 EEG samples lasting 20 minutes, including at least 5 minutes pre-ictal and 5 minutes post-ictal. The sam-ples were divided into epochs of 5 seconds.
!"#$$%&'() 1 k ! "#$%&'&
!
&#&(#$%&)&*#$%&)&(#$%&*#$%&%& !(#$%&'&+,-#." /&$&)&#(&% *#$%&'&+,-#." .&$&)&#*&%
000
000
!"#$$%&'(*
1#$%&'&
!
&#&+#$%&)&2#$%&)&+#$%&*#$%&%&&&!
+#$%&'&+,-#."& /&$&)&#+&% 2#$%&'&+,-#."& .&$&)&% *#$%&'&+,-#."& .&$&)&#*&%
000 000 1 k ! #
(3&#*3&#+3&&(45&6725857257$&89(-5-&67&:;&3&."<
=5+,4252&-6>7(?-!
/ /) . . !"#$$%&'() @"# % A45BC57+" !"#$$%&'(* A45BC57+" @1# % / /) . .@,D54&-85+$4CE
"
@11# %&'&F
&1# %F
.A,C4654&$4(7-G,4E
#
H# %&'&
!
&1#$%&5Ii&$&."& &!
@""# %&'&
F
&J# %F
. J# %&'&!
&"#$%&5Ii&$&."& &!
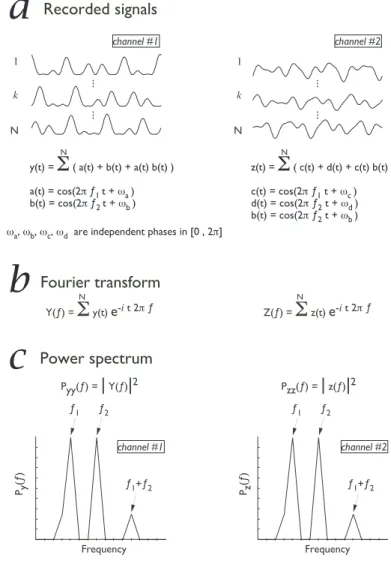
Figure 1: Outline of the unresolving result provided by power spectrum analy-sis when the recorded signals depend on phase relations more than in frequency relations. (a) Assume that two signals, y(t) and z(t), were recorded simultane-ously from separate channels. Each signal was recorded for N epochs of equal time. (b) Calculation of the Fourier transform of each signal. (c) Calculation of the power spectrum for each signal. See text for more details.
2.3. Data analysis
Signal analysis functions are subdivided into classes derived from their relationship with the statistical moments and cumu-lant series. Second order cumucumu-lant class includes correlation, power spectrum density and coherence. As second order cumu-lant statistics decompose the signal into a linear combination of mutually uncorrelated frequency components (Huber et al., 1971), they can be applied only to stationary signals and cannot be used to detect signal components which are in non-linear, phase dependent, relationships (Nikias and Raghuveer, 1987). Third order cumulant statistics are based on skewness. They can detect whether the signal deviates from normality, i.e. is non-Gaussian (Brillinger, 1965; Huber et al., 1971; Nikias and Raghuveer, 1987). Third order cumulant analysis include the bicorrelation, the bispectrum and the bicoherence. They keep the phase relationship between the signal components and thus can detect if some of them are non linearly coupled.
Third order cumulant analysis of the electrophysiological recordings can be briefly described as follows. Firstly, let us consider a case study where an analog signal from a single channel, e.g. an EEG signal x(t), is recorded during N epochs of equal duration, such that x(t) = PN(a(t) + b(t) + a(t)b(t)) where a(t) = cos(2π f1t + ωa), b(t) = cos(2π f2t + ωb) and f1,
f2 represent two frequencies of periodic processes and ωa,ωb
are phases randomly changed, i.e. uniformly distributed in [0, 2π], for each epoch. Notice the non-linear interaction is rep-resented by the term a(t)b(t) (Fig. 1). The spectral represen-tation of this signal X( f ) is obtained by the Fourier transform
X( f ) =PNx(t)e−it2π f
. The power spectrum is Pxx( f ) = |X( f )|2
and its shape will show peaks corresponding to frequencies f1,
f2and f3= f1+ f2(Fig. 1).
Power spectrum analysis is unable to differentiate phase re-latioships in recorded signals because this analysis is not suf-ficient to determine if the peak at frequency f3 corresponds to
a genuine non-linear interaction produced by the two oscilla-tory processes that interact-and generate a third component or if it corresponds to an independent frequency. In order to re-solve this ambiguity we compute the bispectrum Bxxx, defined
by Bxxx =PNX( f1) X( f2) , X∗( f1+ f2) where X∗( f ) is the
con-jugate of X( f ). Bxxx will be near 0 in case of independence
(Brillinger, 1965), and for the peaks in the bispectrum we esti-mate the value of the interaction by the bicoherence Cxxx,
de-fined by Cxxx= |Bxxx|2/Pxx( f1) Pxx( f2) Pxx( f1+ f2).
Let us assume a case study x(t) characterized by an interac-tion, represented by the term a(t)b(t), between f1and f2so that
a significant value of the bicoherence is observed for bifrequen-cies ( f1,f2). We tested the hypothesis that the bispectrum was
equal to zero (Huber et al., 1971; Brillinger and Irizarry, 1998) at the 99% confidence limit to detect the significant interactions at couples of frequencies f1and f2. Phase-coupled frequencies
f3= f1+ f2were determined for corresponding significant
bis-pectral analysis at couples of frequencies f1and f2. Frequency
f3defined the “frequency of resonnance”. In order to avoid
bi-ased sampling (i.e., due to differences in gain of amplitude set for the recording from different subjects) only ten most signif-icant peaks in bicoherence were considered here in each EEG sample.
3. Results
The bispectral analysis was performed for all channels sepa-ratedly in accordance to the side where the epileptogenic focus was located, in a retrospective manner after pathology was de-termined by magnetic resonance imagery and complementary clinical analyses. The data recorded from the four leads of one
foramen ovale electrode were grouped together. We defined an index of resonance IR as the ratio between the relative fre-quency of peaks in the gamma-band (40-55 Hz) and the relative frequency of peaks in the beta-band (15-30 Hz). This means a large value of IR corresponds to a shift of f3towards higher
fre-quencies (gamma-band) and a low value of IR corresponds to a shift of f3towards lower frequencies (beta-band).
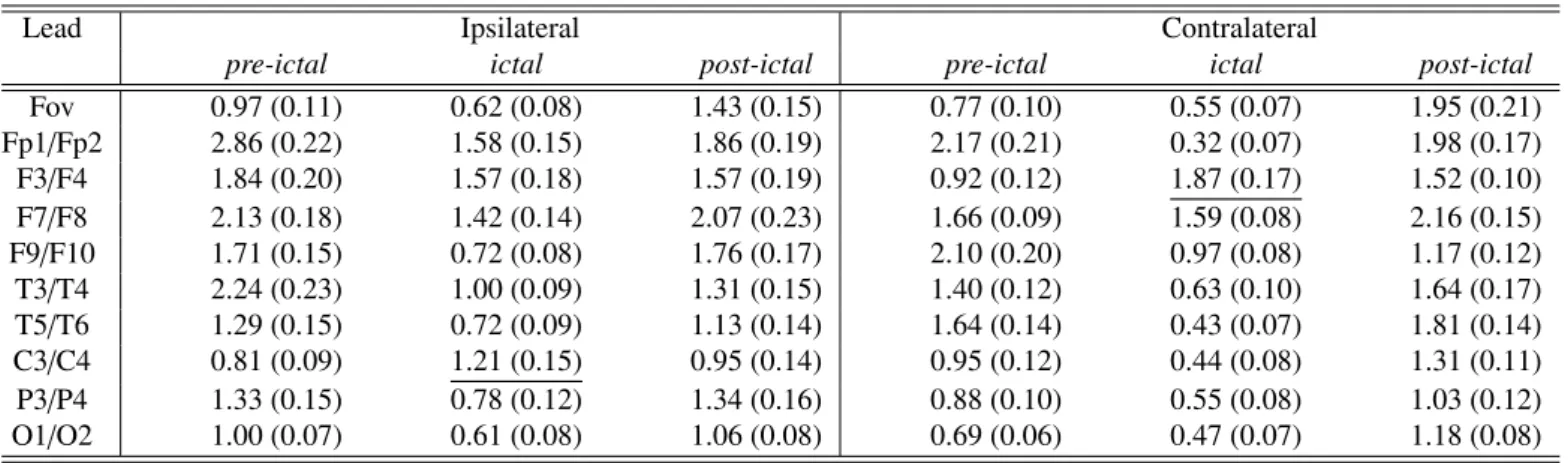
Table 1 shows the values of IR before, during and after seizure sorted according to the ipsilateral and contralateral
! " #! #" $! $" #! $! %! &! "! '! (! ! !"#$%#&'()*+),#-*&&.&'#)/012 ,#3.456#)!"#$%#&'()/72 !"#$%&'()$*"#)+ #! $! %! &! "! '! (! ! ! " #! #" $! $" ,#3.456#)!"#$%#&'()/72 !"#$%#&'()*+),#-*&&.&'#)/012 ,)-.#)'()$*"#)+ ! " #! #" $! $" #! $! %! &! "! '! (! ! ,#3.456#)!"#$%#&'()/72 !"#$%#&'()*+),#-*&&.&'#)/012 /-0)#'()$*"#)+ 89:8;<=>,<;)=?) >98;>9=?@>A8B)!?BC: ! " ! " ! " ! " #! #" $! $" #! $! %! &! "! '! (! ! ,#3.456#)!"#$%#&'()/72 !"#$%#&'()*+),#-*&&.&'#)/012 ! " #! #" $! $" #! $! %! &! "! '! (! ! ,#3.456#)!"#$%#&'()/72 !"#$%#&'()*+),#-*&&.&'#)/012 ! " #! #" $! $" #! $! %! &! "! '! (! ! ,#3.456#)!"#$%#&'()/72 !"#$%#&'()*+),#-*&&.&'#)/012 !"#$%&'()$*"#)+ ,)-.#)'()$*"#)+ /-0)#'()$*"#)+ B?A=,<;<=>,<;)=?) >98;>9=?@>A8B)!?BC: ! " ! " ! "
!
"
#
$
%
&
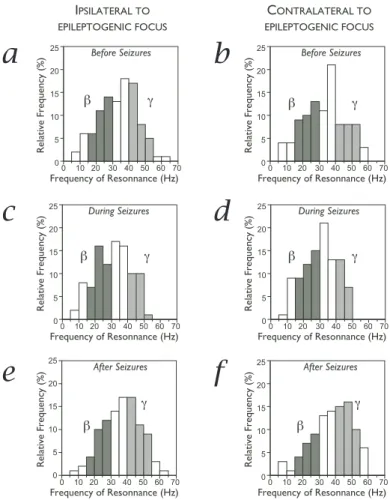
Figure 2: Foramen ovale electrodes. Relative distribution of the frequencies of resonnance before (a,b), during (c,d) and after seizures (e,f) in the ipsilateral (a,c,e) and contralateral (b,d,f) hemispheres to the epileptic focus. Bin size corresponds to 10 Hz intervals. All values refer to results obtained from Fov electrodes. Frequencies in range 15-30 Hz were classified in the beta band (dark grey) and frequencies in range 40-55 Hz were clasified in the gamma band (light grey).
hemisphere to the epileptogenic focus. The general pattern was a decrease of IR during seizures (ictal periods) within and across patients in both hemispheres. Notice that in most loca-tions the values of IR after seizure recovered values close to those measured in the pre-ictal period. There are two important exceptions to the general pattern of IR changes. At first, frontal leads F3 / F4 show only a moderate, if any, decrease of IR in the ipsilateral hemisphere but a significant increase (Chi-square test, 2p < 0.001) of gamma-band components in the contralat-eral hemisphere during the ictal periods. In the latter case the value of IR after seizure tended to recover the pre-ictal level at a slower pace with respect to most locations. Secondly, central leads C3 / C4 in the ipsilateral hemisphere show also a ten-dency to an increase in IR but the significance level was barely close to 5%. In the contralateral hemisphere the pattern of IR variation for central leads C3 / C4 was in line with the general observation, i.e. a decrease of IR during seizure followed by a recovery close to pre-ictal levels.
The foramen ovale electrodes were located in the vicinity of the mesiotemporal lobe and the subsequent analysis is focused on results obtained from recordings of Fov EEG. Figure 2
il-Table 1: Index of resonance (average ± SEM) calculated before, during and after seizure in the ipsilateral and contralateral hemisphere to the epileptogenic focus. The underlined values indicate the only cases characterized by an increase of IR in the ictal periods.
Lead Ipsilateral Contralateral
pre-ictal ictal post-ictal pre-ictal ictal post-ictal
Fov 0.97 (0.11) 0.62 (0.08) 1.43 (0.15) 0.77 (0.10) 0.55 (0.07) 1.95 (0.21) Fp1/Fp2 2.86 (0.22) 1.58 (0.15) 1.86 (0.19) 2.17 (0.21) 0.32 (0.07) 1.98 (0.17) F3/F4 1.84 (0.20) 1.57 (0.18) 1.57 (0.19) 0.92 (0.12) 1.87 (0.17) 1.52 (0.10) F7/F8 2.13 (0.18) 1.42 (0.14) 2.07 (0.23) 1.66 (0.09) 1.59 (0.08) 2.16 (0.15) F9/F10 1.71 (0.15) 0.72 (0.08) 1.76 (0.17) 2.10 (0.20) 0.97 (0.08) 1.17 (0.12) T3/T4 2.24 (0.23) 1.00 (0.09) 1.31 (0.15) 1.40 (0.12) 0.63 (0.10) 1.64 (0.17) T5/T6 1.29 (0.15) 0.72 (0.09) 1.13 (0.14) 1.64 (0.14) 0.43 (0.07) 1.81 (0.14) C3/C4 0.81 (0.09) 1.21 (0.15) 0.95 (0.14) 0.95 (0.12) 0.44 (0.08) 1.31 (0.11) P3/P4 1.33 (0.15) 0.78 (0.12) 1.34 (0.16) 0.88 (0.10) 0.55 (0.08) 1.03 (0.12) O1/O2 1.00 (0.07) 0.61 (0.08) 1.06 (0.08) 0.69 (0.06) 0.47 (0.07) 1.18 (0.08) ! " # !"#$%&'(&)$*'""+",$ -). 2345"6& -/01 *$5734$* ,'"84+ 59*5 ,'"84+ 59*5 1:;/) ;1&0<=.)/0!0
Figure 3: Scatterplot of the Index of Resonnance (IR) before (PRE), during and after (POST) seizures for nine patients sorted out according to the hemisphere of the epileptic focus and to the etiology of the epilepsy. Mean values ± SEM are indicated. Notice that after seizures the IR tended to be larger in patients affected by mesiotemporal sclerosis vs. tumor for both ipsi- and contra-lateral hemispheres.
lustrates the cumulated distribution of relative frequencies of phase coupling in the range 5 − 70 Hz for all patients grouped together and for both hemispheres. We observed a decrease of gamma activity, in particular the disappearance of any fre-quency of resonnance higher than 55 Hz, and an increase in beta activity during the ictal periods. For both hemispheres grouped together IR was minimal (0.59 ± 0.08, average ± SEM) during seizure and maximal after seizure (1.67 ± 0.18).
The post-seizure period was the most important for the ob-servation of a significant difference (Chi-square test, 2p < 0.05) between IR calculated in the ipsilateral hemisphere to the epileptogenic area (IR = 1.43) vs. contralateral hemisphere (IR = 1.95) This difference was significant for the grouped values and consistently observed for all subjects. During the post-seizure interval IR tended to be larger than during the
pre-ictal period. However, in this comparison we observed a greater variability between patients and the comparison of the grouped values sorted by hemisphere was not statistically different.
A more refined analysis was attempted to investigate whether post-seizure IR could differentiate the patients following the eti-ology of the epilepsy. Two groups were formed with respect to the pathology determined after magnetic resonance imaging, as mesial temporal sclerosis (n=4) or tumor (n=5). After seizure
IRwas lower in the group of patients with a tumor, in the ipsi-as well contra-lateral side to the epileptogenic area (Fig. 3) but this tendency was not statistically significant.
4. Discussion
This study has demonstrated that non-linear analysis of Fov recordings by mean of bispectral analyses provides useful sta-tistical value in localizing the side of the epileptogenic focus in patients who have medically intractable temporal lobe epilepsy. Bispectral analysis allowed us to detect significant changes in
Fov EEG that could not be observed by second order cumu-lants. Our results support the hypothesis that cross-frequency coupling (Jensen and Colgin, 2007), and not merely the power of neural activity, is varied according to changes triggered by the circuits involved in the initiation of the epileptic seizures (Le Van Quyen and Bragin, 2007). Notice that we computed a single value of IR in each period because we looked for fea-tures that could be found in common for several patients. The value of IR could be calculated on shorter time scales (e.g. on a one-minute time base) for a detailed analysis of the evolving seizure and more complex indexes combining time varying IR with spectral instabilities (Aksenova et al., 2007) might repre-sent a valid tool for further clinical assessment.
The application of bispectral analysis to monitor levels of arousal in routine clinical studies is often reduced to one patented measurement called bispectral index (BIS) provided by commercially available devices (Aspect Medical Systems Inc., Newton, MA). The BIS value (Kelley, 2007) is summing up several features of the EEG and it was advised to monitor 4
the depth of anesthesia (Avidan et al., 2008). However, the comparison of entropy indices with BIS revealed the limits of that technique even for monitoring anesthetic states under cer-tain conditions (Takamatsu et al., 2006). Then, the fact that raw applications of BIS to recordings performed in epileptic patients failed to show lateralization effects (Heller et al., 2005; Ohshima et al., 2007) cannot represent an argument against the value of bispectral analysis in its whole. Actually, bispectral analysis was successfully used to detect ischemic cerebral in-juries and monitor their course (Huang et al., 2007).
Our results show that the phase couplings observed in the post-ictal periods tended to occur at frequencies higher than during ictal recordings. Resonances occur as a result of interfer-ence between waves traveling in different directions that com-bine to form standing wave patterns (Nunez, 1995). This phe-nomenon requires that each neural mass has a relatively large number of synapses so that signals are transferred between two locations in a time roughly proportional to the distance between the two locations. In one-dimensional standing waves, a spatial frequency corresponds to each frequency of resonance. In mul-tidimensional waves likely to be generated in a complex struc-ture such as the cerebral cortex, the concept of spatial frequency is not precise but the general idea that high spatial frequencies correspond to high temporal frequencies is preserved (Nunez, 1995). Then, a decrease in the index of resonance IR, as usually observed during the ictal periods, indicate a spread of the activ-ity over an extended cortical area. The significant difference be-tween contralateral, with higher frequencies of resonance, and ipsilateral hemispheres clearly indicates that the index IR pro-vides relevant information about the location of the epilepto-genic focus. Indeed, the epileptoepilepto-genic focus appears located in the area with lower resonnant frequencies because this corre-sponds to the area where the seizure can propagate more easily. This appears as an interesting validation of the interpretation of
IR. The observation of specific electrodes showing an opposite course of IR might reveal the transient activation/desactivation of neural circuits induced by seizure dynamics and opens the way of further investigation.
Last but not least, we shall mention the possibility to compare our results with a current source density analysis computing inverse solutions during the intervals of interest. In this case particular attention should be paid to the choice of the reference because it may affect significantly the outcome of the analysis (Hagemann et al., 2001; Tenke and Kayser, 2005). The current study was primarily aimed at comparing the results between the two hemispheres. The choice of a referential montage to two preauricular electrodes was more dictated by the willingness of computing power maps with larger total power than looking for a precise localization which would have required an ideal infinity reference (Dezhong et al., 2005).
In conclusion, the index IR appears as an interesting param-eter to evaluate the level of interareal functional connectivity in
Fovrecordings in epileptic patients, but its usage is likely to be extended in electrophysiological studies.
Acknowledgements
The authors wish to thank the Dept. of Neurology of the Insel-spital Bern, Switzerland, for providing the EEG data used for this study and in particular Dr. F. Donati and Dr. Schindler for their help in data management, and M. Kollar for assistance in EEG recording. The project was partially supported by Swiss National Science Foundation grant no. 7-IP-062620.
References
Aksenova, T. I., Volkovych, V. V., Villa, A. E. P., 2007. Detection of spectral instability in eeg recordings during the preictal period. J. Neural Eng. 4, 173–178.
Avidan, M. S., Zhang, L., Burnside, B. A., Finkel, K. J., Searleman, A. C., Selvidge, J. A., Saager, L., Turner, M. S., Rao, S., Bottros, M., Hantler, C., Jacobsohn, E., Evers, A. S., 2008. Anesthesia awareness and the bispectral index. N. Engl. J. Med. 358, 1097–1108.
Brillinger, D. R., 1965. An introduction to polyspectra. Ann. Math. Stat. 36, 1351–1374.
Brillinger, D. R., Irizarry, R. A., 1998. An investigation of the second- and higher-prder spectra of music. Signal Processing 65, 161–179.
Canolty, R. T., Dalal, E. E. S., Soltani, M., Nagarajan, S. S., Kirsch, H. E., Berger, M. S., Barbaro, N. M., Knight, R. T., 2006. High gamma power is phase-locked to theta oscillations in human neocortex. Science 313, 1626– 1628.
Carter, D. A., Lassiter, A. T., Brown, J. A., 1998. Cost-efficient localization of seizures of mesiotemporal onset with foramen-ovale electrodes. Neurol. Res. 20, 153–160.
Dezhong, Y., Li, W., Oostenveld, R., Nielsen, K. D., Arendt-Nielsen, L., Chen, A. C. N., 2005. A comparative study of different references for eeg spec-tral mapping: the issue of the neuspec-tral reference and the use of the infinity reference. Physiol. Meas. 26, 173–184.
Freeman, W. J., Burke, B. C., Holmes, M. D., 2003. Aperiodic phase re-setting in scalp eeg of beta-gamma oscillations by state transitions at alpha-theta rates. Human Brain Mapping 19, 248–272.
Hagemann, D., Naumann, E., Thayer, J. F., 2001. The quest for the eeg refer-ence revisited: A glance from brain asymmetry research. Psychophysiology 38, 847–857.
Hagihira, S., Takashina, M., Mori, T., Mashimo, T., Yoshiya, I., 2002. Changes of electroencephalographic bicoherence during isoflurane anesthesia com-bined with epidural anesthesia. Anesthesiol. 97, 1409–1415.
Heller, H., Hatami, R., Mullin, P., Sciacca, R., Khandji, A. G., Hamberger, M., Emerson, R., Heyer, E. J., 2005. Bilateral bispectral index monitoring during suppression of unilateral hemispheric function. Anesth. Analg. 101, 235–241.
Huang, L., Zhao, J., Singare, S., Wang, J., Wang, Y., 2007. Discrimination of cerebral ischemic states using bispectrum analysis of eeg and artificial neural network. Med. Eng. Phys. 29, 1–7.
Huber, P. J., Kleiner, B., Gasser, T., Dumermuth, G., 1971. Statistical meth-ods for investigating phase relations in stationary stochastic processes. IEEE Trans. Audio Electroac. AU 19, 78–86.
Jensen, O., Colgin, L. L., 2007. Cross-frequency coupling between neuronal oscillations. Trends Cogn. Sci. 11, 267–269.
Johansen, J. W., Sebel, P. S., 2000. Development and clinical application of electroencephalographic bispectrum monitoring. Anesthesiol. 93, 1336– 1344.
Joo., E. Y., Lee, E. K., Tae, W. S., B., H. S., 2004. Unitemporal vs bitemporal hypometabolism in mesial temporal lobe epilepsy. Arch. Neurol. 61, 1074– 1078.
Kelley, S. D., 2007. Monitoring Consciousness Using the Bispectral Index Dur-ing Anesthesia, 2nd Edition. Aspect Medical Systems Inc., Newton, MA, U.S.A.
King, D., Spencer, C., 1995. Invasive electroencephalography in mesial tempo-ral lobe epilepsy. J. Clin. Neurophysiol. 12, 32–45.
Le Van Quyen, M., Bragin, A., 2007. Analysis of dynamic brain oscillations: methodological advances. Trends Neurosci. 30, 365–373.
Lii, K. S., Helland, K. N., 1981. Cross-bispectrum computation and variance estimation. ACM Trans. Math. Software 7, 284–294.
Miller, A., Sleigh, J. W., Barnard, J., Steyn-Ross, D. A., 2004. Does bispectral analysis of the electroencephalogram add anything but complexity? Br. J. Anaesth. 92, 8–13.
Nikias, C. L., Raghuveer, M. R., 1987. Bispectrum estimation: a digital signal processing framework. Proc. IEEE 75, 869–891.
Ning, C. L., Bronzino, J. D., 1993. Nonlinear analysis of the hippocampal sub-fields of ca1 and the dentate gyrus. IEEE Trans. Biomed. Eng. 40, 870–876. Nunez, P. L., 1995. Neocortical dynamics and human EEG rhythms. Oxford
University Press, Oxford, U.K.
Ohshima, N., Chinzei, M., Mizuno, K., Hayashida, M., Kitamura, T., Shibuya, H., Hanaoka, K., 2007. Transient decrease in bispectral index without asso-ciated changes in the level of consciousness during photic stimulation in an epileptic patient. Br. J. Anaesth. 98, 100–104.
Schanze, T., Eckhorn, R., 1997. Phase correlation among rhythms present at different frequencies: spectral methods, application to microelectrode recordings from visual cortex and functional implications. Int. J. of Psy-chophysiol. 26, 171–189.
Scherg, M., Bast, T., Berg, P., 1999. Multiple source analysis of interictal spikes: goals, requirements, and clinical value. J. Clin Neurophysiol. 16, 214–224.
Schulz, U., Keh, D., Barner, C., Kaisers, U., , Boemke, W., 2007. Bispectral index monitoring does not improve anesthesia performance in patients with movement disorders undergoing deep brain stimulating electrode implanta-tion. Anesth. Analg. 104, 1481–1487.
Sigl, J. C., Chamoun, N. G., 1994. An introduction to bispectral analysis for the electroencephalogram. J Clin Monit. 10, 392–404.
Steinhoff, B. J., So, N. K., Lim, S., Luders, H. O., 1995. Ictal scalp eeg in temporal lobe epilepsy with unitemporal versus bitemporal interictal epilep-tiform discharges. Neurology 45, 889–896.
Takamatsu, I., Ozaki, M., Kazama, T., 2006. Entropy indices vs the bispec-tral index for estimating nociception during sevoflurane anaesthesia. Br. J. Anaesth. 96, 620–626.
Tenke, C. E., Kayser, J., 2005. Reference–free quantifiation of eeg spectra: Combining current source density (CSD) and frequency principal compo-nents analysis (FPCA). Clin. Neurophysiol. 116, 2826–2846.
Velasco, T. R., Wichert-Ana, L., Leite, J. P., Araujo, D., Terra-Bustamante, V. C., Alexandre, V., Kato, M., Assirati, J. A., Machado, H. R., Carlotti, C. G., Sakamoto, A. C., 2002. Accuracy of ictal spect in mesial temporal lobe epilepsy with bilateral interictal spikes. Neurology 59, 266–271. Villa, A. E. P., Tetko, I. V., Dutoit, P., De Ribaupierre, Y., De Ribaupierre, F.,
1999. Corticofugal modulation of functional connectivity within the audi-tory thalamus of rat. J. Neurosci. Meth. 86, 161–178.
Villa, A. E. P., Tetko, I. V., Dutoit, P., Vantini, G., 2000. Non-linear cortico-cortical interactions modulated by cholinergic afferences from the rat basal forebrain. BioSystems 58, 219–228.
Wieser, H. G., Elger, C. E., Stodieck, S. R. G., 1985. The ’foramen ovale elec-trode’: a new recording method for the preoperative evaluation of patients suffering from mesio-basal temporal epilepsy. Electroenceph. clin. Neuro-physiol 61, 314–322.
Williamson, P. D., French, J. A., Thadani, V. M., Kim, J. H., Novelly, R. A., Spencer, S. S., Spencer, D. D., Mattson, R. H., 1993. Characteristics of me-dial temporal lobe epilepsy: Ii. interictal and ictal scalp electroencephalogra-phy, neuropsychological testing, neuroimaging, surgical results and pathol-ogy. Ann. Neurol. 34, 781–787.