HAL Id: hal-00358785
https://hal.archives-ouvertes.fr/hal-00358785
Submitted on 21 Aug 2015
HAL is a multi-disciplinary open access
archive for the deposit and dissemination of
sci-entific research documents, whether they are
pub-lished or not. The documents may come from
teaching and research institutions in France or
abroad, or from public or private research centers.
L’archive ouverte pluridisciplinaire HAL, est
destinée au dépôt et à la diffusion de documents
scientifiques de niveau recherche, publiés ou non,
émanant des établissements d’enseignement et de
recherche français ou étrangers, des laboratoires
publics ou privés.
based on the BASCOE chemical transport model
N. Theys, M. van Roozendael, Q. Errera, F. Hendrick, F. Daerden, S.
Chabrillat, M. Dorf, K. Pfeilsticker, A. Rozanov, W. Lotz, et al.
To cite this version:
N. Theys, M. van Roozendael, Q. Errera, F. Hendrick, F. Daerden, et al.. A global stratospheric
bromine monoxide climatology based on the BASCOE chemical transport model. Atmospheric
Chem-istry and Physics, European Geosciences Union, 2009, 9 (3), pp.831-848. �10.5194/acp-9-831-2009�.
�hal-00358785�
www.atmos-chem-phys.net/9/831/2009/
© Author(s) 2009. This work is distributed under the Creative Commons Attribution 3.0 License.
Chemistry
and Physics
A global stratospheric bromine monoxide climatology based on the
BASCOE chemical transport model
N. Theys1, M. Van Roozendael1, Q. Errera1, F. Hendrick1, F. Daerden1, S. Chabrillat1, M. Dorf2, K. Pfeilsticker2, A. Rozanov3, W. Lotz3, J. P. Burrows3, J.-C. Lambert1, F. Goutail4, H. K. Roscoe5, and M. De Mazi`ere1
1Belgium Institute for Space Aeronomy (IASB-BIRA), Brussels, Belgium
2Institute for Environmental Physics, University of Heidelberg, Heidelberg, Germany
3Institute for Environmental Physics, University of Bremen, Bremen, Germany
4Service d’A´eronomie, Verri`eres-le-Buisson, France 5British Antarctic Survey, Cambridge, UK
Received: 14 July 2008 – Published in Atmos. Chem. Phys. Discuss.: 26 September 2008 Revised: 6 January 2009 – Accepted: 8 January 2009 – Published: 3 February 2009
Abstract. A new climatology of stratospheric BrO profiles
based on a parameterization using dynamical and chemical indicators has been developed, with the aim to apply it to the retrieval of tropospheric BrO columns from space nadir measurements. The adopted parameterization is based on three years of output data from the 3-D chemistry transport model BASCOE. The impact of the atmospheric dynamics on the stratospheric BrO distribution is treated by means of
Bry/ozone correlations built from 3-D-CTM model results,
while photochemical effects are taken into account using stratospheric NO2columns as an indicator of the BrO/Bry ra-tio. The model simulations have been optimized for bromine chemistry and budget, and validated through comparisons using an extensive data set of ground-based, balloon-borne and satellite limb (SCIAMACHY) stratospheric BrO obser-vations.
1 Introduction
Inorganic bromine (Bry=Br+BrO+BrONO2+HOBr+HBr+
BrCl+2Br2) plays an important role in the stratosphere, as it is known to cause significant ozone destruction. Bromine monoxide (BrO) can significantly influence the chemical composition of the stratosphere and contribute to ozone de-pletion through catalytic reactions with NO2, ClO, HO2and O (Lary, 1996). Although inorganic bromine is present in the
Correspondence to: N. Theys (theys@aeronomie.be)
stratosphere in small quantities relative to chlorine, its large ozone depletion efficiency makes stratospheric bromine con-tribute to mid-latitude ozone loss by about 25% and to polar ozone depletion, mainly through the BrO/ClO cycle (McEl-roy et al., 1986), up to 50%.
The origin of stratospheric inorganic bromine is both nat-ural and anthropogenic. The major contribution to the strato-spheric inorganic bromine budget comes from long-lived bromine-containing organic source gases, transported from the Earth’s surface to the stratosphere, where they are con-verted into inorganic forms. The long-lived organic bromine species currently contribute to the stratospheric Bry load-ing by about 16–17 pptv (Montzka et al., 2003). This es-timate is based on a budget of observations of the main long-lived organic bromine source gases (CH3Br, CBrClF2, CBrF3, CBrF2CBrF2). However, several recent studies based on measurements of stratospheric BrO using remote-sensing UV-visible techniques from ground-based (Sinnhuber et al., 2002; Schofield et al., 2004 and 2006; Hendrick et al., 2007; Theys et al., 2007), balloon-borne (Pundt et al., 2002; Salawitch et al., 2005; Dorf et al., 2006a, b and 2008) and space-borne limb (Sinnhuber et al., 2005; Sioris et al., 2006) instruments have inferred a total inorganic bromine load-ing of 18–25 pptv, suggestload-ing that an additional contribution must be considered, possibly due to bromine release from
short-lived biogenic organic compounds (such as CHBr3,
CH2Br2, CH2BrCl, CHBr2Cl, CHBrCl2, CH2BrCH2Br) or even through direct injection of inorganic bromine from tro-pospheric origin into the lower stratosphere (WMO, 2007).
affect the ozone loss and chemical composition in the lower stratosphere and substantially influence ozone trend simula-tions (e.g. Salawitch et al., 2005; Feng et al., 2007).
Inorganic bromine compounds can also be present in the
free-troposphere due to the decomposition of CH3Br and
VSLS bromine compounds. This is supported by observa-tions from space (Wagner and Platt, 1998; Richter et al., 2002; Van Roozendael et al., 2002), the ground (Hendrick et al., 2007; Theys et al., 2007) and balloon (Harder et al., 1998; Fitzenberger et al., 2000). Based on the observational es-timates of bromine monoxide in the free-troposphere, mod-elling results (von Glasow et al., 2004; Lary, 2005; Yang et al., 2005) have shown that bromine might have a significant impact on tropospheric ozone (and on tropospheric chemistry in general), leading to a reduction in the O3mixing ratio of up to 40% locally. Further down in the boundary layer, in-organic bromine compounds have been shown to be respon-sible for complete ozone depletion events (ODEs) in the po-lar regions, during the so-called popo-lar spring bromine explo-sion event (Hausmann and Platt, 1994; Kreher et al., 1997; H¨onninger and Platt, 2002; Frieß et al., 2004; Simpson et al., 2007). Although in smaller quantities, tropospheric BrO emissions have also been identified over salt lakes (Hebe-streit et al., 1999), as well as in the marine boundary layer (Leser et al., 2003) and in volcanic plumes (Bobrowski et al., 2003).
Satellite UV-visible nadir instruments (such as
GOME/ERS-2, SCIAMACHY/ENVISAT and
GOME-2/MetOp-1) offer the unique capability to study and monitor BrO at the global scale (Chance, 1998; Richter et al., 2002; Van Roozendael et al., 2002; Wagner et al., 1998). However, to quantitatively investigate and characterize the spatial and seasonal variations of tropospheric BrO, the measured total BrO vertical column densities (VCDs) must be resolved into their stratospheric and tropospheric contributions.
Here, we report on the development of a stratospheric BrO profile climatology designed for use in the retrieval of global tropospheric BrO VCDs from space-borne nadir ob-servations. A new method for the estimation of the strato-spheric BrO content is proposed, which is able to reproduce the important spatial and temporal variations of stratospheric BrO by using dynamical and chemical indicators. In prac-tice, the climatology uses measured quantities to evaluate stratospheric BrO, which makes the approach well suited for satellite nadir retrieval since it guarantees that the sounded air masses and geophysical conditions are optimally repre-sented. In Sect. 2, we briefly review the 3-D chemical trans-port model (CTM) which is at the heart of our study. We describe the set-up of bromine species implemented in the model, in the light of our current understanding of strato-spheric bromine photochemistry and budget. The treatment of sulphate aerosols in the model is also presented, since it can have a substantial impact on the stratospheric chemistry. Comparisons between modelled results and correlative
ob-servations of O3, NO2and BrO are shown in Sect. 3. The
stratospheric BrO profile (and corresponding column) clima-tology is developed and presented in Sect. 4, together with an error analysis. Conclusions are given in Sect. 5.
2 Model
The model used is the stratospheric 3-dimensional chemi-cal transport model which forms the core of BASCOE, a 4-dimensional variational (4-D-Var) chemical data assimilation system designed for the analysis and forecast of stratospheric ozone and chemical species (see http://bascoe.oma.be). The CTM is described in Errera and Fonteyn (2001), Daerden et al. (2007) and Errera et al. (2008). It includes a full descrip-tion of stratospheric chemistry based on 57 chemical species and a parameterization of the microphysics of polar strato-spheric clouds (PSCs). All chemical species are advected and interact through 144 gas-phase reactions, 48 photoly-sis reactions and 9 heterogeneous reactions, all listed in the Jet Propulsion Laboratory (JPL) compilation evaluation 14 (Sander et al., 2003). The CTM is driven by the European Centre for Medium-Range Weather Forecasts (ECMWF) op-erational analysis of temperatures and winds. The model is defined on 37 pressure levels from the surface to 0.1 hPa, on a 3.75◦latitude and 5◦longitude grid, with a model time step of 30 minutes. While the model extends down to the surface, it does not include any tropospheric process and is not ex-pect to produce a realistic chemical composition below the tropopause.
The data used in this study result from a CTM run (no assimilation) initialized with analysis of MIPAS assimilation (details can be found in Errera et al., 2008). The simulations start on 1st April 2003 and end on 31st March 2006, covering three years of data.
2.1 Bromine species
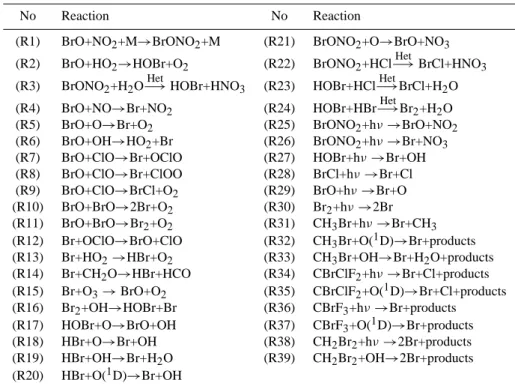
The BASCOE 3-D CTM includes a detailed bromine chem-istry scheme involving the photochemical reactions listed in Table 1. Inorganic bromine species interact through 30 gas-phase and heterogeneous photochemical reactions.
Simula-tions include the reaction of BrONO2+O(3P)→BrO+NO3,
since several studies (Soller et al., 2001; Sinnhuber et al., 2002) found that this reaction can lead to increasing day-time BrO amount above 25 km, especially at low latitudes. Updated kinetic and photochemical data for bromine species are taken from the JPL compilation evaluation 15 (Sander et al., 2006). Sensitivity tests have been made to estimate the impact on the simulated BrO fields of the incomplete (i.e. limited to bromine reactions) porting of the BASCOE chem-ical scheme to JPL evaluation 15 chemchem-ical kinetics and pho-tochemical data. Differences in the BrO concentrations were found to be lower than 7%, with respect to a complete update of the full chemistry. This source of error is considered as be-ing rather small compared to the BrO observational error (see Sect. 3.2).
Table 1. Bromine reactions included in the BASCOE model.
No Reaction No Reaction
(R1) BrO+NO2+M→BrONO2+M (R21) BrONO2+O→BrO+NO3
(R2) BrO+HO2→HOBr+O2 (R22) BrONO2+HCl
Het −→BrCl+HNO3 (R3) BrONO2+H2O Het −→HOBr+HNO3 (R23) HOBr+HCl Het −→BrCl+H2O
(R4) BrO+NO→Br+NO2 (R24) HOBr+HBr−→HetBr2+H2O
(R5) BrO+O→Br+O2 (R25) BrONO2+hν →BrO+NO2
(R6) BrO+OH→HO2+Br (R26) BrONO2+hν →Br+NO3
(R7) BrO+ClO→Br+OClO (R27) HOBr+hν →Br+OH
(R8) BrO+ClO→Br+ClOO (R28) BrCl+hν →Br+Cl
(R9) BrO+ClO→BrCl+O2 (R29) BrO+hν →Br+O
(R10) BrO+BrO→2Br+O2 (R30) Br2+hν →2Br
(R11) BrO+BrO→Br2+O2 (R31) CH3Br+hν →Br+CH3
(R12) Br+OClO→BrO+ClO (R32) CH3Br+O(1D)→Br+products
(R13) Br+HO2→HBr+O2 (R33) CH3Br+OH→Br+H2O+products
(R14) Br+CH2O→HBr+HCO (R34) CBrClF2+hν →Br+Cl+products
(R15) Br+O3→BrO+O2 (R35) CBrClF2+O(1D)→Br+Cl+products
(R16) Br2+OH→HOBr+Br (R36) CBrF3+hν →Br+products
(R17) HOBr+O→BrO+OH (R37) CBrF3+O(1D)→Br+products
(R18) HBr+O→Br+OH (R38) CH2Br2+hν →2Br+products
(R19) HBr+OH→Br+H2O (R39) CH2Br2+OH→2Br+products
(R20) HBr+O(1D)→Br+OH
Our calculations assume a total inorganic bromine load-ing in the stratosphere of 23 pptv, in accordance with pub-lished results (Pfeilsticker et al., 2000; Salawitch et al., 2006; Hendrick et al., 2007 and 2008a; Theys et al., 2007). The model includes the main tropospheric long-lived (LL)
or-ganic bromine sources: methyl bromide (CH3Br),
Halon-1211 (CBrClF2)and Halon-1301 (CBrF3). The volume
mix-ing ratios (VMRs) have been scaled and made consistent with surface values measured in 1999 by Montzka et al. (2003); i.e. CH3Br: 9.5 pptv, Halon-1211: 4.0 pptv and Halon-1301: 3.5 pptv (a constant 1 pptv of Br from Halon-2402 has been added to the measured 2.5 pptv of Halon-1301). The full conversion of LL organic bromine compounds into inorganic forms (occurring above ∼25 km) leads to a stratospheric Bry loading of 17 pptv, for air of 4–5 years mean age. To account for the bromine release from very short-lived species, an ad-ditional contribution of 6 pptv has been considered,
consist-ing of 5 pptv of Bry from dibromomethane (CH2Br2) and
1 pptv of tropospheric inorganic product gas directly injected at the tropopause. This method of implementing the short-lived bromine species is similar to what has been used in Feng et al. (2007).
A loss process of Bryin the troposphere through washout due to the high solubility of HBr, has been implemented and is described by a washout time τ . This washout time is as-sumed to be constant throughout the troposphere and is fixed at 15 days. Model calculations often use a mean washout time τ of about 10 to 30 days (e.g. von Glasow et al., 2004; Sinnhuber and Folkins, 2006).
2.2 Stratospheric aerosol settings
Particular attention has been paid to the treatment of the stratospheric sulphate aerosols and their impact on
strato-spheric bromine chemistry. The heterogeneous reactions
on the surface of stratospheric aerosols can significantly in-fluence the BrO/Brypartitioning through its impact on the NOx/NOyratio or directly through the heterogeneous reac-tions involving inorganic bromine species (Lary et al., 1996). In the present work, an improved set-up of stratospheric aerosols has been implemented, derived from that used in Daerden et al. (2007). The aerosol surface area density is calculated based on the aerosol size distribution, which is as-sumed to follow a log-normal shape defined by the so-called RNS parameters (R: mean radius, N: total number density, S: standard deviation). The BASCOE aerosol configuration relies on a composite profile climatology of RNS parame-ter estimates for each month of the year and for 19 zonal bands. The RNS parameters have been estimated such that the corresponding 1 µm aerosol extinction is consistent with SAGE-II extinction from Bingen et al. (2004) for latitudes
between ±60◦ and with POAM III extinction from Fromm
et al. (2003) for regions poleward of ±60◦. Adopting this
approach for the treatment of stratospheric aerosols substan-tially improves the results. This is further verified in Sect. 3.1
where BASCOE NO2 stratospheric columns are compared
with observations from ground-based UV-visible instruments of the Network for the Detection of Atmospheric Composi-tion Change (NDACC).
100 200 300 400 500 O 3
vertical columns [DU]
Harestua (60.2°N) 2003 2004 2005 GB observations BASCOE 100 200 300 400 500 Jungfraujoch (46.5°N) 2003 2004 2005 100 200 300 400 500 Kerguelen (49.4°S) 2003 2004 2005 100 200 300 400 500 Rothera (67.6°S) 2003 2004 2005
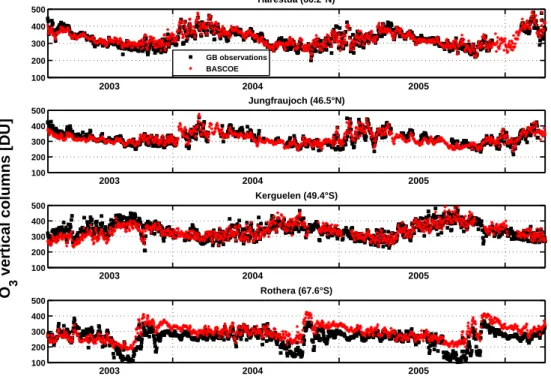
Fig. 1. Time-series of sunset stratospheric O3 vertical columns from BASCOE analysis and ground-based UV-visible observations at 4
NDACC stations (top to bottom): Harestua, Jungfraujoch, Kerguelen and Rothera. Black squares: ground-based observations; red stars: BASCOE analysis.
3 Verification of model results
Several studies have been conducted recently (Geer et al., 2006; Vigouroux et al., 2007; Daerden et al., 2007; Errera et al., 2008), where the BASCOE CTM has been extensively evaluated based on O3, NO2, H2O, HNO3, N2O and CH4 observations. These results showed that BASCOE is able to reproduce important aspects of the stratospheric composi-tion. Here, the reliability of the BASCOE results is further assessed for ozone, nitrogen dioxide (Sect. 3.1) and bromine monoxide (Sect. 3.2), by means of validation using ground-based, balloon and satellite limb observations.
3.1 Comparison of modelled and measured stratospheric
O3and NO2columns
The measurement data were obtained from zenith sky UV-visible observations, performed at four stations which are part of the NDACC (http://www.ndacc.org). The observa-tions are made during twilight periods for solar zenith angles (SZA) ranging from 86◦to 91◦. At all stations, the column
densities of O3and NO2along the optical path (slant column) have been retrieved using the DOAS (Differential Optical Absorption Spectroscopy) technique (Platt and Stutz, 2006).
The analysis is made for O3in the 435–555 nm wavelength
interval and for NO2in the 420–470 nm range. Slant columns are converted into vertical columns using an optical path en-hancement factor, or so-called air mass factor (AMF). Since
ground-based measurements are made for high SZA, the
re-trieved O3 and NO2 columns are predominantly of
strato-spheric origin. For our comparison exercise, simulated ozone and nitrogen dioxide concentration profiles have been inter-polated at the location corresponding to each station and for solar zenith angles of 90◦(representative of the ground-based retrieved columns at sunrise and sunset), and then integrated between the tropopause and the highest model level.
Figure 1 presents the modelled and measured stratospheric
O3 columns for the period from 04/2003 to 03/2006 for
Harestua (60.2◦N, 10.7◦E), Jungfraujoch (46.5◦N, 7.9◦E),
Kerguelen (49.4◦S, 70.3◦E) and Rothera (67.6◦S, 68.1◦W).
A good agreement is found for the entire period for Harestua, Jungfraujoch and Kerguelen with relative differences smaller than 15%. The observed seasonal and short-term dynamical changes are well captured by the simulations. At Rothera, the agreement is reasonable except during ozone-hole and sum-mer conditions, where BASCOE overestimates the strato-spheric O3columns by 50 to 100 DU. This confirms the find-ings of Errera et al. (2008). Note however that the mea-surements at Rothera have the tendency to underestimate the ozone columns by 10 to 15 DU for ozone hole conditions (Roscoe et al., 2001).
To a large extent, the lower stratospheric BrO concentra-tion is controlled by NO2through the termolecular reaction
BrO+NO2+M→BrONO2+M. Accurate modelling of
nitro-gen dioxide is thus a prerequisite to evaluate the stratospheric BrO amount.
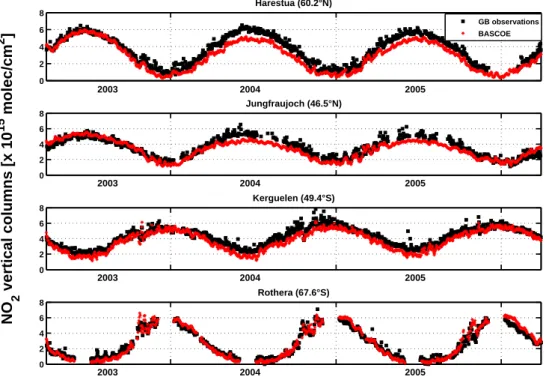
0 2 4 6 8 NO 2 vertical columns [x 10 15 molec/cm 2 ] Harestua (60.2°N) 2003 2004 2005 GB observations BASCOE 0 2 4 6 8 Jungfraujoch (46.5°N) 2003 2004 2005 0 2 4 6 8 Kerguelen (49.4°S) 2003 2004 2005 0 2 4 6 8 Rothera (67.6°S) 2003 2004 2005
Fig. 2. Time-series of sunset stratospheric NO2vertical columns from BASCOE analysis and ground-based UV-visible observations at 4
NDACC stations (top to bottom): Harestua, Jungfraujoch, Kerguelen and Rothera. Black squares: ground-based observations; red stars: BASCOE analysis.
Figure 2 shows the simulated and measured stratospheric
NO2 columns for Harestua, Jungfraujoch, Kerguelen and
Rothera. The results are shown for sunset, but similar agree-ment is obtained for sunrise conditions. Most significant features of the observed seasonal and short-term NO2 vari-abilities (related to photochemical and/or dynamical effects) are consistently reproduced by the simulations. However, the model shows a small tendency to underestimate the
re-trieved NO2 columns. This might be related to the
lim-ited time/horizontal resolution and to the fact that the mod-elled columns are estimated at twilight, conditions where
stratospheric NO2 undergoes a rapid variation with time.
Sensitivity tests show that the estimation of the modelled
stratospheric NO2 columns can be affected by this effect,
up to 0.7×10¹⁵molec/cm2, with the largest discrepancies in summer. The absolute accuracy of the retrieved
strato-spheric NO2 columns at NDACC stations can also be
lim-ited by (1) uncertainties related to the NO2absorption cross-sections and their temperature dependence (Koike et al., 1997; Roscoe et al., 1999; Vandaele et al., 2005), (2) AMF uncertainties associated with seasonal, meridian and diurnal variations of the NO2 profile shape (Lambert et al., 1999). The overall uncertainty on the retrieved stratospheric NO2 columns is of about 10%. Note that the possibility of a significant contribution to the measured column by tropo-spheric NO2from pollution is unlikely since the selected sta-tions are located in clean areas. Nonetheless, the BASCOE
model results agree in a satisfactory way with the observa-tions (differences smaller than 1.2×10¹⁵molec/cm2), know-ing the uncertainties on both modelled and measured
strato-spheric NO2columns.
3.2 Comparisons of modelled and measured stratospheric
BrO
The consistency between the stratospheric BrO profiles, as simulated by the BASCOE model, and correlative data has been verified. For this purpose, the modelled BrO profiles have been interpolated at the location and at the solar zenith angle of each observation. The measurements reported in this study performed from ground-based, balloon and satel-lite platforms, are listed in Table 2. These correlative data set sample latitudes extending from polar to tropical regions, with the advantage that the resulting comparisons can be made under a large variety of photochemical regimes.
The stratospheric BrO vertical profiles obtained by the Mi-crowave Limb Sounder (MLS) on the Aura satellite (Ko-valenko et al., 2008) has not been used for our comparisons, since these measurements are sensitive to the BrO profile over a pressure range from 10 to 3.2 hPa, where only a small fraction of the total amount of stratospheric BrO is present. Furthermore, the estimated precision and accuracy of the data make them unsuitable for our comparison study.
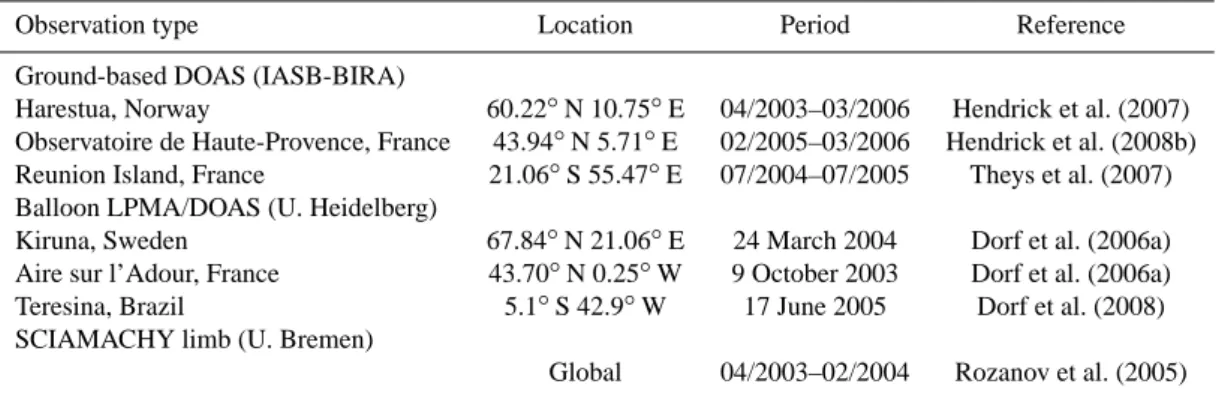
Table 2. Summary of the BrO observation data sets used for the comparisons with model results.
Observation type Location Period Reference
Ground-based DOAS (IASB-BIRA)
Harestua, Norway 60.22◦N 10.75◦E 04/2003–03/2006 Hendrick et al. (2007)
Observatoire de Haute-Provence, France 43.94◦N 5.71◦E 02/2005–03/2006 Hendrick et al. (2008b)
Reunion Island, France 21.06◦S 55.47◦E 07/2004–07/2005 Theys et al. (2007)
Balloon LPMA/DOAS (U. Heidelberg)
Kiruna, Sweden 67.84◦N 21.06◦E 24 March 2004 Dorf et al. (2006a)
Aire sur l’Adour, France 43.70◦N 0.25◦W 9 October 2003 Dorf et al. (2006a)
Teresina, Brazil 5.1◦S 42.9◦W 17 June 2005 Dorf et al. (2008)
SCIAMACHY limb (U. Bremen)
Global 04/2003–02/2004 Rozanov et al. (2005)
3.2.1 Comparison to ground-based stratospheric BrO data
The ground-based observations have been conducted by IASB-BIRA at three NDACC stations: Harestua, Observa-toire de Haute-Provence (OHP) and Reunion Island. The pe-riod covered by the simulations and the observations is April 2003–March 2006 at Harestua, February 2005–March 2006 at OHP and July 2004–July 2005 at Reunion Island. The measurements were obtained by zenith-sky UV-visible spec-troscopy. The instrumental set-ups are described by
Hen-drick et al. (2007, 2008b) and Theys et al. (2007). The
measured radiances are analysed using the DOAS technique. BrO differential slant columns densities (DSCDs) are re-trieved in the 345–359 nm wavelength range, taking into ac-count the spectral signature of BrO, NO2, O3, O4, HCHO, OClO and the Ring effect. The BrO cross-sections used are taken from Wilmouth et al. (1999). A detailed description of the BrO DOAS settings can be found in Theys et al. (2007) and Aliwell et al. (2002).
At Harestua and OHP, stratospheric BrO profiles are re-trieved by applying a profiling technique to the measured DSCDs. The retrieval algorithm is based on the Optimal Es-timation Method (Rodgers, 2000) and has been extensively described in Hendrick et al. (2007). It is based on a forward model that includes a stacked box photochemical model al-lowing to reproduce the strong diurnal variation of BrO at twilight. The stratospheric BrO profiles are retrieved for a solar zenith angle of 80◦, separately for sunrise and sunset measurements. The characterization of the information con-tent of the retrieval shows that high sensitivity to the strato-spheric BrO profile is obtained between 12 and 28 km alti-tude, with a vertical resolution of approximately 8 km.
Ground-based BrO partial columns are calculated between 12–20 km and 20–28 km, in order to take benefit from the vertical resolution offered by the profiling technique, and are compared to BASCOE data. Figures 3 and 4 present the comparisons between modelled and ground-based BrO partial columns, at Harestua and OHP respectively. The
er-0 0.5 1 1.5 2 2.5 3
BrO partial columns [10
13
molec/cm
2 ]
HARESTUA / 80° SZA Sunset 12−20 km 2003 2004 2005 0 0.5 1 1.5 2 2.5 3 20−28 km 2003 2004 2005 GB UV−vis BASCOE
Fig. 3. Comparison between modelled and ground-based strato-spheric BrO partial columns, at Harestua for 80◦SZA sunset. The BrO profiles are integrated between 12–20 km (top) and 20–28 km (bottom). Black squares: ground-based observations; red stars: BASCOE analysis.
ror bars associated with the ground-based partial columns are estimates of the random and systematic uncertainties of the retrieval. The model and ground-based data are given at 80◦SZA for sunset. At both stations, the modelled par-tial columns agree within 20–25% with the values derived from the ground-based observations. In particular, the sea-sonality of BrO, directly linked to the NO2seasonal cycle, is consistently captured by both model and ground-based data. Short-term variations linked to dynamical changes are also shown by both datasets in the lower stratosphere. Although not reproduced here, similar results are found with morning data.
At Reunion Island, the inversion of stratospheric BrO pro-files by applying the profiling technique has been found to be difficult for two reasons: (1) the poorer performance of the instrument in terms of the signal to noise ratio, and (2) the smaller BrO absorption at tropical latitudes. Consequently,
Jan050 Apr05 Jul05 Oct05 Jan06 0.5 1 1.5 2 2.5 3
Observatoire de Haute−Provence / 80° SZA Sunset 12−20 km
BrO partial columns [10
13
molec/cm
2]
Jan050 Apr05 Jul05 Oct05 Jan06
0.5 1 1.5 2 2.5 3 20−28 km GB UV−vis BASCOE
Fig. 4. Same as Fig. 3, at Observatoire de Haute-Provence.
only stratospheric BrO columns have been retrieved, us-ing an inversion method where the measured slant columns are fitted to radiative transfer simulations of the BrO slant column (see details in Theys et al., 2007). The error es-timate associated to the retrieved stratospheric columns is slightly larger for Reunion-Island than for Harestua and OHP data. For this study, we compare the retrieved and modelled stratospheric BrO columns only at a single reference SZA (fixed at 80◦for sunset). The comparison between modelled and ground-based stratospheric BrO columns is displayed in Fig. 5. The modelled BrO columns are calculated by inte-grating the stratospheric BrO profiles from the tropopause height, based on temperature profiles from ECMWF data, to the upper model level. Figure 5 shows that the modelled BrO columns are slightly smaller than the columns retrieved from ground-based measurements, but are within the error bars.
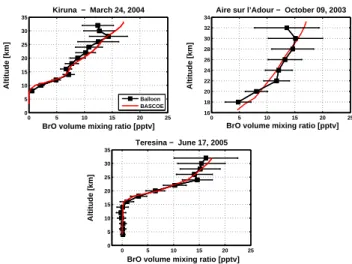
3.2.2 Comparison with LPMA/DOAS balloon profiles
A detailed description of the LPMA/DOAS (Limb Profile Monitor of the Atmosphere/Differential Optical Absorption Spectroscopy) BrO measurements used here can be found in Harder et al. (1998, 2000), Pfeilsticker et al. (2000) and Dorf et al. (2006a, b, 2008). The LPMA/DOAS measurements use the solar occultation technique. The BrO profiles are retrieved using an Optimal Estimation Technique (Rodgers, 2000) applied to the BrO slant column densities measured during the ascent of the balloon. The accuracy of the tech-nique is generally very good (better than ±12%, Harder et al., 1998) and the vertical resolution of the inverted strato-spheric BrO profile is about 2 km. A further independent constraint on BrO, and hence on total stratospheric Bry, is provided by Langley type observations of BrO absorption as function of total air mass above float altitude (>32 km) dur-ing each of balloon measurements (e.g., Dorf et al. 2006a).
For the present comparisons, three balloon flights origi-nated from Kiruna, Aire sur l’Adour and Teresina are taken
Aug040 Sep04 Oct04 Nov04 Dec04 Jan05 Feb05 Mar05 Apr05 May05 Jun05
1 2 3 4 5 Stratospheric BrO VCD [10 13 molec/cm
2] Reunion Island / 80° SZA Sunset
GB UV−vis BASCOE
Fig. 5. Comparison between modelled and ground-based strato-spheric BrO columns, at Reunion Island for 80◦SZA sunset. Black squares: ground-based observations; red stars: BASCOE analysis.
0 5 10 15 20 25 0 5 10 15 20 25 30 35
BrO volume mixing ratio [pptv]
Altitude [km] Kiruna − March 24, 2004 Balloon BASCOE 0 5 10 15 20 25 16 18 20 22 24 26 28 30 32 34
BrO volume mixing ratio [pptv]
Altitude [km]
Aire sur l’Adour − October 09, 2003
0 5 10 15 20 25 0 5 10 15 20 25 30 35
BrO volume mixing ratio [pptv]
Altitude [km]
Teresina − June 17, 2005
Fig. 6. Comparison between modelled and LPMA/DOAS ascent balloon BrO profiles at Kiruna, Aire sur l’Adour and Teresina. Black squares: balloon observations; red lines: BASCOE analysis.
into account (see Table 2 for details). The BASCOE BrO profiles have been interpolated to the location of the balloon and at the SZA corresponding to the observation (varying during the ascent of the balloon) in order to have identi-cal photochemiidenti-cal conditions between the balloon and the model profiles. Figure 6 shows the measured BrO balloon profiles together with the model calculation for the three flights. In general, we find a good agreement between the LPMA/DOAS and modelled BrO profiles. The observed dif-ferences are within the error bars of the balloon-borne pro-files. These comparison results are similar to the ones pre-sented in Feng et al. (2007) and Dorf et al. (2006a, b and 2008).
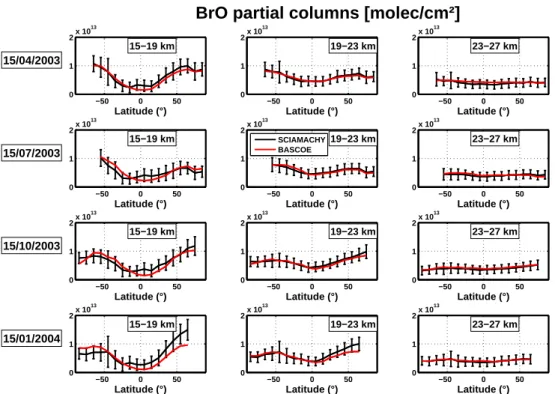
3.2.3 Comparison to SCIAMACHY limb profiles
The SCIAMACHY (Scanning Imaging Absorption Spec-trometer for Atmospheric CHartographY) instrument is in operation on the ENVISAT platform since July 2002. In the nadir and limb viewing geometries, the SCIAMACHY in-strument measures the sunlight scattered by the Earth’s atmo-sphere or reflected by the surface whereas in the occultation
−50 0 50 0 1 2x 10 13 Latitude (°)
BrO partial columns [molec/cm²]
15−19 km 15/04/2003 −50 0 50 0 1 2x 10 13 Latitude (°) 19−23 km −50 0 50 0 1 2x 10 13 Latitude (°) 23−27 km −50 0 50 0 1 2x 10 13 Latitude (°) 15−19 km 15/07/2003 −50 0 50 0 1 2x 10 13 Latitude (°) 19−23 km SCIAMACHY BASCOE −50 0 50 0 1 2x 10 13 Latitude (°) 23−27 km −50 0 50 0 1 2x 10 13 Latitude (°) 15−19 km 15/10/2003 −50 0 50 0 1 2x 10 13 Latitude (°) 19−23 km −50 0 50 0 1 2x 10 13 Latitude (°) 23−27 km −50 0 50 0 1 2x 10 13 Latitude (°) 15−19 km 15/01/2004 −50 0 50 0 1 2x 10 13 Latitude (°) 19−23 km −50 0 50 0 1 2x 10 13 Latitude (°) 23−27 km
Fig. 7. Zonal means of BrO partial columns (SZA lower than 85◦), for three altitude ranges (left plots: 15 to 19 km, centre plots: 19 to
23 km, right plots: 23 to 27 km) calculated from SCIAMACHY limb profiles and BASCOE modelled profiles for the 15th of April, July, October (2003) and January (2004). Black lines: SCIAMACHY limb observations; red lines: BASCOE analysis.
mode, the direct solar or lunar light transmitted through the atmosphere is observed. The measurements are performed in eight spectral channels covering the 240–2400 nm wave-length range with a spectral resolution of 0.2 to 1.5 nm. A detailed description of the instrument and its characteristics can be found in Bovensmann et al. (1999). Among other geo-physical data products, stratospheric BrO profiles can be re-trieved from the SCIAMACHY limb spectral measurements (Rozanov et al., 2005; Sinnhuber et al., 2005; Sheode et al., 2006; Sioris et al., 2006) on the global scale (since EN-VISAT is in polar sun-synchronous orbit). In this study, we use the BrO profiles derived at the Institute of Environmental Physics (IUP) at the University of Bremen (scientific prod-uct: version 3.2). A detailed description of the retrieval al-gorithm as well as the results of the error analysis and sensi-tivity studies can be found in (Rozanov et al., 2005) where, however, a precursor version of the retrieval processor (ver-sion 1.x) is discussed. The most recent retrieval ver(ver-sion 3.2, used in this study, employs the same inversion algorithm as earlier versions (e.g., version 1.x described in the above cited paper) differing, however, quite strongly in the retrieval parameter settings. For example, a slightly different spec-tral range (338.0–356.2 nm) and a higher reference tangent height (about 35 km) were used, Levenberg-Marquardt itera-tive scheme was replaced by more common Newton-type it-erations, and the regularization parameters were optimized. Furthermore, additional information on pressure and
tem-perature provided by the ECMWF were used. A more ex-tensive description of the retrieval processor of version 3.2 is presented in (Hendrick et al., 2008b), where also the ac-curacy of the retrieved BrO profiles has been assessed. A detailed list of the retrieval parameter settings for the cur-rent and previous versions of the retrieval software can be found at the data archive web page of the IUP-Bremen (http:
//www.iup.physik.uni-bremen.de/scia-arc). SCIAMACHY
limb BrO profiles are retrieved with the highest sensitivity in the 15–27 km altitude region and the vertical resolution is between 3 and 5 km (Rozanov et al., 2005; Hendrick et al., 2008b).
For our comparison exercise, we have selected 11 com-plete days of data (the 15th of each month from April 2003 to February 2004). For each day, modelled and measured BrO partial columns have been calculated and compared for three altitude regions (15 to 19 km, 19 to 23 km and 23 to 27 km). Figure 7 shows the comparison results (zonal means, for SZA smaller than 85◦), for the 15th of April, July, October of 2003 and January 2004. The error bars represent the standard de-viation of the SCIAMACHY partial columns within each lat-itudinal bin plus an estimated systematic error of 10% (added in quadrature). The minimum error is determined by the de-tection limit of the SCIAMACHY limb measurements which is estimated to be about 1012molec/cm2. Considering the un-certainties on satellite measurements, the agreement obtained is satisfying at all latitudes, for all altitude layers.
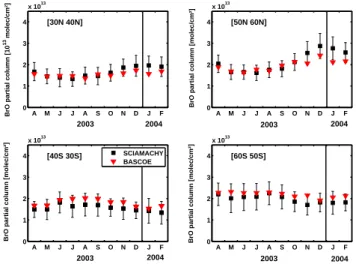
0 1 2 3 4 x 10¹³ A M J J A S O N D J F
BrO partial column [10
13 molec/cm²] [30N 40N] 0 1 2 3 4 x 10¹³ A M J J A S O N D J F
BrO partial column [molec/cm²]
[50N 60N] 0 1 2 3 4 x 10¹³ SCIAMACHY BASCOE A M J J A S O N D J F
BrO partial column [molec/cm²]
[40S 30S] 0 1 2 3 4 x 10¹³ A M J J A S O N D J F
BrO partial column [molec/cm²]
[60S 50S] 2003 2003 2003 2003 2004 2004 2004 2004
Fig. 8. Comparison of the 15–27 km BrO partial columns (zonal means) calculated from the SCIAMACHY limb and BASCOE pro-files for 11 days of data sampling the period from April 2003 to February 2004 and for different latitude bands. Black squares: SCIAMACHY limb observations; red triangles: BASCOE analy-sis.
Comparison results for the 15–27 km BrO partial columns for different latitude bands (60◦S–50◦S, 40◦S–30◦S, 30◦N–40◦N and 50◦N–60◦N) are depicted in Fig. 8, for the 11 days of data (designated by their respective months on the x-axis). It shows that the agreement between BAS-COE and SCIAMACHY partial columns is reasonably good; BASCOE data are most of the time within the error bars asso-ciated to the SCIAMACHY partial columns. The seasonality of BrO is also consistently captured at all latitudes by both SCIAMACHY and BASCOE data.
3.2.4 Discussion
As shown in previous sections, the model calculation re-produces the observed BrO generally very well, taking into account the overall errors of the measurements (about 20– 25%), for the three different types of observations (ground-based, balloon, space-borne limb measurements) used in this study. The seasonal and latitudinal variations are well cap-tured by the model.
Model and measured data agree well assuming a total in-organic bromine loading of 23 pptv. The uncertainty on the contribution of VSLS to stratospheric Bry has recently re-ceived a lot of attention, and is a topic stressed in the WMO report (2007). Furthermore, the quantification of the inor-ganic bromine amount at the lower stratospheric entry lev-els is difficult, because it is controlled by processes with rather large uncertainties (surface emissions, transport and chemical lifetime of brominated short-lived species). A sim-ple way to imsim-plement the bromine short-lived species in the
model has been considered by assuming that the total Bry
is coming from a single effective source of CH3Br (with a
Jan050 Apr05 Jul05 Oct05 Jan06
0.5 1 1.5 2 2.5 3
HARESTUA / 80° SZA Sunset
BrO partial columns [10
13
molec/cm
2]
Jan050 Apr05 Jul05 Oct05 Jan06
0.5 1 1.5 2 2.5 3
Observatoire de Haute−Provence / 80° SZA Sunset
GB UV−vis BASCOE
BASCOE (scaled CH3Br)
Fig. 9. Comparison between modelled and ground-based strato-spheric BrO partial columns (12–20 km altitude range), at Harestua (top) and Observatoire de Haute-Provence (bottom) for the pe-riod from January 2005 to March 2006. BASCOE assumes [Bry]=23 pptv for two different scenarios: (red) stratospheric in-organic bromine has contributions from CH3Br, halons, VSLS and product gases as described in Sect. 2.1., (green) stratospheric Bryis supplied only by the decomposition of methyl bromide (scaled). Black squares: ground-based observations.
mixing ratio of 23 pptv at the surface). The stratospheric BrO results, from this test scenario, are displayed with green lines in Fig. 9, presenting the lower stratospheric BrO par-tial columns (12-20 km altitude range) at Harestua and OHP together with the measured data, for the period from Jan-uary 2005 to March 2006. It can be seen that, in general, the stratospheric BrO modelled in this way is substantially smaller than the measured stratospheric BrO. Taking into account that the short-lived source gases are decomposed faster than methyl bromide, the set-up of short-lived species in the model as proposed in Sect. 2.1 leads to a better con-sistency between simulated and measured stratospheric BrO. This confirms, on a larger dataset, the findings of other stud-ies (Feng et al., 2007; Dorf et al., 2006b, 2008), who found that the agreement between model and balloon data is sig-nificantly improved when having explicitly the short-lived source gases.
Sensitivity tests have been carried out in order to estimate the impact on the model results of the uncertainties on the main reaction rate constants (given in the JPL 2006 compila-tion), following the work presented in Sinnhuber et al. (2002) and Hendrick et al. (2008a). This gives a total error on the daytime BrO concentration smaller than 15%. Further pho-tochemical uncertainties are kept small by considering in our comparisons, only data for SZA lower than 85◦.
Moreover, stratospheric BrO is strongly dependent on
NO2 and the reasonable agreement between modelled
and measured NO2 columns at the NDACC stations (see
Sect. 3.1), reinforce our confidence in the BrO simulations and in the fact that discrepancies due to non-appropriate
simulation of NO2 are rather small. Additional compar-isons of BASCOE and SCIAMACHY limb profiles were
per-formed for O3 and NO2(details on SCIAMACHY limb
re-trieval can be found in Bracher et al., 2007 and Butz et al., 2006). A satisfactory agreement has been found for both species, in accordance with the conclusions of Sect. 3.1. These results further consolidate our modelled BrO results.
4 Stratospheric BrO climatology
4.1 General approach
The primary motivation behind the development of a new BrO climatology, is the retrieval of tropospheric BrO columns from satellite nadir observations, using a residual approach. To achieve this goal, the stratospheric BrO clima-tology has to meet specific requirements:
– Global coverage.
– The diurnal variation of BrO has to be taken into
ac-count, since the instruments are sounding the atmo-sphere under a large range of possible solar zenith an-gles. However, we restrict ourselves to SZA lower than 80◦, because the retrieval of tropospheric BrO columns from space nadir observations at high solar zenith an-gles, is largely complicated due to two main reasons: (1) the measured signal is dominated by the absorption in the stratosphere, due to the very large photon paths in the stratosphere and the reduced sensitivity to the tro-posphere, and (2) stratospheric BrO has a sharp tochemical variation at twilight, that can lead to tochemical gradients along the slant stratospheric pho-ton path, and even horizontal inhomogeneity of the BrO field within the measured pixel.
– Stratospheric BrO is highly variable in time and space,
and depends on several parameters and atmospheric conditions. The BrO climatology must be able to re-produce with enough precision the BrO profiles for the large variety of possible scenarios. Misrepresentation of important patterns of stratospheric BrO (e.g. due to the effect of atmospheric dynamics) will lead to artefacts in the retrieved troposheric BrO columns.
– The stratospheric BrO climatology must provide an
ef-fective profile representative of the sounded atmosphere (averaged profile over the measured pixel).
The stratospheric BrO climatology proposed here is based on a parameterization which reflects the main dynamical and photochemical processes controlling the distribution of BrO in the stratosphere.
The stratospheric bromine monoxide profile can be writ-ten:
BrO=Bry×
BrO Bry
(1)
Where Bryis the inorganic bromine profile accounting for all inorganic bromine species (active bromine and bromine reservoirs). Since inorganic bromine can be considered as a good chemical tracer due to its long chemical lifetime, Eq. (1) effectively separates the effects on the BrO vertical distribution due to the dynamics of the atmosphere and the photochemistry. For a given stratospheric air parcel (with a constant Bryvolume mixing ratio), rapid photochemical re-actions between the various inorganic bromine species are taking place and affect the partitioning of BrO into the inor-ganic bromine species family (BrO/Bry). In this study, these two different aspects are treated separately by developing two distinct climatologies. The development of a Bryprofile climatology is the focus of Sect. 4.2, while a partitioning pro-file climatology (BrO/Bry) is presented in Sect. 4.3. The key requirements to derive a suitable stratospheric BrO profile from Eq. (1) is to obtain sufficient information about the dy-namical and photochemical state of the sounded atmosphere.
4.2 Dynamics of the stratosphere
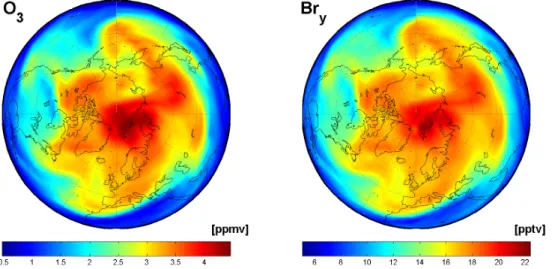
Since most of the inorganic bromine molecules are located below 35 km, we mainly focus on the lower and middle stratosphere. Hereafter, we will refer to the lower, middle and upper stratosphere to designate the stratospheric layers from the tropopause to 25 km, from 25 km to 35 km and above 35 km, respectively. As already mentioned, the distri-bution of inorganic bromine in the stratosphere results from the influence of dynamical processes. For typical time scales of the order of months, the transport of air masses in the stratosphere is governed by the mean meridional circula-tion, which brings inorganic bromine produced in the trop-ical lower and middle stratosphere to extra-troptrop-ical latitudes. In principle, a monthly zonally-averaged Bryprofile clima-tology is able to reproduce in a satisfactory way the rel-evant spatial and temporal variations of stratospheric inor-ganic bromine due to the meridional circulation (e.g. ascend-ing and descendascend-ing advection in the tropical and polar re-gions respectively, Holton 1995). However it fails to repre-sent the Bryvariability due to shorter dynamical processes. A more sophisticated climatology is thus needed to repro-duce the effects on Brydue to short-term transport. At the scale of several days, the motion of stratospheric air parcels is driven by zonal winds. As a first approximation, it can be assumed that the air masses are transported adiabatically (motion along quasi-horizontal isentropic surfaces). Zonal winds tend to eliminate the longitudinal gradients of trac-ers of the stratospheric dynamics (as Bry). The effect on the distribution of Bry varies as a function of altitude, latitude and season. Such short-term dynamical effects are well ac-counted for by the BASCOE 3-D CTM since it uses 6 hourly ECMWF operational analysis of winds and temperatures. This is demonstrated by the fact that short-term changes in measured O3columns are consistently captured by the model (see Fig. 1 in Sect. 2.1). The important concept introduced in
Fig. 10. Example of BASCOE O3and Bryvolume mixing ratios in the northern hemisphere at a potential temperature of 475◦K (∼60 mb), for the 1st March 2004 at 00:00 UT. Blue denotes relatively low volume mixing ratios; red denotes relatively high mixing ratios.
this work to reproduce the effect on stratospheric Bry due to short-term transport, is to use stratospheric ozone as a proxy for the dynamical state of the stratosphere. For non-chlorine activated conditions, ozone in the lower and middle stratosphere can be considered as a tracer of the dynamics of the stratosphere (chemical lifetime about one to several months). Since stratospheric inorganic bromine and ozone are both produced mainly in the tropical lower stratosphere and are sensitive to the stratospheric dynamics in a similar way, a correlation between Bryand O3is expected. This is illustrated in Fig. 10, where the O3and Bryvolume mixing ratios, as simulated by the BASCOE model, are plotted for a low stratospheric isentropic level for the 1st March 2004 in the northern hemisphere. The large dynamical patterns, char-acteristic of this season, are obviously reproduced by both
ozone and BryVMRs. Based on this noticeable property, we
propose a stratospheric Bry concentration profile climatol-ogy based on a simple parameterization using several inputs: month, latitude and stratospheric ozone column. The depen-dency of the Bryclimatology with the month of the year and the latitude allows to reproduce the effect on Brydue to the seasonal and latitudinal variations of the meridional circula-tion, and implicitly for the changes in the zonal winds.
The inorganic bromine profile climatology has been gen-erated by considering the set of Bry profiles, simulated by BASCOE for the period from April 2003 to March 2006. The Bryprofiles have been interpolated on a regular altitude grid (step: 1 km) covering the stratosphere and classified by month, latitude (18 bands defined by the following bound-aries: −90◦, −80◦, . . . , 80◦, 90◦) and O3column (19 blocks of 25 Dobson unit (DU) width centred around 125, 150, . . . , 550, 575 DU). The inorganic bromine profile climatology is build by calculating the average of the Bry profiles
corre-sponding to each month, latitude band, and O3column bin.
Different weights (proportional to the cell areas) have been
assigned to the Bryprofiles to account for the fact that the model cells vary in size with latitude and thus must have dif-ferent contributions to the mean (this effect is particularly important close to the poles).
In order to gain better insight into the consistency of the proposed Bryparameterization, Figure 11 illustrates the cor-relation between stratospheric O3and Bryvertical columns, as simulated by BASCOE, for two particular cases: (1) northern mid-latitudes (40◦N–50◦N) in March, (2) south-ern high-latitudes (70◦S–60◦S) in September. For northern mid-latitudes, the correlation between O3 and Bry vertical columns is excellent. The correlation coefficient is equal to 0.98. For southern high-latitudes in spring, the correla-tion deteriorates since stratospheric ozone can no longer be considered as a dynamical tracer (due to its destruction by chlorine species, activated through heterogeneous reactions on the surface of PSCs), and because of the presence of the strong polar dynamical vortex. However, it can be seen that
there is only a moderate dispersion of Brycolumns around
the mean, for a given O3column interval. The relevance of the proposed Bry climatology will be assessed and consoli-dated in Sect. 4.5, through a comprehensive error analysis.
As already mentioned in Sect. 4.1, the bromine monox-ide profile climatology is intended to be used for the retrieval of tropospheric BrO columns from satellite nadir observa-tions. In a first step of the calculation of BrO profiles (see Eq. 1), stratospheric Bry concentration profiles can be de-rived by using the Bryprofile parameterization established
here, together with the O3 columns retrieved from the
ob-servations. This has several advantages (1) it is simple and requires only limited computation resources, (2) the ozone column is a standard product which is retrieved operationally with an excellent accuracy (error lower than 1 or 2%), and (3) it guarantees to represent the same air masses and geophys-ical conditions as the BrO retrieval. However, the retrieved
1001 200 300 400 500 2 3 4 5 6 7 8 9 Stratospheric O 3 columns [DU] Stratospheric Br y columns [10 13 molec/cm²] March − [40N 50N] 100 200 300 400 500 1 2 3 4 5 6 7 8 9
Stratospheric O3 columns [DU]
Stratospheric Br y columns [10 13 molec/cm²] September − [70S 60S]
Fig. 11. Correlation between stratospheric Bry and O3 vertical
columns from BASCOE, for (left) March [40◦N–50◦N] and (right) September [70◦S–60◦S].
total O3 column contains a small contribution from
tropo-spheric ozone. This can not be accounted for in the Bry cli-matology, since BASCOE does not include any tropospheric processes and is not expected to produce realistic results be-low the tropopause. In practice, this can be (at least partly) corrected for by subtracting, from the retrieved total O3 col-umn, a tropospheric contribution estimated from a tropo-spheric ozone climatology (e.g. Logan, 1999).
4.3 Bromine monoxide photochemistry
As mentioned earlier, the bromine monoxide profile is ob-tained by Eq. (1) through a partitioning factor (BrO/Bry)
calculated as a function of the altitude, and applied to the
inorganic bromine profile. In order to evaluate the ratio
(BrO/Bry), it is necessary to identify the dominant photo-chemical regimes affecting the bromine partitioning during daytime in the lower and middle stratosphere. A detailed description of the gas-phase and heterogeneous stratospheric bromine chemistry can be found in Lary (1996) and Lary et al. (1996); see also a list of the most relevant reactions in Table 1.
For unperturbed atmospheric conditions, bromine monox-ide is in photochemical equilibrium with the bromine
reser-voirs (mostly BrONO2and HOBr) formed by the reactions:
BrO + NO2+M → BrONO2+M (R1)
BrO + HO2→HOBr + O2 (R2)
The loss processes of BrONO2and HOBr are dominated
by the photolysis and the reaction with O. Note that bromine
nitrate can be converted by heterogeneous reactions on sul-phate aerosols into HOBr:
BrONO2+H2O
Het
−→HOBr + HNO3 (R3)
This reaction is expected to play an important role on the partitioning factor before sunrise, but a smaller one on day-time bromine photochemistry (for SZA lower than 80◦), be-cause of the efficient photolysis of HOBr.
Hence during daytime, bromine nitrate is the major bromine reservoir. As a first approximation, the bromine par-titioning factor can be expressed as follows:
BrO Bry ≈ BrO BrO + BrONO2 = 1 1 + KBrONO2L NO2 BrONO2 (2)
Where KBrONO2 and LBrONO2 are the formation and loss
rates of BrONO2, respectively; NO2 is the nitrogen diox-ide concentration. This relation expresses the balance be-tween the production and the loss of BrONO2, which affects directly the bromine partitioning factor (BrO/Bry). It has to be emphasized that (1) the reaction rate of formation of
BrONO2 varies with altitude through a temperature
depen-dence, and (2) the loss rate of BrONO2(mostly photolysis) varies strongly with altitude and solar zenith angle. A sensi-tivity test shows that it depends only slightly on the O3 col-umn. Consequently, the partitioning ratio BrO/Bryresponds very rapidly to any change in SZA and/or NO2concentration. We propose a partitioning factor BrO/Bry profile clima-tology based on a classification according to: month, lati-tude, stratospheric NO2column and solar zenith angle. For
this reason, we have calculated the modelled BrO/Bry
pro-files for the complete period (04/2003 to 03/2006), on the altitude grid already used for the Bryclimatology. We have selected the BASCOE data corresponding to morning condi-tions, since the present climatology is designed to be applied for satellite instruments having morning overpasses (GOME, SCIAMACHY, GOME-2). The partitioning factor profile cli-matology is built by averaging the BrO/Bryprofiles on grids of SZA (5◦bins, SZA lower than 80◦) and stratospheric NO
2
columns (25 blocks of 0.25×10¹⁵molec/cm2 width centred
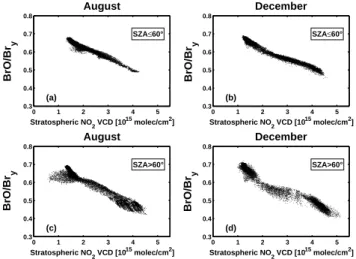
around 0.125, 0.375, . . . , 5.875, 6.125×10¹⁵molec/cm2). In order to illustrate the concept of the partitioning (BrO/Bry) climatology, Fig. 12 displays the ratio between the stratospheric BrO and Brycolumns as a function of the
stratospheric NO2columns, simulated by BASCOE for
Au-gust and December and for two solar zenith angles ranges (SZA≤60◦and 60◦<SZA≤80◦).
The inverse dependency of BrO/Brywith NO2is obvious, as well as the diurnal variation of BrO. However a striking feature can be observed in Fig. 12c, where two photochemi-cal regimes are present in August for low stratospheric NO2 columns. The lower branch of the scatter plot corresponds to perturbed atmospheric conditions in the Antarctic polar
0 1 2 3 4 5 0.3 0.4 0.5 0.6 0.7 0.8 Stratospheric NO2 VCD [10 15 molec/cm2] BrO/Br y August SZA≤60° (a) 0 1 2 3 4 5 0.3 0.4 0.5 0.6 0.7 0.8 Stratospheric NO2 VCD [10 15 molec/cm2] BrO/Br y December SZA≤60° (b) 0 1 2 3 4 5 0.3 0.4 0.5 0.6 0.7 0.8 Stratospheric NO2 VCD [1015 molec/cm2] BrO/Br y August SZA>60° (c) 0 1 2 3 4 5 0.3 0.4 0.5 0.6 0.7 0.8 Stratospheric NO2 VCD [1015 molec/cm2] BrO/Br y December SZA>60° (d)
Fig. 12. Ratio between the stratospheric BrO and Brycolumns, as
a function of the stratospheric NO2columns (morning conditions; upper plots: SZA≤60◦, lower plots: 60◦<SZA≤80◦), estimated from BASCOE data for August (left plots) and December (right plots).
vortex (close to the terminator). Indeed, the polar strato-spheric clouds (formed during the winter polar night) provide the surface for a number of heterogeneous reactions lead-ing to the denoxification process and the activation of chlo-rine species (see e.g. Solomon, 1999). As a consequence, the lower stratospheric inorganic bromine is almost exclu-sively partitioned between BrO and BrCl (formed by the re-action between bromine and chlorine monoxides), and the bromine photochemistry deviates from the standard regime (essentially controlled by stratospheric NO2).
It should be noticed that if we restrict ourselves to unper-turbed conditions, a parameterization of BrO/Brywith addi-tional entries as the latitude and month is relatively redun-dant. In first approximation, the stratospheric NO2column is mainly determined by day length (photolysis of the ni-trogen reservoirs) and the solar zenith angle (affecting the diurnal equilibrium NO2/NO). Nevertheless, a general parti-tioning factor climatology using a classification by latitude and month, is able to reproduce (to some extend) the
differ-ent photochemical regimes, associated to low NO2columns,
experienced by the stratospheric inorganic bromine species. From Fig. 12, it can be seen that there is a moderate disper-sion of the data around the mean curves. It suggests that the error made by using the adopted parameterization of BrO/Bry is rather small. This will be established in Sect. 4.5 through an error assessment.
The advantage of using the stratospheric NO2 column to
parameterize the BrO/Bryratio is that, besides the simplicity of the method, this information is easily accessible as an in-termediate product in the retrieval of total and tropospheric
NO2columns from space nadir measurements (e.g. Boersma
et al., 2004).
4.4 Long-term trend in stratospheric bromine
Due to the evolution of the organic bromine emissions (Montzka et al., 2003), a positive trend in stratospheric bromine of about +2.5% per year has been observed for the 1995-2001 period, while a negative trend of about −1% per year has been identified between 2001 and 2005 (Hendrick et al., 2008a). Since model fields used in this study cover three years of data from 04/2003 to 03/2006, the stratospheric BrO climatology is generalized to account for long-term trend, by adding the year as a new entry of the climatology, in the form of a correction factor.
4.5 Results and error analysis
In this section, the stratospheric BrO vertical columns esti-mated from the Bryand BrO/Bryclimatologies are presented. The suitability of the approach described in the previous sec-tions is addressed through an error analysis. To simplify the discussion, we restrict ourselves to the vertical columns at the time of GOME overpass (similar results are obtained for in-struments with late morning or early afternoon overpasses, as SCIAMACHY, GOME-2 and OMI). The instrument, aboard the ESA/ERS-2 satellite, flies in a sun-synchronous orbit, im-plying that fixed latitudes are always sounded at the same local time. For the period from April 2003 to March 2006, the BASCOE model data at GOME overpass has been se-lected and the stratospheric BrO, Bry, O3 and NO2 verti-cal columns have been verti-calculated (tropopause heights esti-mated from ECMWF pressure and temperature profiles, are used). The climatological stratospheric profiles of Bry con-centration and partitioning ratio (BrO/Bry) were then eval-uated by applying the parameterization, respectively to the
calculated O3 and NO2 vertical columns. The
climatolog-ical stratospheric BrO profiles and columns are calculated by Eq. (1). For each month and latitude band, the mean of the BrO columns from the climatology is estimated, to-gether with the root mean square of the difference between the parameterized and the BASCOE modelled stratospheric BrO columns. Results are presented in Fig. 13. The same approach has been adopted for the Brycolumns. In order to assess the importance of the errors originating from the pa-rameterization of Bryand BrO/Bry, both contributions have been considered separately using the following equation (Bry and BrO/Bryare independent variables):
σBrO2 =(BrO/Bry)2σBr2
y+(Bry)
2σ2
BrO/Bry (3)
Figure 13 shows the relative error on the stratospheric BrO columns due to Bryand BrO/Bry, respectively. The strato-spheric Bryvertical columns derived from the climatological profiles and the ratio between the BrO and Brystratospheric columns, are also presented.
From Fig. 13, it can be stated that the new stratospheric BrO climatology provides reliable results with a precision better than 14%. It also reveals that:
Fig. 13. Results of the BASCOE climatology at GOME overpass. (Upper plots) Monthly zonal averaged of BrO (left) and Bry(center) stratospheric vertical columns (expressed in ×1013molec/cm2) and the ratio between BrO and Brycolumns (right). (Lower plots) Standard deviation (expressed in %) on BrO columns climatological values and the respective contributions from the Bryand BrO/Bry parameteriza-tion. The bromine photochemistry for solar zenith angles larger than 80◦is not considered here (white regions).
– the Bry climatology produces higher Bry columns at mid- and high-latitudes than for tropical regions, as ex-pected from the dependency of the tropopause height
with latitude. One can notice smaller values in the
Antarctic polar spring, which are mainly related to the air subsidence in the polar vortex.
– except for perturbed chemistry conditions, the errors on
the stratospheric BrO columns are dominated by the
er-rors on Bry. These errors are maximum at mid- and
high-latitudes in winter and early spring during major changes in stratospheric dynamics, leading to a larger scatter in the Bry/ozone correlations. The moderate er-rors on Bryduring Antarctic ozone hole conditions in-dicate that Bryshows small variations within the vortex since the air over the polar region is well isolated. The use of the O3column helps to identify the vortex and discern air masses with Bryamount substantially differ-ent.
– the BrO/Bry factor exhibits a strong seasonal variation at mid- and high-latitudes, related to the seasonal cycle of stratospheric NO2.
– the relative error on the stratospheric BrO columns due
to errors on the partitioning factor BrO/Bryis remark-ably small for usual photochemical regimes (lower than 8 %). For perturbed chemistry conditions, the stan-dard deviation can reach 12% of the BrO column due
to the presence of various photochemical scenarios and dynamical mixing of air with different amount of NOx. An important aspect to emphasize is, that the BASCOE stratospheric O3and NO2columns used to build the strato-spheric BrO climatology have been validated through com-parisons with measured columns obtained from ground-based observations at mid- and high-latitudes in both hemi-spheres (see Figs. 1 and 2 in Sect. 3.1). The important ob-served changes in stratospheric O3and NO2are consistently reproduced by the model, except for polar ozone in the south-ern hemisphere in ozone-hole conditions, where BASCOE tends to overestimate the stratospheric O3columns. In prac-tice, however, this is expected to have a marginal impact on the evaluation of stratospheric BrO profiles from our clima-tology since Bry show small variations and correlates only slightly with stratospheric ozone for these conditions (see Fig. 11 in Sect. 4.2).
In summary, the error on the stratospheric BrO column evaluated by the BASCOE climatology, is limited by the ac-curacy of the modelled BrO. By considering the contribution of the main sources of errors added in quadrature, the over-all uncertainty on stratospheric BrO can be kept below 30% under most observational conditions.
5 Conclusions
We have presented a new global climatology of stratospheric bromine monoxide, primarily designed for the retrieval of tropospheric BrO columns from satellite nadir instruments (as GOME, SCIAMACHY and GOME-2), but also of in-terest for a wider range of applications. The impact of the stratospheric dynamics on the stratospheric BrO distribution is accounted for by a parameterization based on the ozone column, while the effect of photochemistry on stratospheric
BrO is determined by considering the stratospheric NO2
columns and the solar zenith angle. The adopted parameter-ization is evaluated based on three years of output data from the BASCOE chemical transport model. Model simulations include full gas phase chemistry and relevant heterogeneous reactions, while dynamics is driven by ECMWF wind fields. Regarding the bromine species, the model calculations use up-to-date photochemistry and a realistic total bromine bud-get (including a contribution from short-lived bromine source gases).
Although primarily based on model simulations, the cli-matology is also closely linked to an extensive set of stratospheric BrO observations from ground-based, balloon-borne and satellite (SCIAMACHY) platforms. The excel-lent overall agreement between the model and the observa-tions demonstrates (1) the level of consistency of the cur-rently available BrO observational data set, (2) the ability of our model to reproduce the main mechanisms controlling the distribution of stratospheric bromine monoxide. We estimate that the overall uncertainty of the resulting stratospheric BrO profiles is lower than 30%. However, this error will likely de-crease in the future as consolidated kinetic and photochem-ical data, and improved measurements of inorganic and or-ganic bromine compounds will be available.
The retrieval of tropospheric BrO from satellite obser-vations and the present climatology requires great care to achieve good accuracy, and the derived tropospheric BrO re-sults will have to be confronted to external measured data in order to test and validate the method. We estimate that an error on the retrieved tropospheric BrO columns of about 25% for bromine explosion events and of 50% for free-tropospheric BrO background conditions may be attributed to the stratospheric BrO correction. The precise value mainly depends on the observation geometry, surface reflectivity and the BrO partitioning in both stratosphere and troposphere.
The consequences to infer tropospheric BrO columns from satellite nadir measured total BrO columns and the present BASCOE stratospheric BrO climatology will be further in-vestigated in a future paper.
Acknowledgements. This research has been financially supported by the Belgium Prodex 8 contract NOy-Bry and the Ozone SAF (BrO visiting scientist) project. Q. Errera and S. Chabrillat are sup-ported by the Belgian Federal Science Policy in the framework of the BASCOE Prodex project (PEA 90125). The authors wish to
thank M.P. Chipperfield for providing us with SLIMCAT data, and ECMWF for providing us with meteorological analysis.
The ozone and nitrogen dioxide ground-based data used in this pub-lication was obtained as part of the Network for the Detection of At-mospheric Composition Change (NDACC) and is publicly available (see http://www.ndacc.org).
The SCIAMACHY limb BrO retrieval activity was partially funded by the German Ministry of Education and Research (BMF) through the German Aerospace Center (DLR) within the SADOS project (50EE0727). The IUP Bremen group thanks the European Centre for Medium-Range Weather Forecasts (ECMWF) for providing the pressure and temperature information (ECMWF Special Project SPDECDIO). Some data shown here were calculated on German HLRN (High-Performance Computer Center North) and NIC/JUMP (J¨ulich Multiprocessor System). Services and support are gratefully acknowledged.
Edited by: W. Lahoz
References
Aliwell, S. R., Van Roozendael, M., Johnston, P. V., Richter, A., Wagner, T., et al.: Analysis for BrO in zenith-sky spectra: An intercomparison exercise for analysis improvement, J. Geophys. Res., 107, D140, doi:10.1029/2001JD000329, 2002.
Bingen, C., Fussen, D., and Vanhellemont, F.: A global climatol-ogy of stratospheric aerosol size distribution parameters derived from SAGE II data over the period 1984-2000: 1. Methodology and climatological observations, J. Geophys. Res., 109, D06201, doi:10.1029/2003JD003518, 2004.
Bobrowski, N., H¨oninger, G., Galle, B., and Platt, U.: Detection of bromine monoxide in a volcanic plume, Nature, 423, 273–276, 2003.
Boersma, K. F., Eskes, H. J., and Brinksma, E. J.: Error analysis for tropospheric NO2retrieval from space, J. Geophys. Res., 109, D04311, doi:10.1029/2003JD003962, 2004.
Bovensmann, H., Burrows, J. P., Buchwitz, M., Frerick, J., No¨el, S., Rozanov, V. V., Chance, K.V., Goede, A. P. H., SCIAMACHY: Mission objectives and Measurement Modes, J. Atm. Sci., 56, 127–150, 1999.
Bracher, A., Amekudzi, L., Bramstedt, K., Eichmann, K.-U., Rozanov, A., von Savigny, C., and Burrows, J. P.: Global and Validation of SCIAMACHY O3 and NO2profiles from OL3.0 and IUP/IFE retrieval with collocated measurements from ACE-FTS, GOMOS, HALOE, MIPAS, POAM III and SAGE II, in: Proceedings of the ENVISAT Symposium 2007, 23–27 April 2007, Montreux, Switzerland, ESA Publications Division, Nord-wijk, The Netherlands, SP-636, 463472br.pdf, 2007.
Butler, J. H., King, D. B., Lobert, J. M., Montzka, S. A., Yvon-Lewis, S. A., Hall, B. D., Warwick, N. J., Mondeel, D. J., Aydin, M., and Elkins, J. W.: Oceanic distributions and emissions of short-lived halocarbons, Global Biogeochem. Cy., 21, GB1023, doi:10.1029/2006GB002732, 2007.
Butz, A, B¨osch, H., Camy-Peyret, C., Chipperfield, M., Dorf, M., Dufour, G., Grunow, K., Jeseck, P., K¨uhl, S., Payan, S., Pepin, I., Pukite, J., Rozanov, A., von Savigny, C., Sioris, C., Wagner, T., Weidner, F., and Pfeilsticker, K.: Inter-comparison of strato-spheric O3and NO2abundances retrieved from balloon borne
![Fig. 11. Correlation between stratospheric Br y and O 3 vertical columns from BASCOE, for (left) March [40 ◦ N–50 ◦ N] and (right) September [70 ◦ S–60 ◦ S].](https://thumb-eu.123doks.com/thumbv2/123doknet/14769340.590114/13.892.76.428.92.361/correlation-stratospheric-vertical-columns-bascoe-march-right-september.webp)