HAL Id: hal-00350043
https://hal.archives-ouvertes.fr/hal-00350043
Submitted on 30 Apr 2021HAL is a multi-disciplinary open access
archive for the deposit and dissemination of sci-entific research documents, whether they are pub-lished or not. The documents may come from teaching and research institutions in France or abroad, or from public or private research centers.
L’archive ouverte pluridisciplinaire HAL, est destinée au dépôt et à la diffusion de documents scientifiques de niveau recherche, publiés ou non, émanant des établissements d’enseignement et de recherche français ou étrangers, des laboratoires publics ou privés.
Single-mode LiNbO3-based waveguides for L-band
interferometry
G. Martin, E. Anselm, T. Seure, T. Moulin, A. Delboulbé, L. Jocou, N.
Bodin-Courjal, O. Caballero, J. Olivares
To cite this version:
G. Martin, E. Anselm, T. Seure, T. Moulin, A. Delboulbé, et al.. Single-mode LiNbO3-based waveg-uides for L-band interferometry. SPIE Astronomical Telescopes + Instrumentation, Jun 2008, Mar-seille, France. �10.1117/12.788357�. �hal-00350043�
Single-mode LiNbO
3-based waveguides for L-band interferometry
Guillermo Martin
*a, Eric Anselm
a, Thibaut Seure
a, Thibaut Moulin
a, Alain Delboulbé
a, Laurent
Jocou
a, Nadège Bodin Courjal
b, Olga Caballero
c, José Olivares
ca
Laboratoire d’Astrophysique de Grenoble, 414 Rue de la Piscine, BP 53, 38400 Saint Martin
d’Hères, France ;
b
FEMTO-ST, Université de Franche-Comté. 16, route de Gray. 25030 Besançon. France ;
c
Dept. de Física de Materiales. c/ Francisco Tomas y Valiente, 7. 28049 Cantoblanco. España
ABSTRACT
We present three different techniques for single-mode waveguide realization in Lithium Niobate at the 3.39µm atmospheric transmission band, named L-band. These methods include Titanium diffusion, Ion Beam Implantation and Photo-inscription. After describing the fabrication process and waveguide characterization, we will present an integrated interferometer based on the Young’s double slit experiment. From the recorded interferogram we recover information about the source, namely, its peak emission lines.
Keywords: Infrared single mode waveguides, Lithium Niobate, Integrated interferometry, L-band
1. INTRODUCTION
Infrared observations give access to cool matter studies, where optical (visible) observation is blocked by the absorption of interstellar dust. In particular, the L-band atmospheric transmission window (3.4-4.1 µm) presents promising features for astrophysical studies. Cool matter, from dust grains to giant planets, has a temperature range from 3-1500K that makes its blackbody emission fall into the mid-infrared range. As an example, at 800K (temperature of crystallization of some silicates) the thermal emission peaks at 3.6microns, which is at the center of the L-band. Moreover, this band is most appropriate for ground-based detection of hot dust in the habitability regions of stars of the main sequence. [1,2]. Thus, infrared observations are fundamental to study low-temperature regions, such as dusty interstellar clouds or the silicate composition of the dust. Programs like Spitzer are devoted to observation on the 3-180 microns range. Part of the work is devoted to study the mid-IR spectral features of silicates, which in the case of hydrated silicates fall into the L-band (emission lines between 3.1 and 4 microns) [3]. Also, infrared emission of polycyclic aromatic hydrocarbons from circumstellar disks present 3.3µm signatures [4].
Concerning exoplanet detection, the 2.5-5 µm window has been identified as an adequate band for planet search science [5]. As an example, the spectrum of a hot Jupiter is centered at 3.8 microns, presenting a strong emission while no atmospheric absorption lines degrade the spectrum [6].
These astrophysical science cases show the interest on the development of instruments devoted to the L-band. Currently, some bulk optics projects are emerging in the L-band (ALADDIN project), but nothing in single mode integrated optics. Indeed, silica and classical glasses cannot reach this band, which explains the lack of instruments in this wavelength range. Thus, an instrument developed for this band will be most welcome, but this requires an initial effort in technological developments as we propose in this paper.
In order to address the L-band we have selected Lithium Niobate (LiNbO3). Due to its well-known properties in the near-infrared range (commercial electro-optical modulators at 1550 nm) and large transmission window (450nm-5200nm), LiNbO3 is an ideal substrate for the realization of infrared beam combiners dedicated to interferometric instruments as the second generation VLTI instruments VSI (VLTi Spectro Imager, where multi-telescope recombination is considered
*
using a single device) or Gravity, another VLTi instrument dedicated to galactic centre observation. It provides also an excellent candidate for realizing precursors for nulling interferometers like PEGASE (spacecraft-instrument dedicated to spectrometry of hot jupiters and brown dwarfs between 2.5-5 microns).
LiNbO3 is widely used today as a reference material for applications in integrated optics in the telecom window (1.55µm), since it allows obtaining single-mode waveguides by different procedures (Ti or Zn diffusion, proton exchange, ion implantation) with low optical losses (<0.2dB/cm). Whereas these methods are well known for waveguide realization below 1.55 µm, only few laboratories in the world have explored the capacities of LiNbO3 at higher wavelengths. However, feasibility of single mode waveguides in LiNbO3 by classical proton exchange techniques has been recently demonstrated [7]. In this paper, we present our results for L-band single mode realization by Titanium diffusion and Ion beam implantation, as well as preliminary results on UV photo-inscription. Finally, we will present some preliminary results on an integrated Young interferometer working in the L-band.
2. WAVEGUIDE REALIZATION
In order to achieve single mode waveguides in the L-band, different techniques were developed. Two of them are current methods for waveguide realization, but to the best of our knowledge, none of them was pushed so far as to 3.39microns waveguiding. These techniques are Titanium diffusion and Ion Beam Implantation. A third technique, more prospective, is based on the refractive index modification in LiNbO3 by UV irradiation. Some recent results have shown the possibility of channel waveguide photo-inscription by doubling an Argon laser (488nmÆ244nm), producing waveguides with good confinement at 1550nm [8,9]. We have used the same technique in the aim of developing single mode waveguides at 3.39µm.
In the following sections, we describe the different techniques and the characterization results of the waveguides obtained from each.
2.1 Titanium diffusion
Titanium diffusion is one of the most expanded techniques for waveguide realization in LiNbO3. A thin film (200nm) of Titanium is deposited onto the surface of bulk LiNbO3, the sample is placed into an oven, heated at 1020ºC and Ti ions diffuse inside the crystal. This produces typically smooth refractive index profiles, which can be modeled by an exponential function distribution (see below).
Two single mode LiNbO3 planar waveguides at 3.39 microns were obtained with this technique at the FEMTO-ST
laboratory, at Université de Franche-Comté. The expected diffusion profiles were calculated by the Galerkin method and the experimental profiles were reconstructed from the angular measurement of dark modes using the WKB inverse method. The dark modes (or m-lines) technique [10], adapted for 3.39 microns, was developed at Laboratoire d’Astrophysique de Grenoble (LAOG). As will be discussed in the characterization section, a first measure at 633nm allows visible characterization of guided modes and further index profile reconstruction. Then, we switch to infrared coupling, obtaining the experimental modes at 3.39 microns and comparing with the theoretically expected ones.
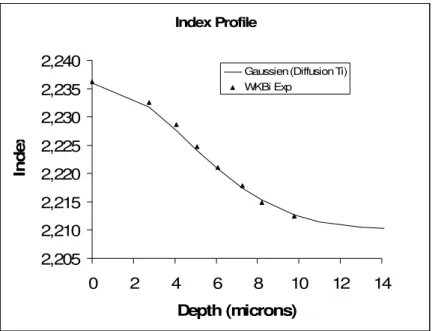
Index Profile 2,205 2,210 2,215 2,220 2,225 2,230 2,235 2,240 0 2 4 6 8 10 12 14 Depth (microns) In d e x
Gaussien (Diffusion Ti) WKBi Exp
Fig. 1. Refractive index profile reconstructed using the WKB inverse method, for the extraordinary refractive index in a planar waveguide obtained by 50h Ti diffusion over X-cut LiNbO3 sample.
In order to obtain the characteristics of the Ti-diffused waveguide, we fitted this profile with the expected ion diffusion theoretical formula: 2
( )
z d sn z
n
n e
⎛ ⎞ −⎜ ⎟⎝ ⎠=
+ ∆ ⋅
(1)Where ns=2.21 is the bulk refractive index and ∆n=0.026 is the birefringence obtained from WKBi method [11]. Fitting the index profile with this formula results in a waveguide depth of d=6.5 microns. Applying the dispersion behaviour of refractive index for LiNbO3, we predicted a single mode at 3.39microns, at an output angle of 20.04º. Measurements in the infrared showed indeed a single dark line at 20.7º, that is, an effective index of 2.133 at 3.39µm. This confirms the single mode behavior of the Ti-diffused waveguides obtained for 50h heating at 1020ºC.
2.2 Ion beam implantation
Ion beam implantation was realized over two different LiNbO3 samples, one X-cut and one Z-cut. These samples were prepared at the Centro de Microanalisis de Materiales, at the Universidad Autonoma de Madrid using the technique of swift heavy ion-beam irradiation [12]. The planar waveguides were obtained by implantation of 4+ Fluoride ions, at a fluence of 4 x10¹⁴ ions/cm2 and an energy of 20 MeV.
The experimental measurements of dark modes at 633nm, showed four modes. Using the WKBi method, we reconstructed the experimental refractive index profile in the visible.
Refractive Index Profile
2,08
2,10
2,12
2,14
2,16
2,18
2,20
2,22
2,24
0
0,5
1
1,5
2
2,5
3
Depth (microns)
In
d
e
x
Fermi (Ion Beam) WKBi Exp
Fig. 2: Extraordinary refractive index profile for the ion-beam irradiated Z-cut sample.
In the case of ion beam implantation, as the profiles are steeper, we used the Fermi theoretical model in order to obtain the waveguide characteristics:
( )
1
( )
1
F s m z zn z
n
n
e
−=
+ ∆ ⋅
+
(2)Where ns is the substrate refractive index, m is the slope of the distribution function, ∆n is the induced birefringence and zF is the Fermi depth. The two adjustable parameters are ∆n and zF, while m is optimized to fit the steepness of the slope to WKBi data. We obtained ns=2.3, ∆n=0.103, m=20 and zF=2.4microns for nord=2.4060 and ns=2.105, ∆n=0.18, m=12 and zF=2.5 for next=2.2918. These profiles predicted a single mode at 3.39µm at 30.4º for next (obtained experimentally at 27.6º) and 46º for nord (obtained experimentally at 48.9º). The experimental results confirmed the single mode behavior of the waveguides obtained by ion beam implantation with fluoride ions. There is however a discrepancy of about 3º between experimental and theoretical data that must be investigated. Most probably, this difference comes from the behavior of dispersion of the refractive index with wavelength that was not investigated for ion-beam irradiated waveguides.
2.3 UV photo-inscription
Inscription of a birefringent area under UV irradiation in LiNbO3 has been already presented by other authors [8,9], but in the aim of developing waveguides for 1.55µm. In this work, we have tried to obtain single mode waveguides at 3.39 microns by the same technique. The basic idea of this technique is to use the 488nm emission line of an Argon Laser (40mW CW Lasos60), double the frequency using a non-linear crystal (8mm long BBO crystal from Castech) and focus on the surface of pure LiNbO3 to obtain ion migration under UV irradiation (the exact mechanisms for photo-induced birefringence are not the scope of this work, and are still not well understood). It’s important to note that this effect seems to be only achievable along the extraordinary axis, and not on the ordinary axis. We thus selected an X-cut pure LiNbO3 substrate and optimized the UV writing parameters: a scanning velocity of 428 mic/s and an incident Argon power of 11mW focalized on the surface with a 4x long working distance microscope objective. The focusing was done before the BBO crystal in order to avoid UV attenuation by the objective lenses.
M2 M1 O1 Laser ARGON Diaphragm1 D2 BBO Crystal Linear Translation + Sample M2 M1 O1 Laser ARGON Laser ARGON Diaphragm1 D2 BBO Crystal Linear Translation + Sample
Fig. 3: UV photo-inscription set-up.
3. EXPERIMENTAL SET-UP FOR CHARACTERIZATION
3.1 Dark modes set-up
The experimental set-up used for planar waveguide characterization (Ti-diffusion and Ion Beam Implantation) is given in figure 4: D1 D2 Polariser Cross L2 L1 Prism M2 M1 O1 PYROCAM III Laser 3.39 µm Laser 633 nm D1 D2 Polariser Cross L2 L1 Prism M2 M1 O1 PYROCAM III PYROCAM III Laser 3.39 µm Laser 3.39 µm Laser 633 nm Laser 633 nm
Fig.4: Dark modes characterization set-up for Visible and Infrared co-alignement.
A He-Ne laser, emitting 2mW at 3.39microns is focused onto the surface of the substrate by a ZnSe lens (f=75mm). We used a TiO2 prism in contact with LiNbO3 waveguides. The output angles corresponding to dark modes are viewed with an infrared camera (Spiricon III). In parallel, a He-Ne 633nm source is co-aligned with the IR laser, using diaphragms D1 and D2, and allowing m-lines measurements in the visible. With these results, we are able to obtain the index profiles for the planar waveguides, for both polarizations, and measure the number of modes at 3.39microns.
3.2 Imaging photo-induced channel waveguides
After optimization of the UV writing process, an imaging set-up was designed in order to visualize the output of the channel waveguides and extract information about modal behavior. The optical bench is presented in the following figure: Screen 633 nm Fibered Laser Screen 633 nm Fibered Laser 633 nm Fibered Laser
Fig.5 : Optical bench for photo-induced waveguides imaging
A red He-Ne laser is injected by end fire coupling at the interface air-substrate, and scanned along the side of the sample. A gross approach to the irradiated area is done visually, since the diffused photons from end-fire coupling present a darkening near this zone. Then, a fine search of the channel waveguide is done around this area. Eventually, if the irradiation time and the absorbed energy are sufficient to achieve birefringence up to a guiding level, a channel waveguide spot appears when light is efficiently coupled. The experimental observation of such a photo-induced channel waveguide is shown hereunder, in the visible range.
0 500 1000 1500 2000 2500 3000 3500 4000 -200 -100 0 100 200 300 400 500 600 700 Mode FWHM = 3.96µm In tens it y (a .u.)
Pixel Size at Pyrocam (mic) Intensity (a.u.) Gauss fit of Data1_B
Fig.6: Left: Screen Capture of the Spiricon Camera image of the output of a photo-induced channel waveguide. Right: Transverse plot of intensity and fit to a Gaussian distribution.
By fitting the obtained image of the out-coupling to a Gaussian profile, we obtain a FWHM=3.96microns of the fundamental mode at 633nm. These results confirm that photo-inscription can be used as a method to pattern channel waveguides in LiNbO3; unfortunately, the birefringence obtained is not sufficient to allow waveguiding at 3.39microns. Indeed, waveguide excitation was done by varying the injection position of the microscope objectives, and no variation of the Gaussian profile at the output was obtained, indicating that only the fundamental mode was guided at 633nm. Thus, there are few chances that 3.39microns wavelength should be guided in the photo-inscribed waveguides presented in this paper, and no experimental results were obtained for this wavelength. New series of UV irradiation are under way in order to increase the induced birefringence and obtain channel waveguides in the L-band.
4. INTEGRATED YOUNG’S DOUBLE SLIT INTERFEROMETER
In order to prepare the future integrated optics beam combiners, allowing to achieve complex beam combination schemes [13], a first study was devoted to interference capabilities on single mode LiNbO3 planar waveguides. The interest in single mode waveguides lies in the fact the high frequency optical aberrations of the injected beam excite high order modes of the waveguide. If the waveguide it’s single mode, the optical aberrations are filtered out (as the order above fundamental are radiated) and at the output the distribution intensity of the beam is perfectly Gaussian. Thus, fringe contrast should be improved between multimode and single mode interference patterns obtained in a planar waveguide. In this context, we have developed an integrated optics interferometer based on the Young’s Double Slit experiment.
4.1 Experimental Set-up
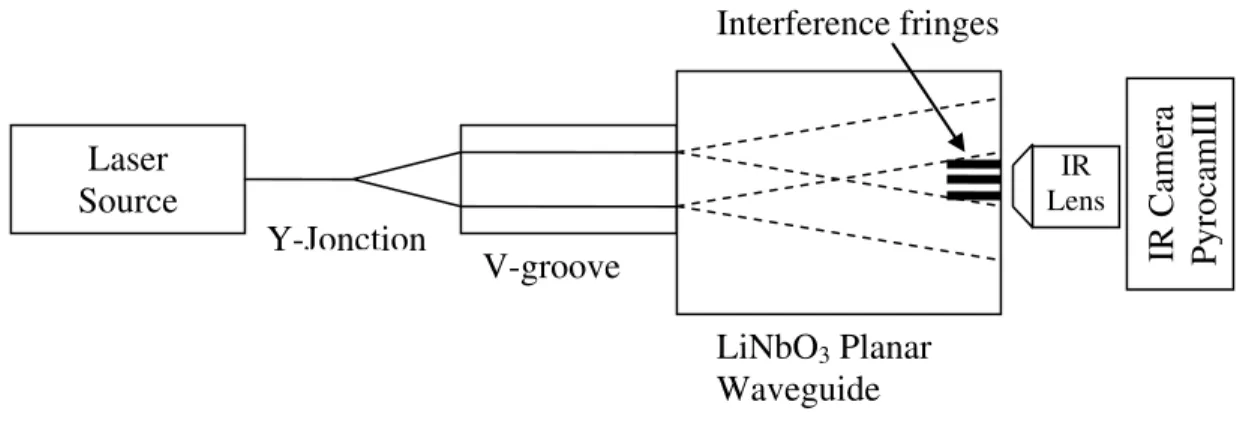
The experimental set-up is shown below. The laser radiation coming from a He-Ne at 3.39 microns is injected directly on two Oxford chalcogenide fibers, transmitting between 1-6 microns. These fibers are set close together by drilling a conic hole in a cylindrical support where the smaller aperture is close to two times the cladding diameter of the fibers (ca. 700microns). At the other end the fibers are set on a V-groove type device, with an inter-core separation of 800microns. Then the LiNbO3 sample, containing the planar waveguide is gently pressed against the fibers out-put. Finally, a ZnSe lens (f=33.5cm) images the waveguide output on a infrared camera developed at LAOG (COMIC [14]).
Laser
Source
Y-Jonction
V-groove
LiNbO
3Planar
Waveguide
Interference fringes
IR LensIR Camera
P
y
rocamIII
Fig. 7: Schematics of the infrared integrated optic basic interferometer
4.2 Theoretical model and expected values
Two chalcogenide fibers collect the photons from the He-Ne 3.39microns source and excite a planar waveguide. At the output, we recover the interference pattern given by:
( )2 4 2 2 0 interferences
2
( )
4
sinc
1
cos
Y temporal coherence diffractionbYn
aYn
I Y
I
e
D
D
λ λπ
π
λ
λ
∆⎡
⎤
⎢
⎥
⎛
⎞
⎛
⎞
=
⎜
⎟
⎢
+
⎜
⎟
⎥
⎝
⎠
⎢
⎝
⎠
⎥
⎣
⎦
123
14
4244
3
14
4244
3
(3)Where b is the fiber core diameter, D is the planar waveguide length, a is the separation between the sources, n is the effective refractive index of the fundamental guided mode and Y is the lateral position along the output side. ∆λ represents the spectral width of the source.
In our system, using Oxford Chalcogenide Fibers (core diameter 250µm, Cladding diameter 350µm), we obtain a physical separation on the dedicated V-groove of 700µm. Using the He-Ne Laser Source at 3.39µm, considering a quasi-monochromatic source (∆λÆ0) and a single mode planar waveguide we obtain a theoretical distribution of fringes at the output given by:
200 150 100 50 0 50 100 150 200 0 2 4 6 8 10 10 0 I1 Y( ,λ1) 2 xdiffmin. 2 xdiffmin. Y
Fig.8: Theoretical distribution of fringes
That is, a diffraction limited pattern, with the fringe period i=λD/a·neff=37.81microns for a D=19.5mm long waveguide
and a first maximum of diffraction of width w=242 microns. Here we used a=0.8mm, neff=2.185 for the LiNbO3
fundamental mode at λ=3.39µm in the ordinary axis.
4.3 Infrared results
The results obtained for 3.39µm excitation are shown in figure 9. The experimental period is i=38.31mic, in good agreement with the theoretical expected values. It’s in important to note that pixel size is 50µm, so that an error of one pixel results in a modification of the measured period of 1µm (when averaging with the four observed fringes).
COMIC Infrared Fringes
0 5000 10000 15000 20000 25000 30000 35000 0 20 40 60 80 100 120 Pixel No In te n s it
Implementing a Fast Fourier Transform over the measured fringes, we obtained a peak positioned at 3.463µm, compared with the theoretical emission line at 3.39µm. Although the obtained spectra is weakly resolved, due to the scarce number of fringes and the poor number of pixels available, we can confirm that our interference pattern allows to measure the emission peak wavelength of the source.
FFT of Fringes
-2 0 2 4 6 8 10 0 10 20 30 40 50 60 Samples FFTFig.10: Showing the peak of intensity on pixel no 19. Scaling this value with the fringe period and pixel size, we obtain the position of the peak emission line.
5. DISCUSSION
Comparing theoretical and expected interference fringes we observe that the diffraction envelope is hardly seen experimentally, despite the good agreement in the period of the fringes. A Fourier analysis of the fringes allows to obtain the emission wavelength of the source and validate the method, despite the low resolution actually achievable. With the development of more sophisticated infrared cameras, increasing the pixel number and/or diminish their size, we should be able to improve the resolution on the spectrum of emission, and thus open the way to integrated spectroscopy in the L band.
6. CONCLUSION
We have presented three techniques with optimal potential for waveguide realization in the infrared range, namely around the L-band, applied to LiNbO3. With Titanium diffusion and Ion-Beam Implantation we were able to obtain single mode planar waveguides. UV photoinscription, despite the ease of use, has not been sufficiently well mastered to allow us to produce channel waveguides in the infrared. It was however proved that single mode waveguides at 633nm were obtained, and new samples are under study aiming the infrared L band. Finally, we have installed at LAOG an optical bench for L-band integrated optics tests, and shown the possibility of interferometry in single mode waveguides. Optimization of this bench will allow increasing the resolution and give us the possibility to start spectroscopical studies around this infrared band.
REFERENCES
[1]
O. Absil, R. den Hartog, P. Gongoin, P. Fabry, R. Wilhelm, P. Gitton and F. Puech, “Performance study of ground-based infrared Bracewell interferometers - Application to the detection of exozodiacal dusts with GENIE” A&A 448, 2, 787-800 (2006).
[2] O. Absil, V. Coudé du Foresto, M. Barillot and M.R. Swain, “Nulling interferometry : performance comparison between antartica and other ground-based sites” A&A 475, 3, 1185-1194 (2007).
[3]
Knacke R. F. and Kraetschmer W. A&A vol.92, no.3 (1980) [4] R. Visser et al. Molecules in Space and Laboratory, Paris 2007 [5] Segransan SPIE 2002.
[6] D. Sudarsky, A. Burrows and I. Hubeny, “Theoretical Spectra and Atmospheres of Extrasolar Giant Planets” Vol. 588 (2), 1121-1148 (2003)
[7] G. Li, T. Eckhause, K.A. Winick, J.D. Monnier and J.-P. Berger, “Integrated optic beam combiner in lithium niobate for stellar interferometer” Porc. Of SPIE, 6268 (2006).
[8] Mailis, G., Risiotis, C., Wellington, I.T., Smith, P.G.R., Gawith, C.B.E. and Eason, R.W.,”Direct ultraviolet writing of channel waveguides in congruent lithium niobate single crystals” Opt. Lett. 28 (16) 1433-1435 (2003).
[9] Gallo, K., Gawith, C.B.E., Wellington, I.T., Mailis, S., Eason, R.W, Smith, P.G.R., Richardson, D.J. and Kostritskii, S.M. “Ultraviolet writing of channel waveguides in proton exchanged LiNbO3” J. Appl. Phys. 101 (2007).
[10] Tien, P.K. “light Waves in thin films and integrated optics” Appl. Opt. 10 (11) 2395 (1971). [11]
White,J.M. and Heidrich, P.F. “Optical waveguide refractive index profiles determined from measurement of mode indices: simple analysis” Appl. Optics 15 (1), 151-155 (1976).
[12] Olivares, J., Garcia, G., Garcia-Navarro, G., Agullo-Lopez, F., Caballero, O. and Garcia-Cabañes, A. “Generation of high-confinement step-like optical waveguides in LiNbO3 by swift heavy ion irradiation” Appl. Phys. Lett. 86 (2005).
[13] “VSI: A milliarcsec spectro-imager for the VLTI”. F. Malbet et al. arXiv astro (2006)
[14] COMIC: Lacombe, F., Marco, O., Geoffray, H., Beuzit, J.L., Monin, J.L., Gigan, P., Talureau, B., Feautrier, P., Petmezakis, P., Bonaccini, D. “Adaptative Optics Imaging at 1-5 microns on Large Telescopes: The COMIC Camera for ADONIS”, PASP, 110, 1087 (1998).