HAL Id: hal-00304622
https://hal.archives-ouvertes.fr/hal-00304622
Submitted on 1 Jan 2001HAL is a multi-disciplinary open access archive for the deposit and dissemination of sci-entific research documents, whether they are pub-lished or not. The documents may come from teaching and research institutions in France or abroad, or from public or private research centers.
L’archive ouverte pluridisciplinaire HAL, est destinée au dépôt et à la diffusion de documents scientifiques de niveau recherche, publiés ou non, émanant des établissements d’enseignement et de recherche français ou étrangers, des laboratoires publics ou privés.
south-west Scotland, UK: 1979-1998
R. C. Ferrier, R. C. Helliwell, B. J. Cosby, A. Jenkins, R. F. Wright
To cite this version:
R. C. Ferrier, R. C. Helliwell, B. J. Cosby, A. Jenkins, R. F. Wright. Recovery from acidification of lochs in Galloway, south-west Scotland, UK: 1979-1998. Hydrology and Earth System Sciences Discussions, European Geosciences Union, 2001, 5 (3), pp.421-432. �hal-00304622�
Recovery from acidification of lochs in Galloway, south-west
Scotland, UK: 1979-1998
R.C. Ferrier
1, R.C. Helliwell
1, B.J. Cosby
2, A. Jenkins
3and R.F. Wright
41 Macaulay Institute, Aberdeen, Scotland, AB15 8QH, UK
2 Department of Environmental Science, University of Virginia, Charlottesville, VA 22901,USA 3 Centre for Ecology and Hydrology, Wallingford, Oxon OX10 8BB, UK
4 Norwegian Institute for Water Research, PO Box 173, Kjelsås, N-0411 Oslo, Norway
Email for corresponding author: r.ferrier@macaulay.ac.uk
Abstract
The Galloway region of south-west Scotland has historically been subject to long-term deposition of acidic precipitation which has resulted in acidification of soils and surface waters and subsequent damage to aquatic ecology. Since the end of the 1970s, however, acidic deposition has decreased substantially. The general pattern is for a rapid decline in non-marine sulphate in rainwater over the period 1978-1988 followed by stable concentrations to the mid-1990s. Concentrations of nitrate and ammonium in deposition have remained constant between 1980 and 1998. Seven water quality surveys of 48 lochs in the Galloway region have been conducted between 1979 and 1998. During the first 10 years, from 1979, there was a major decline in regional sulphate concentrations in the lochs, which was expected to have produced a decline in base cations and an increase in the acid neutralising capacity. But sea-salt levels (as indicated by chloride concentrations) were approximately 25% higher in 1988 than in 1979 and thus short-term acidification due to sea-salts offset much of the long-term recovery trend expected in the lochs. During the next 10 years, however, the chloride concentrations returned to 1979 levels and the lochs showed large increases in acid neutralising capacity despite little change in sulphate concentrations. From the observed decline in sulphatedeposition and concentrations of sulphate in the lochs, it appears that approximately 75% of the possible improvement in acid neutralising capacity has already occurred over the 20-year period (1979-1998). The role of acid deposition as a driving factor for change in water chemistry in the Galloway lochs is confounded by concurrent changes in other driving variables, most notably, factors related to episodic and year-to-year variations in climate. In addition to inputs of sea-salts, climate probably also influences other chemical signals such as peaks in regional nitrate concentrations and the sharp increase in dissolved organic carbon during the 1990s.
Keywords: acidification, recovery, Galloway, sulphur, nitrogen
Introduction
Acidification of surface waters in the UK uplands is linked to the emission and subsequent deposition of oxides of sulphur (S) and nitrogen (N) from the atmosphere (Battarbee
et al., 1990). Reconstruction of historical surface water pH,
through the analysis of diatoms in lake sediment cores, shows that acidification generally occurred in the mid to late nineteenth century (DOE, 1995). The extent of acidification is determined by the sensitivity of the lake relative to the amount of acidity deposited. This sensitivity can also be related to the available pool of base cations in the catchment soils and the weathering rate of the underlying geology. In these respects, the lochs of the Galloway region of south-west Scotland represent some of the most severely acidified waters in the UK with a combination of slow
weathering granite bedrock, thin organic soils and a high deposition flux of S and N.
The first synoptic regional survey of water chemistry in the UK was carried out in Galloway in 1979 (Wright and Henriksen, 1980). The results from this survey indicate that lochs situated on the granite intrusion are extremely acidic relative to those on the surrounding sedimentary bedrock receiving similar deposition loads. A repeat survey of the same lochs in 1988 showed a 42% decrease in sulphate (SO4) concentrations across the region resulting in a substantial increase in acid neutralising capacity (ANC) and pH in the most acidic lochs (Wright et al., 1994). This was consistent with a decrease in S deposition over the same period. A further five water chemistry surveys were undertaken in the period 1988-1998 and analysis of the chemical changes from
these more recent surveys are assessed in relation to the earlier observations. This represents a unique summary of the water chemistry of the Galloway lochs from 1979-1998. The aims of this paper, therefore, are to determine the magnitude of these recent chemical changes, identify the major external drivers of change and to discuss what further potential recovery is to be expected.
Regional description
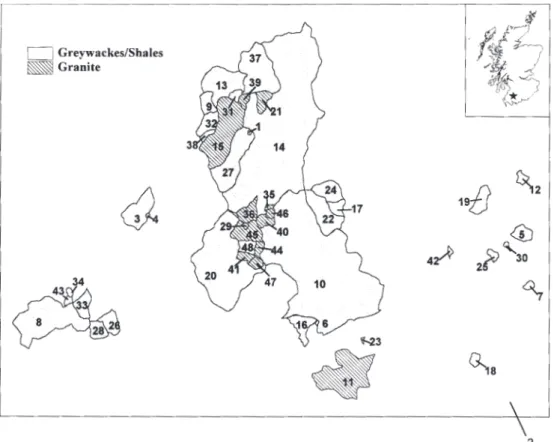
The Galloway region is a classic acid sensitive environment with highly siliceous granitic bedrock covered by thin, patchy, organic rich and generally acidic soils, which offers only limited ability to neutralise acid inputs from the atmosphere (Wright et al., 1994). Decades of acid deposition and, more recently, large-scale afforestation in the region, have exacerbated the problem of soil and water acidification (Rees and Ribbens, 1995). The Galloway region also receives some of the highest rainfall in Scotland with annual average exceeding 2000 mm.
The bedrock geology of the Galloway area is characterised by Paleozoic (mainly Silurian) sedimentary rocks (shale, slate, greywacke, sandstone and conglomerate) into which granitic plutons are intruded (Daysh, 1974). The soil distribution is closely related to altitude and slope with large
areas of brown forest soils occurring below 250–300 m on very steep land and peaty podzols at higher elevations or on less steep slopes. Poorly developed alpine rankers and lithosols occur in high altitude areas (> 600 m), particularly in the Merrick mountains. Peat, often deep (> 50cm), is widely developed in this area.
To the south and west of the region, moorland communities including Juncus effusus-Sphagnum recurvum,
Carex nigra and Erico-Sphagnetum papillosi are dominant
in areas of dystrophic peat, peaty gleys and low base status noncalcareous gley soils (Birse and Robertson, 1976). In the 1920s, the Forestry Commission began purchasing land in the area for afforestation. Nearly 70 000 ha was purchased, of which approximately half had been planted by 1974 (Edlin, 1974). The Forestry Commission land includes much of the higher-elevation, less accessible hill country, areas that are of relatively low value for agriculture and sheep grazing. Planting included not only the native Scots pine but also a number of exotic species such as European larch, Douglas fir and Norway and Sitka spruces. The catchments included in these surveys were selected to represent a regional distribution of acidified lochs in relation to acid deposition, forest cover, soil type and geology (Table 1 and Fig. 1).
Sampling and analysis
Surface water sampling began in 1979 and included 48 lochs in the vicinity of the three largest granitic plutons in the Galloway region (Fig. 1). These lochs were resampled in March/April of 1988, 1993, 1994, 1996, 1997 and 1998. Dip samples were collected either from the loch directly above the outflow stream or from the loch shore at about 50 cm water depth where no loch outflow existed. Samples were taken and stored in polyethylene bottles at 4ºC in the dark and were filtered through 0.45 µm membrane filters prior to analysis. Samples were analysed for a full suite of chemical determinands by standard procedures (Patrick et
al., 1991) at the Freshwater Fisheries Laboratory, Pitlochry
and the Norwegian Institute for Water Research, Oslo, for the 1979 and 1988 loch surveys. For subsequent surveys the analyses were conducted at the Macaulay Institute, Aberdeen. Strict quality control procedures between the laboratories ensured that there were no systematic differences in analytical results. pH was measured potentiometrically; calcium (Ca), magnesium (Mg), sodium (Na) and potassium (K) by atomic adsorption spectrophotometry; nitrate (NO3), chloride (Cl), and SO4 by ion chromatography; aluminium (Al) by automated colorimetry; dissolved organic carbon (DOC) by total carbon analyser (oxidation to carbon dioxide (CO2) with detection by IR). ANC was calculated as ∑ base cations (Ca, Mg, Na, K) minus ∑ acid anions (SO4, NO3, Cl).
Results
DEPOSITION
An estimate of the changes in wet deposition chemistry to the Galloway region has been obtained from the Loch Dee collector (Grid Reference NX 468 779) established in 1982 as part of the UK Acid Deposition Monitoring Network (UKADMN). A longer term perspective has been obtained from wet deposition data at the Eskdalemuir collector (Grid Reference NT 234 028), also as part of the UKADMN, with records dating back to 1973. This collector is located approximately 80 km to the east and 25 km to the north of the Loch Dee site.
The deposition data from the Eskdalemuir collector follows two different protocols; mean annual concentrations are calculated from both mean daily concentrations and mean weekly concentrations, the latter forming the basis of the UKADMN data (RGAR, 1983, 1987, 1993, 1997). Comparison of the wet deposited non-marine SO4 concentration from the two methods at Eskdalemuir (Fig. 2) shows no difference. Within the paper the non-marine component of sulphate (nmSO4) was determined by:
nmSO4 = SO4 – (R* Cl)
where nmSO4 is the non-marine concentration of SO4, and
R is the ratio of that ion to Cl in seawater (0.104 for SO4
where concentrations are in µeq l-1). The Loch Dee data is based on mean weekly concentrations and demonstrates greater annual variability in concentrations but the same overall trend as at Eskdalemuir. The general pattern is for a rapid decline in nmSO4 over the period 1978-1988 approximating to a > 50% reduction, followed by more stable concentrations during the 1980s and early 1990s, and a subsequent reduction (10% of 1978 values) until 1998. Concentrations of NO3 and ammonium (NH4) at both
Table 1. Catchment characteristics of 48 lochs in the
Galloway region
Attributes Number of
lochs
Geology Granite 14
Greywackes 34
Soils (dominant) Peat 5
Peaty gley 9
Peaty podzol 17
Sub-alpine podzols 8 Brown Forest Soils 9
Land Use Forested (1988) 28
Moorland (1988) 20
Loch:catchment < 0.1 33
area ratio 0.1- 0.2 10
> 0.2 5
Fig. 2. Wet deposition of non-marine SO4 at Eskdalemuir and
Eskdalemuir and Loch Dee have remained constant between 1980 and 1998 (Fig. 3).
Similarly, concentrations of Ca and Mg have remained relatively low and constant between 1980 and 1998 (Fig. 4). Chloride concentrations, however, have been extremely variable at Loch Dee reflecting the proximity of this site to the coast.
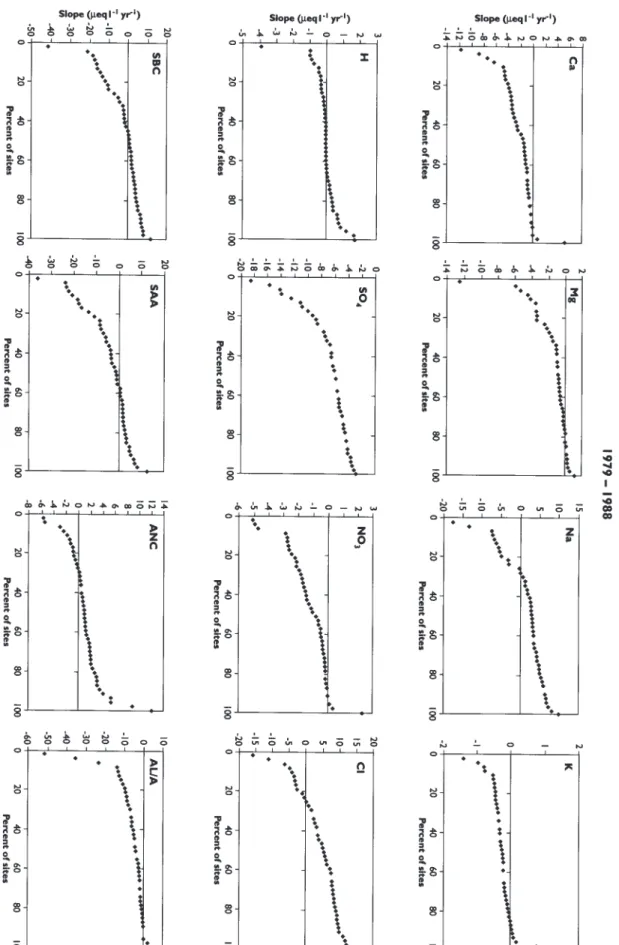
concentration of each ion (in µeql-1) by the number of years in the interval. These slopes are then sorted from lowest to highest and plotted against the % rank of each value. The resulting ranked-slope plots can be used to determine the percentage of sites that had slopes greater or less than some particular value.
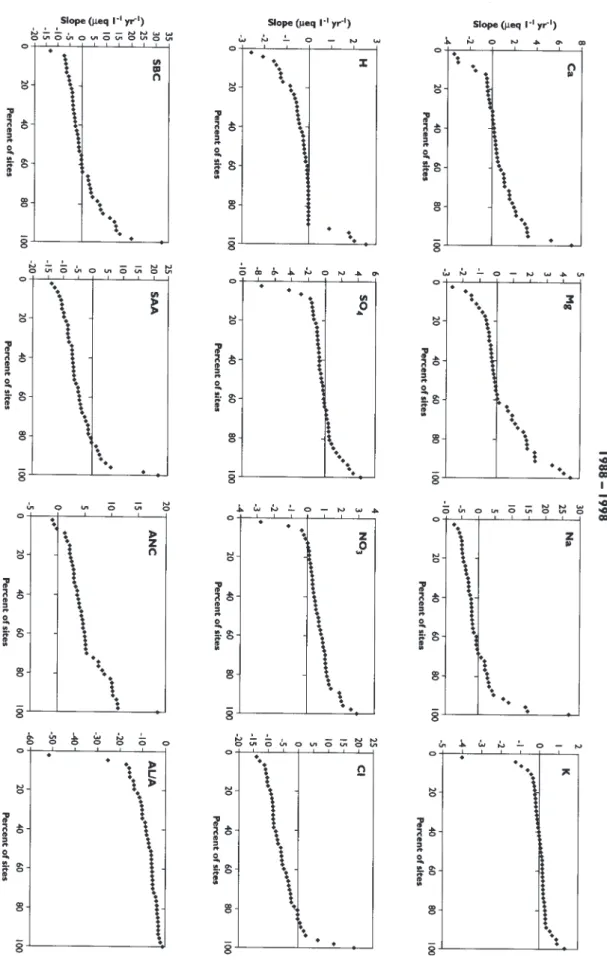
Concentrations of SO4 in all of the 48 lochs declined sharply during the first 10 years 1979-1988 (Figs. 5 and 6). Median change for the 48 lochs was –6 µeq l-1 per year (Table 2). During the next 10 years, 1988-1998, however, SO4 concentrations remained relatively constant with about equal numbers of lochs showing positive and negative changes (Fig. 7). This pattern of SO4 concentrations in the lochs closely reflects the trend in SO4 deposition in the region; the major decline in SO4 deposition occurred during the early 1980s (Fig. 2).
Concentrations of NO3 in the lochs, on the other hand, show no systematic regional pattern during the 20 years (Fig. 5). Concentrations were somewhat lower in 1988 relative to 1979, but then increased again during the period 1988-1998 (Figs. 6 and 7). In addition, deposition of inorganic N in the region has not changed systematically over this period. Samples collected in spring 1996 had exceptionally high concentrations of NO3 (Fig. 5). `Concentrations of sea-salt-derived ions, particularly Cl, in the lochs varied greatly, but did not show any major trend over time for the region (Fig. 5). Levels were relatively low in the first survey, higher in 1988 and then lower again during the late 1990s (Table 2). Linear changes are thus
Fig. 3. Concentrations of NO3 and NH4 in wet deposition at
Eskdalemuir and Loch Dee
Fig. 4. Base cation and Cl concentrations in wet deposition at Loch Dee, 1980-1998
HYDROCHEMISTRY
The distribution of changes in the concentration of each ion between each of the surveys can be illustrated with ranked-slope plots for each interval between surveys (1979-1988, 1988-1998 and 1979-1998). The change in each ion for each interval is expressed as a rate of change for the interval in question by dividing the observed change in the
Table 2. Median regional concentration of major ions in
1998 and slopes of changes for the periods 1979-1988, 1988-1998 and 1979-1988-1998. All data as ìeq l-1, all changes presented as ìeq l-1 per year.
Median Change Change Change
regional 1979– 1988– 1979– chemistry 1988 1998 1998 1998 Ca 49.9 -1.35 0.34 -0.24 Mg 49.9 -0.73 -0.07 -0.11 Na 171.9 3.43 -1.83 1.26 K 7.6 -0.23 0.10 -0.04 NO3 8.8 -0.76 0.68 0.07 SO4 59.1 -5.78 -0.39 -2.41 Cl 180.2 5.64 -5.50 0.22 SBC 281.3 0.50 -1.42 1.07 SAA 248.1 -0.74 -6.01 -1.97 ANC 33.2 1.18 4.50 3.26
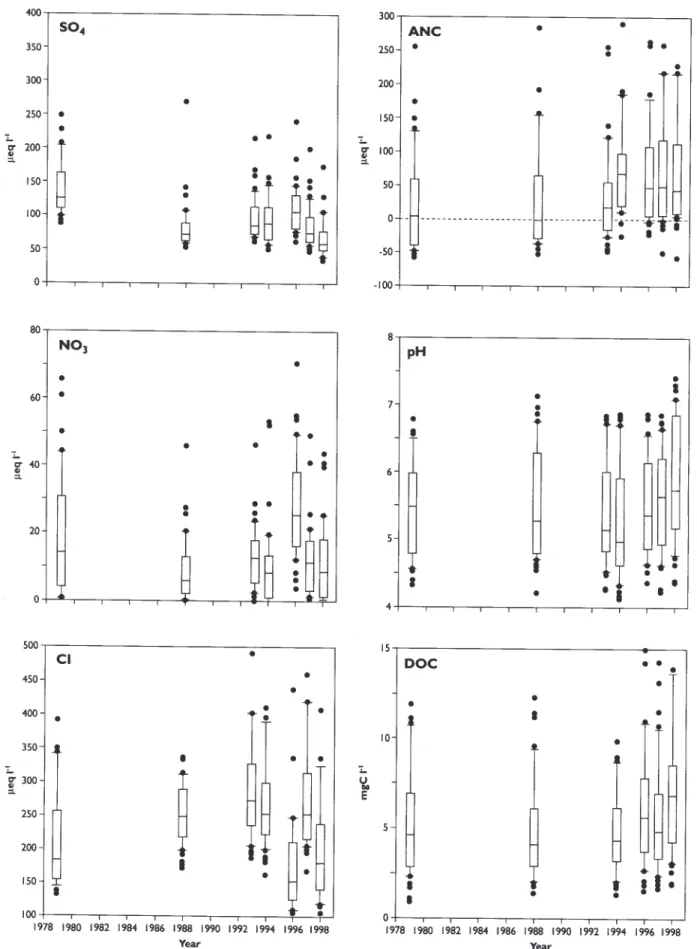
Fig. 5. Box and whisker plots of selected determinands (SO4, NO3, C, ANC, pH and DOC) for the seven regional surveys in Galloway, since
1979. All data as µeq l-1 except pH, and DOC (mg l-1). The box represents the 25 and 75 percentile and the whisker is the 10th and 90th
positive in the first 10 years (Fig. 6) and negative during the second 10 years (Fig. 7). In this instance, no significant regional trend was observed during the 20 year record (Fig. 8).
As a consequence of the changes in SO4, NO3 and Cl, the median sum of strong acid anions (SAA) decreased by about 1 µeq l-1 per year over the period 1979 to 1988; the large decrease in SO4 was offset by an increase in Cl. Over the second 10 year period (1988-1998), the median SAA decreased further by 6 µeq l-1 per year, largely due to lower Cl concentrations (Table 2). For the entire 20 years the median change in SAA was –2 µeq l-1. All but four of the lochs showed negative change in SAA over the entire period (Fig. 8).
Charge balance necessitates that decreases in SAA are compensated by either a decrease in base cations or an increase in ANC. Median change in sum of base cations was +1 µeq l-1 per year over the entire 20 years (Table 2). Trend analyses of Ca and SO4 are very similar. Loch data from the first 10 years showed a decline in Ca (median slope of –1.4 µeq l-1 per year), with little change during the next 10 years. Trends in Mg and K are similar to those for Ca.
During the first and second 10 year period, increases in ANC were concurrent with decreases in SAA concentrations, whereby the median slope of ANC in the first 10 years equalled +1 µeq l-1 per year and +4 µeq l-1 per year during the second 10 year period (Figs. 6, 7, and 8; Table 2). The increases in ANC were due to decreased concentrations of hydrogen (H) ion and Al. Dissolved organic carbon (DOC) appears to have increased from 1994 to 1998.
Discussion
Monitoring of surface water chemistry began in earnest in the UK in the late 1970s following the recognition that surface water acidification presented a problem. The approach to monitoring has taken two directions: systematic and routine sampling of individual sites at monthly intervals (or less) and synoptic surveys sampling surface standing waters in a region on an annual frequency (or more). Determination of chemical trends from the former relies upon detecting a signal from noise introduced by the short-term chemical response to rainfall input and seasonality. In the latter, the signal must be detected from noise introduced by different physical characteristics of a large population of lakes. In practice, a balance between both approaches provides the most robust results and interpretation.
The data presented come from a regional survey of 48 lochs conducted seven times during a 20-year period. The general pattern of change identified by these spatially
extensive but temporally sparse data, mirrors changes in individual lochs sampled more frequently over the same time period by Harriman et al. (1995, 2001) and NEGTAP (2001). Temporal changes in loch chemistry identified in this study, therefore, provide a mechanism to examine the regional response of both highly acidified as well as more moderately acidified waters. For example, the data of Harriman et al. (2001) for Loch Enoch show large decreases in SO4 concentrations during the 1980s with smaller changes during the 1990s, which are concomitant with deposition trends highlighted in Fig 2. This pattern of change is also accompanied by small decreases in concentrations of base cations and an increase in ANC (Harriman et al., 2001). The seven regional surveys conducted over 20 years, superimposed on detailed chemistry from high-frequency monitoring at selected sites, thus appear to capture adequately the major trends in water chemistry in Galloway lochs.
Surface waters in the Galloway region are strongly influenced by inputs of sea-salts from the atmosphere. This is generally the case over large areas of the UK (Monteith and Evans, 2000). Inputs of sea-salts occur in conjunction with storms and since Cl is very mobile in soils, Cl concentrations in streams and lochs show large variation over time. The cations in the sea-salts, mainly Na and Mg, are not as mobile in soils as Cl since both cations participate in cation exchange reactions. In acidified soils, such as those typical of the Galloway region, the incoming Na and Mg exchange in part for inorganic Al and H,resulting in decreased ANC of the run-off. This episodic acidification due to sea-salt deposition has been documented in studies from Loch Dee in Galloway (Langan, 1987), Norway (Hindar et al., 1994) and Maine, USA, (Heath et al., 1992) and was demonstrated experimentally at Sogndal, Norway (Wright et al., 1988).
Episodic input of sea-salts must be considered in case they obscure ongoing trends of acidification, as is apparently the case in this 20-year record from the Galloway lochs. It is especially important, therefore, to ensure that low frequency regional survey data is consistent with high frequency data collected from sites in the same region. The major decline in SO4 concentrations in the lochs during the first ten years should have produced declines in base cations and increases in ANC. But the sea-salt levels (as shown by Cl concentrations) were about 25% higher in 1988 than in 1979 and thus short-term acidification due to sea-salts offset much of the long-term recovery expected in the lochs. During the next 10 years, however, Cl concentrations decreased back to 1979 levels and the lochs show large increases in ANC despite little change in SO4 concentrations. The trend data indicate that year-to-year variations in
salt deposition caused a 5-10 year delay in the recovery in ANC in the lochs. This is a similar result to that of Monteith and Evans (2000) in their analysis of a 10-year record of water chemistry trends in 22 lakes and streams in the UK Acid Waters Monitoring Network (AWMN). They showed that variable inputs of sea-salts causes ‘noise’ in the concentrations of major ions such that long-term trends may be partly masked.
Nitrate concentrations in streamwaters have been shown to be related to the amount of N deposition with sites receiving between 10 and 25 kg N ha-1yr-1 showing a variable response, such that some sites show elevated levels, whilst others do not. Sites with deposition inputs above 25 kg N ha-1, however, have shown elevated NO
3 outputs (Dise and Wright, 1995). For Galloway, present day deposition of N is higher than the 25 kg N ha-1 threshold and some evidence of N enrichment and potential elevated N release should be expected. The current 20-year records suggest that there has been no regional increase in N saturation, at least under the criterion of increased leaching of inorganic N from the soil (Aber et al., 1989). The lochs and their catchments retain 80–100% (Helliwell et al., 2001) of inorganic N deposition and have done so for the 20-year period. The number of lochs with increasing NO3 concentrations is equal to those with decreasing trends over the 20 year period. If N saturation is occurring, the rate of breakthrough is very slow (i.e. very long time lag). Helliwell
et al. (2001), however, highlight that N leaching was evident
from forested catchments in Galloway with soil C/N ratios below 20, in line with that predicted for European forest soils (Gundersen, 1995; Gundersen et al., 1998).
The exceptionally high NO3 concentrations in 1996 are apparently a larger regional phenomenon, as such a peak is also reported from the 10-year records of the AWMN (Monteith et al., 2000). The cause of this peak is probably related to climate and Monteith et al. (2000) suggest that unusually cold winters give rise to higher NO3 concentrations in surface waters in the spring.
From the decline in SO4 deposition and concentrations of SO4 in the lochs, it appears that about 75% of the possible improvement in surface water quality has already occurred over the 20-year period 1979–1998. The median non-marine SO4 concentration in the lochs declined by 67 µeq l-1 from about 108 µeq l-1 in 1979 and to about 41µeq l-1 in 1998. The marine fraction of SO4 amounts to about 20 µeq l-1. Median non-marine SBC declined by about 23 µeq l-1 from about 115 to 92 µeq l-1, while median ANC increased by about 40 µeq l-1 from about 3 to about 43 µeq l-1. The decline in SO4, therefore, was compensated one third by decreased SBC and two thirds by increased ANC. From these changes, a rough estimate of the maximum future recovery in ANC
can be obtained. If in the future non-marine SO4 deposition were to decrease to zero, the concentrations in the lochs would decrease by a further 20 µeq l-1 to median value of about 20 µeq l-1 (an estimate of median background non-marine SO4 concentration). This would be compensated by about a 7 µeq l-1 decrease in SBC and a 13 µeq l-1 increase in ANC. This rough estimate indicates, therefore, that of the total improvement in ANC (median change of 53µeq l-1), about 75% (median change 1979 to 1998 40µeq l-1) has already occurred.
This estimate assumes no long-term changes in NO3 concentrations. Nitrate in the future could go either up, down, or stay the same. Continued inputs of inorganic N from deposition should, over the long term, result in N saturation with increased concentrations of NO3 in run-off (Aber et al., 1989). The 20-year record from Galloway lochs indicates, however, that this process is very slow, as there has been no significant increase in NO3 concentrations in the lochs over the period 1979–98 despite 20 years of high N deposition in the area. On the other hand, NO3 concentrations in the future could decrease due to decreased deposition of inorganic N. If the emission reduction requirements of the Gothenburg protocol are indeed implemented, then N deposition in Europe should decrease by over 50% by the year 2010 relative to the base year 1990 (expected reductions: SO4 63%; NOx 41%; NHy 17%). But in this case, since median NO3 concentration in 1998 was only about 10 µeq l-1, future decreases in concentrations could only cause a few µeq l-1 increase in ANC. The potential impact of land use and management on terrestrial N cycling, in particular commercial afforestation, is also unclear (Ferrier et al., 1995).
The increase in DOC concentrations during the 1990s in the Galloway lochs is part of a general trend reported from many areas of northwestern Europe. The 10-year record from the UKAWMN shows striking increases in DOC in most sites (Monteith and Evans, 2000), as do similar data from waters in Norway (Skjelkvåle et al., 1998). Here, again, climate is probably the driving factor as the increases have occurred simultaneously in waters over a very large area and in both acidified and non-acidified systems (Monteith and Evans, 2000). Increased DOC will result in increased organic anion availability which will buffer pH and increase ANC. Thus, the pH levels in the lochs in Galloway have recovered less than expected from the increase in ANC.
In summary, it is clear that the lochs in Galloway have shown substantial recovery in response to a long-term decline in the anthropogenic deposition of primarily S and, to a lesser degree, N. The regional pattern of recovery is consistent with that observed for specific lochs where high frequency monitoring has been carried out. The role of acid
deposition as a driving factor for changes in water chemistry in the Galloway lochs, however, is confounded by concurrent changes in other driving variables, most notably factors related to variations in climate. Sea-salt deposition and other climatic influences, are regionally important in this area of Scotland and strongly influence the observed hydrochemical response, especially N and C dynamics.
Acknowledgements
We are indebted to the numerous colleagues who have been involved in the regional water surveys since 1979. This project was supported financially by the Commission of European Communities projects DYNAMO (ENV4-CT95-0030) and RECOVER:2010 (ENK1-CT-1999-00018), the Scottish Executive Environment and Rural Affairs Department (SEERAD), the UK Natural Environment Research Council and the Norwegian Institute for Water Research. Analytical support from the Freshwater Fisheries Laboratory (Pitlochry), the Macaulay Institute and the Norwegian Institute for Water Research is gratefully acknowledged.
References
Aber, J.D., Nadelhoffer, K.J., Steudler, P. and Melillo, J., 1989. Nitrogen saturation in northern forest ecosystems. Bioscience, 39, 378–386.
Battarbee, R.W., Mason, B.J., Renberg, I. and Talling, J.F. (Eds.), 1990. Palaeolimnology and Lake Acidification. Royal Society, London, 445 pp.
Birse, E.L. and Robertson, J.S., 1976. Plant communities and soils
of the lowlands and southern upland regions of Scotland.
Macaulay Institute for Soil Research, Aberdeen, 87 pp. Daysh, G.H.J., 1974. Geology. In: Galloway Forest Park. Forestry
Commission Guide, H.L. Edlin (Ed.), 24–27. Her Majesty’s
Stationery Office, Edinburgh.
Dise, N.B. and Wright, R.F., 1995. Nitrogen leaching from European forests in relation to nitrogen deposition. Forest Ecol.
Manage., 71, 153–162.
DOE, 1995. Critical loads of acid deposition for UK freshwaters. HMSO, London, 79 pp.
Edlin, H.L., 1974. Galloway Forest Park. Forestry Commission
Guide. Her Majesty’s Stationary Office, Edinburgh, 79 pp.
Ferrier, R.C., Jenkins, A., Cosby, B.J., Helliwell, R.C., Wright, R.F. and Bulger, A.J., 1995. Effects of future N deposition scenarios on the Galloway region of SW Scotland using a coupled sulphur and nitrogen model (MAGIC-WAND). Water
Air Soil Pollut., 85, 707–712.
Gundersen, P., 1995. Nitrogen deposition and leaching in European forests - preliminary results from a data compilation. Water Air
Soil Pollut., 85, 1179–1184.
Gundersen, P., Emmett, B.A., Kjonaas, O.J., Koopmanns, C.J. and Tietema, A., 1998. Impact of nitrogen deposition on nitrogen cycling in forests: a synthesis of NITREX data. Forest
Ecol. Manage., 101, 37–56.
Harriman, R., Morrison, B.R.S., Birks, H.J.B., Christie, A.E.G., Collen, P. and Watt, A.W., 1995. Long-term chemical and biological trends in Scottish streams and lochs. Water Air Soil
Pollut., 85, 701–706.
Harriman, R., Watt, A.W., Christie, A.E.G., Collen, P., Moore, D.W., McCartney, A.G., Taylor, E.M. and Watson, J., 2001. Interpretation of trends in acidic deposition and surface water chemistry in Scotland during the past three decades. Hydrol.
Earth Syst. Sci., 5, 407–420.
Heath, R.H., Kahl, J.S., Norton, S.A. and Fernandez, I.J., 1992. Episodic acidification caused by the sea-salt effect in coastal Maine streams. Water Resour. Res., 28, 1081–1088.
Helliwell, R.C., Ferrier, R.C. and Kernan, M.R., 2001. Interaction of nitrogen deposition and land use on soil and water quality in Scotland: issues of spatial variability and scale. Sci. Total Envir., 265, 51–63.
Hindar, A., Henriksen, A., Tørseth, K. and Semb, A., 1994. Acid water and fish death. Nature, 372, 327–328.
Langan, S.J., 1987. Episodic acidification of streams at Loch Dee, S.W.Scotland. Trans. Roy. Soc. Edinb., 78, 393–398.
Monteith, D.T. and Evans, C.D., 2000. 10 Year Report. Analysis
and Interpretation of Results, April 1988-March 1998. UK Acid Waters Monitoring Network. ENSIS Publishing, London, 365
pp.
Monteith, D.T., Evans, C.E. and Reynolds, B., 2000 Are temporal variations in the nitrate content of UK upland freshwaters linked to the North Atlantic Oscillation? Hydrol. Process., 14, 1745– 1749.
NEGTAP, 2001. Transboundary air pollution: acidification,
eutrophication, and ground level ozone in the UK. NEGTAP,
DETR, London, (http://www.nbu.ac.uk/NEGTAP), 283 pp. Patrick, S.T., Juggins, S., Waters, D. and Jenkins, A., 1991. The
United Kingdom Acid Waters Monitoring Network. Site Description and Methodology Report. Report to DOE and DOE
NI. ENSIS Publishing, London, 63 pp.
RGAR, 1983. Acid deposition in the UK. Report to DOE. Warren Spring Laboratory, Herts, 72 pp.
RGAR, 1987. Acid deposition in the UK 1981-1985. Report to DOE. Warren Spring Laboratory, Herts, 101 pp.
RGAR, 1993. Acid deposition in the UK 1986-1988. Report to DOE. Warren Spring Laboratory, Herts, 124 pp.
RGAR, 1997. Acid deposition in the UK 1992-1994. Report to DOE. AEA Technology, Abingdon, 174 pp.
Rees, R.M. and Ribbens, J.C.H., 1995. Relationships between afforestation, water chemistry and fish stocks in an upland catchment in south-west Scotland. Water Air Soil Pollut., 85, 303–30.
Skjelkvåle, B.L., Wright, R.F. and Henriksen, A., 1998. Norwegian lakes show widespread recovery from acidification: results of national surveys of lakewater chemistry 1986-1997. Hydrol.
Earth Syst. Sci., 2, 555–562.
Wright, R.F. and Henriksen, A., 1980. Regional survey of lakes
and streams in southwestern Scotland, April 1979. Internal
Report IR 72/80, SNSF-Project, Ås, Norway, 63 pp.
Wright, R.F., Norton, S.A., Brakke, D.F. and Frogner, T., 1988. Experimental verification of episodic acidification of freshwaters by sea-salts. Nature, 334, 422–424.
Wright, R.F., Cosby, B.J., Ferrier, R.C., Jenkins, A., Bulger, A.J. and Harriman, R., 1994. Changes in the acidification of lochs in Galloway, southwestern Scotland, 1979-1988: The MAGIC model used to evaluate the role of afforestation, calculate critical loads and predict fish status. J. Hydrol. 161, 257–285.