HAL Id: hal-00316931
https://hal.archives-ouvertes.fr/hal-00316931
Submitted on 1 Jan 2002
HAL is a multi-disciplinary open access
archive for the deposit and dissemination of
sci-entific research documents, whether they are
pub-lished or not. The documents may come from
teaching and research institutions in France or
abroad, or from public or private research centers.
L’archive ouverte pluridisciplinaire HAL, est
destinée au dépôt et à la diffusion de documents
scientifiques de niveau recherche, publiés ou non,
émanant des établissements d’enseignement et de
recherche français ou étrangers, des laboratoires
publics ou privés.
Case studies on the dynamics of Pi3 geomagnetic and
riometer pulsations during auroral activations
N. G. Kleimenova, O. V. Kozyreva, K. Kauristie, J. Manninen, A. Ranta
To cite this version:
N. G. Kleimenova, O. V. Kozyreva, K. Kauristie, J. Manninen, A. Ranta. Case studies on the
dynamics of Pi3 geomagnetic and riometer pulsations during auroral activations. Annales Geophysicae,
European Geosciences Union, 2002, 20 (2), pp.151-159. �hal-00316931�
Annales
Geophysicae
Case studies on the dynamics of Pi3 geomagnetic and riometer
pulsations during auroral activations
N. G. Kleimenova1, O. V. Kozyreva1, K. Kauristie2, J. Manninen3, and A. Ranta3
1Institute of the Earth Physics, Moscow 123995, Russia
2Finnish Meteorological Institute, Geophysical Research Division, P.O. Box 503, FIN-00101 Helsinki, Finland 3Oulu University, Sodankyl¨a Geophysical Observatory, FIN-99600 Sodankyl¨a, Finland
Received: 24 April 2001 – Revised: 12 October 2001 – Accepted: 6 November 2001
Abstract. A sequence of three subsequent auroral
activa-tions (at 18:10, 19:48 and 20:00 UT) on 9 February 1997 is analysed. The brightenings of optical auroras were collo-cated with latitudinally localized bursts of pulsating riome-ter absorption and Pi3 geomagnetic pulsations. In two of the cases, the strongest westward directed electrojet currents and the footpoint of the upward directed field-aligned cur-rents related to the auroral brightening were observed in the same region as the largest amplitude of the pulsations and their polarization changed. In the third case, field-aligned current signatures were present, but not so pronounced that their accurate location could not be defined. In all cases, the spectra of geomagnetic and absorption pulsations were simi-lar. Based on ground-based observations alone, it is difficult to say whether the energetic particle precipitation (riometer absorption) was modulated by the geomagnetic pulsations or whether the geomagnetic pulsations were caused by varying ionospheric currents controlled by the precipitating particle intensity. However, the localized nature of both pulsations of the two different phenomena and their tight coupling with each other seem to support the latter option.
Key words. Ionosphere (Particle precipitation) –
Magneto-spheric physics (auroral phenomena; MHD waves and insta-bilities)
1 Introduction
The brightening and breakup of a preexisting stable arc, the abrupt negative deviation in the magnetic north (X) com-ponent, and the magnetic Pi2 pulsations (T = 40 − 150 s) are typical substorm expansion phase onset signatures in the ionosphere (Akasofu, 1964; Fukunishi, 1975). It is not yet exactly known which processes in the magnetosphere cause the initial brightening of the auroral arc. The magnetic sig-natures can be associated with the build up of the substorm
Correspondence to: N. Kleimenova
(kleimen@uipe-ras.scgis.ru)
current wedge (SCW) (McPherron et al., 1973). Pi2 pulsa-tions are a consequence of the shear Alfv´en waves carrying the field-aligned currents (FACs) in the wedge, and the iono-spheric part of the wedge (a strong westward current) causes the negative X-bay. Pi2 pulsations have been recognized to be a fundamental element in magnetospheric substorm mor-phology, since they can be observed in a wide range of lati-tudes and longilati-tudes on the ground (Olson, 1999). However, during the substorm sequence, Pi3 type geomagnetic pulsa-tions very often also occur with longer periods than Pi2. Ac-cording to Saito (1978), the substorm associated Pi3 pulsa-tions can be separated into two categories: the Ps6 type, with periods longer than 400–600 s and dominantly observed in the D-component, and the PiP type, with periods less than 400 s and amplitudes comparable in all three components of the field. The PiP periods are from 150 to 400 s, and the average amplitudes from several tens of nT to hundred nT (Raspopov et al., 1973; Kiselev and Raspopov, 1976). The onset of PiPs at the higher latitudes lags behind the onset at auroral zone latitudes, where PiPs can be accompanied by auroral intensity fluctuations in the similar period range. Nagano et al. (1981) show that high latitude Pi3s with peri-ods longer than 400 s are more commonly observed than PiP type pulsations, and that the amplitudes of Pi3s are largest near the center of the westward auroral electrojet. Accord-ing to Suzuki et al. (1981), the distributions of nightside Pi3 are similar to those of Pi2. Kleimenova et al. (1998) showed that in the auroral zone, Pi3 pulsations (f ∼ 1 − 3 MHz) are very localized in latitude and closely related to the substorm intensification.
Numerous observations have indicated that substorm asso-ciated energetic particle precipitation (as measured by riome-ters) can have temporal variations with periods of 3–15 min, i.e. in the frequency range of Pi3 periods (Wedeken et al., 1979). Furthermore, it has been shown that in the auroral zone, the Pi2 pulsations are highly correlated with the pul-sating component of the riometer data (Stuart et al., 1977; Heacock and Hornsucker, 1977; Haldoupis et al., 1982). Si-multaneous observations of optical aurora and energetic
par-152 N. G. Kleimenova et. al.: Riometer and magnetic Pi3 during auroral activations 60 62 64 66 68 70 72 56 58
Corr. geomagn. longitude
Co
rr.
g
eo
m
ag
n.
la
tit
ud
e
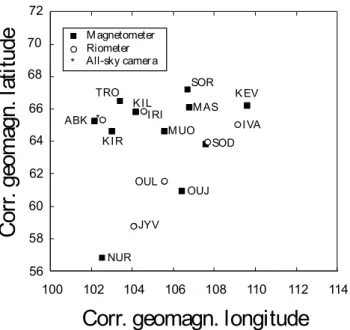
KEV IVA MAS OUJ OUL KIR ABK SOD MUO KIL 100 102 104 106 108 110 112 114 JYV NUR * Magnetometer Riometer * All-sky camera TRO SOR IRIFig. 1. A map showing the CGM latitudes and longitudes of the magnetometer and riometer stations.
ticle precipitation have been analysed in a few papers (An-derson and DeWitt, 1963; Barcus, 1965; Nielsen et al., 1988; Lazutin et al., 2000). The new point of this study is to anal-yse simultaneous observations of all three different types of phenomena. The behavior of auroral breakups, riometer ab-sorption variations and Pi3 type pulsations during a sequence of several subsequent activations is investigated in order to demonstrate how these activations are spatially and tempo-rally coupled with each other and with the other expansion phase phenomena.
2 Instrumentation
MIRACLE is a two-dimensional instrument network con-structed for studies of mesoscale auroral activity in the Scan-dinavian sector (Syrj¨asuo et al., 1998). The network includes 25 magnetometer stations (the IMAGE network, L¨uhr et al., 1998), eight all-sky cameras (ASC) and the STARE radar system with two coherent scatter radars. The sampling rate of IMAGE is 10 s. The ASCs acquire images through filters of 557.7 nm and 630.0 nm with the sampling rates of 20 s and 60 s, respectively. This study utilizes IMAGE data and ASC images recorded at Abisko (ABK, 68.36 N, 18.82 E). The field of view of the ABK ASC at the 100 km altitude is a circle with the radius of approximately 300 km. Spa-tial resolution of the ASC varies between less than a one km distance per pixel (near the zenith) to a few km per pixel (near horizon). Unfortunately STARE data are not avail-able for the event analysed here. Combined with the MIR-ACLE data, we analyse recordings of a chain of 6 riometer stations: Ivalo (IVA, 30 MHz), one IRIS (Ionosphere Riome-ter Imaging System) beam (IRI, 38.2 MHz) (Browne et al., 1995), Sodankyl¨a (SOD, 30 MHz), Oulu (OUL, 32.4 MHz),
and Jyv¨askyl¨a (JYV, 32.4 MHz). The riometers measure the variation in the intensity of the galactic cosmic noise on the ground. The intensity of observed signal is a function of the height integrated electron density in the D- and E-regions, which, in the first instance, is a function of the energetic (more than 10–20 keV) electron precipitation. The sampling rate of the riometers is 10 s, and the beam covers at the 90 km altitude a circular area of 100 km diameter. Figure 1 shows the locations in corrected geomagnetic (CGM) coordinates of the instruments used in this study.
3 Observations
On 9 February 1997, the time between 12:00–24:00 UT was magnetically very disturbed. The quicklook AE index (based on the data of seven AE-observatories) shows at least four substorm-like activations, with peak AE values between 500 and 1800 nT around the hours of 14:00, 18:00, 20:00, and 22:00 UT. The WIND satellite was monitoring the solar wind at XGSM= 197 RE (YGSM =8 RE, ZGSM = −16 RE). At 12:50 UT, the satellite observed a shock front with an abrupt increase in the ion density and earthward directed plasma ve-locity. The IMF direction was very variable until 16:20 UT, when IMF BZ suddenly changed to strongly negative val-ues (below −5 nT) and stayed there until 21:00 UT. The de-lay time from WIND to the Earth’s magnetopause is ap-proximately 35 min, if it is simply calculated using the mea-sured solar wind velocity (VGSM=560 − 600 km/s) and the distance from the satellite to the Earth’s magnetopause (at
XGSM =10 RE). Real observations seem to follow this ap-proximation relatively well, since IMAGE recorded the sud-den impulse (SI) driven by the solar wind shock at 13:21 UT. Figure 2 (upper panel) shows the geographical location of the auroral electrojets as a function of time. The latitude profile of the X-component deviations recorded at the IM-AGE middle meridion stations have been upward continu-ated to the ionospheric level, using the method of Mersmann et al. (1979). In the upward continuated latitude profiles, the electrojet boundaries are more pronounced than in the ground observed profiles. The latitudinal resolution of the method is
∼0.8◦. The lower panel shows the estimated intensity of the electrojet current densities (J = 2X/µ0).
The data of Fig. 2 show growth phase activity, i.e. an in-tensification and equatorward shift of the auroral electrojets, starting at 17:00 and 18:30 UT. The effects of the expansion phase SCW currents are most clearly visible at the end of the growth phases, i.e. at 18:10 and 20:00 UT. At the ionospheric footpoint of the upward field-aligned currents (FACs), there is a counterclockwise Hall current vortex. Consequently, on the poleward (equatorward) side of the footpoint, westward (eastward) currents intensify. The vortices are seen as pairs of red and blue regions in the color plot of Fig. 2. Since only X-component data is used in the analysis, the plot does not show the effects of the poleward and equatorward cur-rents that cause the deviations primarily in the magnetic east component below a vortex structure. In the latter case (after
Fig. 2. The locations (in geographic latitudes) and intensities of the auroral electrojets as a function of time during the period of this study. In the top plot, the blue (red and yellow) colors show the location of the westward (eastward) electrojet (currents are close to zero in the green regions) and in the bottom plot, a solid (dashed) curve shows the total current intensity of the westward (eastward) electrojet.
20:00 UT), the vortex formed in a region previously domi-nated by the westward electrojet and thus a part of the east-ward current is seen as “a hole in the westeast-ward currents”. Note that the plot also shows FAC-related signatures around 19:20 UT, although these signatures are not as clear at 18:10 and 20:00 UT.
A set of ABK ASC images is shown in Fig. 3. The ASC at ABK started to acquire images at 18:01 UT. The first images show dim auroral arcs in the zenith and some-what brighter arcs both in the southern and northern horizons. The southern-most arc broke up at 18:10 UT and the activ-ity spread rapidly from south to the zenith and later to the northern sky. Around 19:20 UT, the auroras in the southern horizon brightened again (not shown), but the activity stayed so close to the horizon that defining the exact dynamics was difficult. Around 19:48 UT, new bright auroras appeared to the zenith and a further intensification in the activity took place 19:52 UT, when a westward travelling surge (WTS) in-truded from the eastern horizon to the zenith of the camera. The WTS related activity continued in the entire sky of ABK until 20:27 UT.
The auroral brightenings at 18:10 UT and from 19:48– 19:52 UT can be associated both temporally and spatially with the clear SCW signatures of Fig. 2. In the first case, the breakup region was at the CGM latitude of 62.3◦and in the second case it was at latitude 65◦. According to Fig. 2, the footpoints of the corresponding upward directed FACs were at the CGM latitudes of 62.5◦and 66.5◦(the CGM
lat-itude is roughly 3.5◦ less than the geographical latitude in this region). The weaker FAC signature in Fig. 2 (19:20 UT) seems to be temporally related to the auroral brightening at 19:22 UT, but the spatial connection is not so clear; the auro-ras are clearly more south than the strongest magnetic signa-tures.
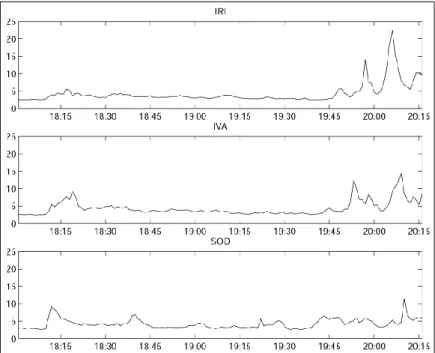
Figure 4 represents the magnetic X-component and riome-ter data: raw records (panel a), their dynamic spectra in the frequency range of 0.5–4.0 MHz (panel b) and 1–3 MHz fil-tered data (panel c), recorded at the IMAGE and riometer stations shown in Fig. 1. The magnetic Y -component of Pi3 pulsations is characterized by a little spectral difference. However, the space-time variations (not shown here) are sim-ilar to the X-component. The spatial distribution of 0.5– 2.0 MHz geomagnetic pulsations is plotted in Fig. 5. Fig-ure 6 demonstrates the integrated intensity of optical auroras in the approximate beam locations of the riometers IRI, IVA, and SOD.
The first auroral breakup caused magnetic effects primar-ily at the southern stations of SOD and OUJ (Fig. 4, panel a, and Fig. 6). The breakup was accompanied by a short burst of riometer absorption observed at a very narrow latitudinal area (SOD) and in the Pi3 range pulsations both in the ri-ometer and magnetri-ometer data (Fig. 4). Both the riri-ometer and magnetic pulsations have a maximum intensity at ∼ 0.5– 2.0 MHz, were recorded simultaneously at the same lati-tudes, and were aproximately in anti-phase (Fig. 4, panel c). In both spectra, there is also an amplitude enhancement in
154 N. G. Kleimenova et. al.: Riometer and magnetic Pi3 during auroral activations
Fig. 3. ASC frames recorded at the sta-tion ABK around the times of the auro-ral intensifications (18:10 UT, 19:48 UT and 20:00 UT).
the PiP range (2–4 MHz). The phase of the PiP magnetic pulsations at SOD led the wave phase at OUJ for about one-third of the average wave period. The rotation of the polar-ization vector at these stations was the opposite: clockwise at higher latitudes (SOD) and counterclockwise at lower lat-itudes (OUJ), i.e. that the source of the wave is located be-tween these stations. The 0.5–2.0 MHz (Pi3) pulsation shows the similar morphological properties and there is no reason to separate PiP and Pi3 into different types.
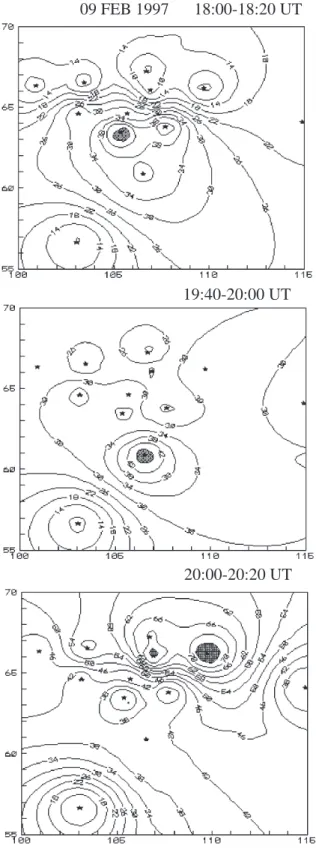
The top panel of Fig. 5 shows the map of the spatial distri-bution of Pi3 geomagnetic pulsation amplitude integrated for the time interval of 18:00–18:20 UT. The area of the maxi-mum amplitude is marked with the gray shading. The map, together with Figs. 2 and 4, demonstrate that the strongest 0.5–2.0 MHz magnetic pulsations were recorded in the same region as the strongest riometer absorption, and this was the same region where the footpoint resided of the SCW related upward FAC resided and where the auroral breakup took place. More accurately, the footpoint of the FAC was be-tween stations SOD and OUJ, which observed the pulsations with different phases. A very sharp attenuation of the Pi3 amplitude can be seen in Fig. 5 (top panel) near the CGM lat-itude of 65◦. This boundary cannot be the polar cap boundary since auroras were also observed on its poleward side, but it can correspond to the tailward edge of the substorm activity region in the near-Earth magnetosphere (Baker et al., 1996). The riometer absorption and Pi3 activity around 19:30 UT (Fig. 4) are most probably associated with the auroral and magnetic activations at 19:20 UT. It is interesting to note that the riometer pulsations (Fig. 4, panel b) are strongest in the southern region (SOD) where the auroras were strongest, while the magnetic signatures, pulsations and the FAC-signature in Fig. 2 dominated at higher latitudes (KEV).
The next period of strong pulsation and riometer activ-ity started around 19:48 UT. The magnetometers in Fig. 4 (panel a) show that the negative deviation in X was at first the strongest at OUJ. The bay was accompanied by a burst of the pulsating riometer absorption and Pi3 geomagnetic pul-sations. The middle panel of Fig. 5 shows the spatial dis-tribution of Pi3 geomagnetic pulsations at 19:40–20:00 UT. During this period, the maximum of the Pi3 amplitude was located near OUJ, which is at lower latitudes than during the first breakup (18:11 UT). The rotation of the polarization vector of geomagnetic pulsation (both Pi3 and PiP range) changed between SOD and OUJ. At this time, contrary to the first breakup, the rotation was counterclockwise at higher latitudes (SOD) and clockwise at lower latitudes (OUJ). This would suggest that the upward FAC was between SOD and OUJ. In this case, the electrojet boundary plot of Fig. 2 does not provide further confirmation for this conclusion as it does for the first breakup (clear FAC signatures are visible only af-ter 20:00 UT).
When the WTS moved above the zenith of ABK around 20:00 UT the riometer and magnetic activity also shifted to higher latitudes. The most intensive aurora was observed at ∼ 20:05 UT, northward of ABK, and the center of the westward electrojet shifted to the CGM latitudes of 66–67◦ (Fig. 2). The strongest riometer absorption, and riometer and magnetic pulsations (both PiP and Pi3) were observed at the same latitudes. The direction of the vector polarization of Pi3 pulsation was clockwise near KEV, and the Pi3 polarization reversal occurred between KEV (CGM latitude of ∼ 66◦) and SOD (CGM latitude of ∼ 64◦), which is somewhat south of the FAC footpoint (CGM lat 66.5◦) as suggested by the plot in Fig. 2. The spatial magnetic-Pi3 distribution for the period of 20:00–20:20 UT is shown in the bottom panel of Fig. 5.
a) b)
c)
Fig. 4. The magnetic X-component and riometer data: raw records (panel a), their dynamic spectra in the frequency range of 0.5–4.0 MHz (panel b) and 1–3 MHz filtered data (panel c), recorded at the IMAGE and riometer stations shown in Fig. 1.
The plot shows a sharp border at the CGM latitude of 65◦, equatorward of where the activity attenuates significantly.
4 Discussion
The activity discussed in this study can be related to the magnetospheric processes in the near-Earth region (XGSM ∼ −6 . . . − 10 RE). The magnetospheric origin of expansion phase onset arcs is known to be within the central plasma sheet (Feldstein and Galperin, 1985; Birn and Hesse, 1998), or more accurately, at the inner border of the central plasma sheet near the region of dipolarization (Ranta et al., 1977). On the other hand magnetic reconnection, which is most likely the original energy source of the expansion phase activity, takes place in the mid-tail region (XGSM∼20 RE). Consequently, variations in the reconnection process cannot directly cause the modulations in the energetic precipitation or in the magnetic pulsations. Nevertheless, reconnection can indirectly control the appearance of the pulsations, since it causes fast earthward directed plasma flows, FACs, and the dipolarization of the geomagnetic field on the earthward side of the reconnection region. FACs cause pulsations primarily
in the Pi2 range, but the breaking of the earthward directed flows in the region of quasi-dipolar field lines (Shiokawa et al., 1997) may cause lower frequency hydromagnetic waves, which can modulate the intensity of energetic particle precip-itation. Nevertheless, such interaction processes are likely to cause global effects, while our observations show a poor cor-relation between geomagnetic observations at stations whose separations are clearly less than the Pi3 wavelengths.
Breakup arcs have been shown to have their magneto-spheric origin adjacent to the energetic (30–80 keV) electron isotropic boundary (Lui and Burrows, 1978; Elphinstone et al., 1996). This means that under average conditions, ener-getic electrons should be trapped equatorward of the breakup arc. During the growth phase, however, the riometer ab-sorption usually increases in the breakup region (Pytte et al., 1976; Ranta et al., 1981). Consequently, in the corresponding magnetospheric region, some non-linear processes, probably related to the stretching of field lines to a more tail-like con-figuration, cause a randomisation in the motion of energetic electrons. For example, the cyclotron instability of trapped energetic electrons modulated by a ULF wave could cause similar oscillations in the riometer absorption, as observed in
156 N. G. Kleimenova et. al.: Riometer and magnetic Pi3 during auroral activations
09 FEB 1997 18:00-18:20 UT
19:40-20:00 UT
20:00-20:20 UT
Fig. 5. The spatial distribution of the 0.6–2.0 MHz magnetic pulsations in CGM coordinates; asterisks show the station locations.
this study. The magnetospheric inductive electric field has also been suggested to cause variations in the energetic and soft auroral precipitation (Kauristie et al., 1995). In this sce-nario, the inductive electric field would disturb the energiza-tion process of the cross-tail curvature drifting particles that
gain energy from the convection electric field (Pellinen and Heikkila, 1978, 1984). However, this model predicts a single fading of the precipitation prior to the onset rather than a se-quence of pulsations.
precipita-Fig. 6. The integrated intensity of opti-cal auroras (in arbitrary units) as a func-tion of UT in the regions of the riometer beams at IRI, IVA, and SOD.
tion with very discrete and localized structure (Weimer et al., 1994). Auroral precipitation and the related FACs can os-cillate in the frequency range of 1–4 MHz (Samson et al., 1996). Moreover, numerous observations (Wedeken et al., 1979) have indicated that substorm associated injections of energetic particle precipitation can have variations with peri-ods of 3–15 min. The oscillations of particle precipitation as-sociated with fluctuating upward FACs can enhance the con-ductivity of the ionosphere and cause periodic variations in ionospheric currents, which are observed as ground magnetic pulsations in the same frequency range. The fluctuations in the ionospheric electrojets caused by fluctuating FACs as a source of irregular geomagnetic pulsations have been dis-cussed, (by, e.g. Wilhelm et al., 1977; Nagano et al., 1981; Suzuki et al., 1981). Kleimenova et al. (1998) showed that during the evening-nighttime, the high latitude Pi3 pulsations are typically very localized in latitude and closely associated with the substorm intensification. We observed these pulsa-tions in the magnetic field and in the energetic precipitation, but their existence in the optical aurora remains without con-firmation, since the other time variations in the auroral activ-ity efficiently shield the probable pulsation-type variations.
Paquette et al. (1994) studied simultaneous riometer and magnetic pulsation events that took place during the daytime. They tested the hypothesis suggested by Coroniti and Kennel (1970) which associates the coupled magnetic and precip-itation pulsations with the ULF modulation of VLF wave-particle interactions that take place at the magnetospheric equator. In this scenario, a ground-based observer in an ap-propriate location would observe significantly the onset of riometer pulsations before the magnetic pulsations since the electron propagation time from the source region to the iono-sphere is much shorter than the Alfv´en transit time. Roughly one-third of the events of Paquette et al. were consistent with
the theory of Coroniti and Kennel. In one-third of the cases, the magnetic pulsations were observed before the precipita-tion pulsaprecipita-tions, which was most likely due to the localized nature of the riometer observations when compared to the magnetic field measurements. In the remaining third of the events, the onsets of riometer and magnetic pulsations were simultaneous. A natural way to explain such behaviour is to assume that the fluctuations in the particle precipitation mod-ulated the ionospheric conductivity and currents, and thus caused the magnetic pulsations (Heacock and Hornsucker, 1977; Rosenberg et al., 1981; Haldoupis et al., 1982). In none of our events did the onset of riometer pulsations preceed the magnetic pulsations. Thus, these events do not provide clear support for the theory of Coroniti and Kennel. At the auro-ral breakup on 18:10 UT, the onsets of the two types of pul-sations were simultaneous, which suggests that the scenario of modulating ionospheric currents would be more valid, at least for this specific case.
Profound evidence of magnetic Pi3-pulsations, generated by modulating ionospheric currents, is presented in the study of Haldoupis et al. (1982), where riometer and magnetic recordings are analysed together with the data of the STARE VHF-radar. In the radar data, pulsations with a similar fre-quency (T ∼ 3–4 min) as in the magnetic and riometer data can be seen in the backscatter intensity (which is proportional to the electron density), but not in the electric field. The authors associate the magnetic variations with ionospheric Hall-currents which vary due to the precipitation fluctua-tions. In their case, the pulsations in the riometer and mag-netic X-component were in phase, while in the events anal-ysed, here the two types of pulsations were both in phase and anti-phase: at 18:10 UT, the absorption pulsations were strongest at SOD and they were in anti-phase with the mag-netic pulsations at the same station (Fig. 4, panel c), while
158 N. G. Kleimenova et. al.: Riometer and magnetic Pi3 during auroral activations
after 20:00 UT, the absorption pulsations recorded at IRI were in phase with the TRO magnetic pulsations. Similar to the study of Haldoupis et al., the magnetic pulsations can be associated with Hall-currents and especially associated with the Hall-current vortices at the footpoints of the up-ward enhancing FACs at the auroral breakups. At 18:10 UT, SOD (OUJ) was northward (southward) of the FAC foot-point and thus the enhancements in the precipitation (cor-responding positive dB-values in Fig. 4, panel c) and in Hall-currents caused negative (positive) deviations in the X-component and consequently, the riometer and X-pulsations were in anti-phase (phase). After 20:00 UT, the magnetome-ter stations TRO, KIR, KEV were southward of the FAC footpoint and consequently, the enhancement in the Hall-current caused positive X-deviations at these stations (Fig. 4, panel a). The systematics in the pulsations, however, are not clear, e.g. the riometer pulsations recorded at IVA are in anti-phase with the X-pulsations recorded at the nearby stations KEV. Unfortunately, STARE data are not available for this day and thus we cannot check whether electric field varia-tions could explain the non-systematic behaviour.
The magnetospheric mechanism which generates the pul-sations in the energetic precipitation still remains an open question. In the model of Coroniti and Kennel (1970) for dayside activity, the basic mechanism that causes particle precipitation is the VLF wave-particle interaction process at the magnetospheric equator. In the nightside, the particle pre-cipitation is also controlled by the substorm related changes in the magnetic field configuration. When the magnetotail stretches, for example, during the substorm growth phase, particle trajectories become randomised near the equatorial place which causes precipitation. According to the present understanding, substorms can be associated with activity in two different regions: The current disruption region in the near-Earth tail and the reconnection region in the mid-tail (Baker et al., 1996; Lui, 1978). The observations analysed in this study were made in the conjugate region of the near-Earth magnetosphere and thus it is reasonable to assume that the Pi3 pulsations were related to the current disruption pro-cess.
The mechanisms of acceleration of the breakup associated with soft precipitation and energetic precipitation are differ-ent. Acceleration region processes at an ∼ 1–2 RE altitude control the distribution of soft auroral precipitation while the processes near the magnetospheric equatorial plane con-trol the appearance of energetic precipitation. The exam-ples analysed in this study, as well as the events analysed by Lazutin et al. (2000), demonstrate that the most intensive auroral brightenings and injections of energetic precipitation are coupled both spatially and temporally. The observations give the impression as if the injections of energetic particle precipitation would catalyse the build-up of field-aligned po-tential and create a drop in the acceleration region. Under-standing of the interaction process between these two sepa-rate magnetospheric regions is a challenging issue for future studies.
5 Summary and conclusions
Based on our observations, we can conclude that:
– Substorm related bursts of Pi3 geomagnetic pulsations
are very localized on the ground. and they coincid with the bursts of riometer absorption. The spectra of riome-ter and geomagnetic pulsations are similar;
– Pi3 pulsations (magnetic and riometer) are spatially and
temporally coupled with auroral breakups and upward directed field-aligned currents;
– In one of our breakup events, the onsets of riometer and
magnetic pulsations were simultaneous which leans to-wards supporting the theory that relates magnetic pul-sations to ionospheric conductivity modulations rather than the theory that suggests a common magnetospheric source region for both riometer and magnetic pulsa-tions.
Acknowledgement. The Academy of Finland supported the visits
of N. K. and O. K. to Finland. The MIRACLE network is op-erated as an international collaboration under the leadership of the Finnish Meteorological Institute. The IMAGE magnetometer data are collected as a Finnish-German-Norwegian-Polish-Russian-Swedish project.
Topical Editor G. Chanteur thanks M. Kosch and E. Nielsen for their help in evaluating this paper.
References
Akasofu, S.-I.: The Development of the Auroral Substorm, Planet. Space Sci., 12, 273–282, 1964.
Anderson, K. A. and DeWitt, R.: Space-time association of auroral grow and X-rays at balloon altitude, J. Geophys. Res., 68, 2669– 2675, 1963.
Barcus, J. R.: Balloon observations on the relationship of energetic electrons to visual aurora and auroral absorption, J. Geophys. Res., 70, 2135–2147, 1965.
Baker, D. N., Pulkkinen, T. I., Angelopoulos, V., Baumjohann, W., and McPherron, R. L.: Neutral line model of substorms: Past results and present view, J. Geophys. Res., 101, 12 975–13 010, 1996.
Birn, J. and Hesse, M.: Substorm effects in MHD and test parti-cle simulations of magnetotail dynamics, in: Substorms-4, (Eds) Kokubun, S. and Kamide, Y., Proc. International Conference on Substorms-4, Lake Hamana, Japan, Terra Scientific Publishing Company, Tokyo, 159–164, 1998.
Browne, S., Hargreaves, J. K., and Honary, B.: An imaging riometer for ionospheric studies, Electronics and Communications, 7 (5), 209–217, 1995.
Coroniti, F. V. and Kennel, C. F.: Electron precipitation pulsations, J. Geophys. Res., 75, 1279–1289, 1970.
Elphinstone, R. D., Murphree, J. S., and Cogger, L. L.: What is a Global substorm, Rev. of Geophys., 34, 169–232, 1996. Feldstein, Y. I. and Galperin, Y. I.: The auroral luminosity structure
in the high latitude upper atmosphere: Its dynamic and relation-ship to the large-scale structure of the Earth’s magnetosphere, Rev. Geophys., 59, 83–165, 1985.
Fukunishi, H.: Dynamic relationship between proton and electron auroral substorm, J. Geophys. Res., 80, 553–574, 1975. Haldoupis, C. I., Nielsen, E., Holtet, J. A., Egeland, A., and Chivers,
H. A.: Radar auroral observations during a burst of irregular magnetic pulsations, J. Geophys. Res., 87, 1541–1550, 1982. Heacock, R. R. and Hunsucker, R. D.: A study of concurrent
mag-netic field and particle precipitation pulsations 0.005 to 0.5 Hz recorded near College, Alaska, J. Atmos. Terr. Phys., 39, 487– 501, 1977.
Kauristie, K., Pulkkinen, T. I., Pellinen, R. J., Janhunen, P., Hu-uskonen, A., Viljanen, A. Opgenoorth, H. J. Heikkila, W. J., and Baker, D. N.: Analysis of the substorm trigger phase using multiple ground-based instrumentation, Geophys. Res. Lett., 22, 2065–2068, 1995.
Kiselev, B. V. and Raspopov, O. M.: Excitation of Pi3 pulsations during substorms, in: Memuars of Nation. Institute of Polar Res. No. 6. Proc. of IAGA Meeting of, Unmanned Observations in Antarctica, (Ed) Nagata, T., 88–96, 1976.
Kleimenova, N. G., Kozyreva, O. V., Bitterly, J., and Bitterly, M.: Long period (T = 8–10 min) geomagnetic pulsations at high lati-tudes, Geomagnetism and Aeronomy, 38, 436–445, 1998. Lazutin, L. L., Borovkov, L. P., Kozelova, T. V., Kornilov, I. A.,
Tagirov, V. R., Korth, A., Stadsnes, J., and Ullaland, S.: Inves-tigation of the conjugacy between auroral breakup and energetic electron injection, J. Geophys. Res., 105, 18 495–18 503, 2000. Lui, A. T. Y.: Current disruption in the Earth’s magnetosphere:
Ob-servations and models, J. Geophys. Res., 101, 13 067–13 088, 1996.
Lui, A. T. Y. and Burrows, J. R.: On the location of auroral arcs near substorm onsets, J. Geophys. Res., 83, 3342–3348, 1978. L¨uhr, H., Aylward, A., Buchert, S. C., Pajunp¨a¨a, A., Pajunp¨a¨a, K.,
Holmboe, T., and Zalewski, S. M.: Westward moving dynamic substorm features observed with the IMAGE magnetometer net-work and other ground-based instruments, Ann. Geophysicae, 16, 425–440, 1998.
McPherron, R. L., Russell, C. T., and Aubry, M. P.: Satellite studies of magnetospheric substorms on 15 August 1968, 9. Phenomeno-logical Model for Substorms, J. Geophys. Res., 78, 3131–3149, 1973.
Mersmann, U., Baumjohann, W., K¨uppers, F., and Lange, K.: Anal-ysis of an eastward electrojet by means of upward continuation of ground-based magnetometer data, J. Geophys., 45, 281–298, 1979.
Nagano, H., Suzuki, A., Kim, J. S., and Sugiura, M.: Pi3 mag-netic pulsations associated with substorms, Planet. Space Sci., 29, 529–553, 1981.
Nielsen, E., Bamber, J., Chen, Z.-S., Brekke, A., Egeland, A., Mur-phree, J. S., Venkatesan, D., and Axford, W. I.: Substorm expan-sion into the polar cap, Ann. Geophysicae, 6, 559–572, 1988. Olson, J. V.: Pi2 pulsations and substorm onsets: A review, J.
Geo-phys. Res., 104, 17 499–17 520, 1999.
Paquette, J. A., Matthews, D. L., Rosenberg, T. J., Lanzerotti, L. J., and Inan, U. S.: Source regions of long-period pulsation events in electron precipitation and magnetic fields at South Pole Station, J. Geophys. Res., 99, 3869–3877, 1994.
Pellinen, R. J. and Heikkila, W. J.: Energization of charged particles
to high energies by an induced substorm electric field within the magnetotail, J. Geophys. Res., 83, 1544–1550, 1978.
Pellinen, R. J. and Heikkila, W. J.: Inductive electric fields in the magnetotail and their relation to auroral and substorm phenom-ena, Space Sci. Rev., 37, 1–61, 1984.
Pytte, T., Trefall, H., Kremser, G., Jalonen, L., Riedler, W.: On the morphology of energetic (> 30 keV) electron precipitation dur-ing the growth phase of magnetospheric substorms, J. Atmos. Terr. Phys., 38, 739–755, 1976.
Ranta, A. and Ranta, H.: Satellite and Ground Observations of a Pre-Substorm Phase on 4 May 1977, J. Geophys. Res., 88, 4097– 4104, 1983.
Ranta, H., Ranta, A., Collis, P. N., and Hargreaves, J. K.: De-velopment of the auroral absorption substorm: Studies of pre-onset phase and sharp pre-onset using an extensive riometer network, Planet. Space Sci., 29, 1287–1313, 1981.
Raspopov, O. M., Kiselev, B. V., Roldugin, V. K., and Ghernous, S. A.: Polar irregular pulsations PiP, IAGA Bulletin, 34, 432, 1973. Rosenberg, T. J., Morris, P. B., and Lanzerotti, L. J.: Excitation of magnetospheric hydromagnetic waves by solar-flare induced change in ionospheric conductivity, Phys. Rev. Lett., 47, 1343– 1346, 1981.
Saito, T.: Long-period irregular magnetic pulsations Pi3, Space. Sci. Rev., 21, 427–467, 1978.
Samson, J. C., Cogger, L. L., and Pao, Q.: Observations of field line resonances, auroral arcs, and auroral vortex structures, J. Geo-phys. Res., 101, 17 373–17 383, 1996.
Shiokawa K., Baumjohann, W., and Haerendel, G.: Braking of high-speed flows in the near-Earth tail, Geophys. Res. Lett., 24, 1179–1182, 1997.
Stuart, W. F., Green, C. A., and Harris, T. J.: Correlations between modulations of the intensity of precipitating electrons in the au-roral zone and coincident Pi2, J. Atmos. Terr. Phys., 39, 631–635, 1977.
Suzuki, A., Nagano, H., Kim, J. S., and Sagiura, M.: A statistical study on characteristics of high latitude Pi3 pulsations, J. Geo-phys. Res., 86, 1345–1354, 1981.
Syrj¨asuo, M. T., Pulkkinen, T. I., Janhunen, P., Viljanen, A., Pelli-nen, R. J., Kauristie, K., Opgenoorth, H. J., Wallman, S., Eglitis, P., Karlsson, P., Amm, O., Nielsen, E., and Thomas, C.: Obser-vations of substorm electrodynamics using the MIRACLE net-work, in: Substorms-4, (Eds) Kokubun, S. and Kamide, Y., Proc. International Conference on Substorms-4, Lake Hamana, Japan, Terra Scientific Publishing Company, Tokyo, 111–114, 1998. Wedeken, U., Hillebrand, O., Krenzien, E., Ranta, A., Ranta, H.,
and Voelker, H.: Cosmic noise absorption events and magnetic pulsations activity during substorms, J. Geophys. Res., 46, 249– 259, 1979.
Weimer, D. R., Craven, J. D., Frank, L. A., Hanson, W. B., May-nard, N. C., Hoffman, R. A., and Slavin, J. A.: Satellite measure-ments through the center of substorm surge, J. Geophys. Res., 99, 23 639–23 649, 1994.
Wilhelm, K., Munch, J. W., and Kremser, G.: Fluctuations of the auroral zone current system and geomagnetic pulsations, J. Geo-phys. Res., 82, 2705–2716, 1977.