HAL Id: hal-03101863
https://hal.archives-ouvertes.fr/hal-03101863
Submitted on 11 Jan 2021
HAL is a multi-disciplinary open access
archive for the deposit and dissemination of
sci-entific research documents, whether they are
pub-lished or not. The documents may come from
teaching and research institutions in France or
abroad, or from public or private research centers.
L’archive ouverte pluridisciplinaire HAL, est
destinée au dépôt et à la diffusion de documents
scientifiques de niveau recherche, publiés ou non,
émanant des établissements d’enseignement et de
recherche français ou étrangers, des laboratoires
publics ou privés.
Christelle Cayrou, Benoit Ballester, Isabelle Peiffer, Romain Fenouil, Philippe
Coulombe, Jean-Christophe Andrau, Jacques van Helden, Marcel Méchali
To cite this version:
Christelle Cayrou, Benoit Ballester, Isabelle Peiffer, Romain Fenouil, Philippe Coulombe, et al.. The
chromatin environment shapes DNA replication origin organization and defines origin classes. Genome
Research, Cold Spring Harbor Laboratory Press, 2015, 25 (12), pp.1873-1885. �10.1101/gr.192799.115�.
�hal-03101863�
The chromatin environment shapes DNA replication
origin organization and defines origin classes
Christelle Cayrou,
1,5,8Benoit Ballester,
2,3,5Isabelle Peiffer,
1Romain Fenouil,
4,6Philippe Coulombe,
1Jean-Christophe Andrau,
4,7Jacques van Helden,
2,3and Marcel Méchali
11
Institute of Human Genetics, CNRS, 34396 Montpellier, France;
2INSERM, U1090 TAGC, Marseille F-13288, France;
3Aix Marseille University, U1090 TAGC, Marseille F-13288, France;
4Centre d
’Immunologie de Marseille-Luminy (CIML),
13009 Marseille, France
To unveil the still-elusive nature of metazoan replication origins, we identified them genome-wide and at unprecedented
high-resolution in mouse ES cells. This allowed initiation sites (IS) and initiation zones (IZ) to be differentiated. We then
char-acterized their genetic signatures and organization and integrated these data with 43 chromatin marks and factors. Our
re-sults reveal that replication origins can be grouped into three main classes with distinct organization, chromatin
environment, and sequence motifs. Class 1 contains relatively isolated, low-efficiency origins that are poor in epigenetic
marks and are enriched in an asymmetric AC repeat at the initiation site. Late origins are mainly found in this class.
Class 2 origins are particularly rich in enhancer elements. Class 3 origins are the most efficient and are associated with
open chromatin and polycomb protein-enriched regions. The presence of Origin G-rich Repeated elements (OGRE)
poten-tially forming G-quadruplexes (G4) was confirmed at most origins. These coincide with nucleosome-depleted regions
locat-ed upstream of the initiation sites, which are associatlocat-ed with a labile nucleosome containing H3K64ac. These data
demonstrate that specific chromatin landscapes and combinations of specific signatures regulate origin localization. They
explain the frequently observed links between DNA replication and transcription. They also emphasize the plasticity of
metazoan replication origins and suggest that in multicellular eukaryotes, the combination of distinct genetic features
and chromatin configurations act in synergy to define and adapt the origin profile.
[Supplemental material is available for this article.]
In metazoans, DNA replication initiates at thousands of specific sites called DNA replication origins that are activated in a defined temporal order during each cell cycle (for review, see DePamphilis 1993; Aladjem 2007; Fragkos et al. 2015). No clear sequence speci-ficity for origins has been found in multicellular organisms, but in Saccharomyces cerevisiae initiation sites (IS) are defined by an AT-rich consensus sequence (Marahrens and Stillman 1992). Conversely, recent analyses revealed the presence of GC-rich ele-ments in eukaryotic origins, such as CpG islands (CGI) (Delgado et al. 1998; Prioleau 2009; Cayrou et al. 2011; Costas et al. 2011) and an Origin G-rich Repeated Element (OGRE) that can form G4 (Cayrou et al. 2011, 2012a). G4 were further detected in human origins (Besnard et al. 2012), where they might have a role in rep-lication initiation (Valton et al. 2014).
Many potential origins are set before the S phase, but few are activated in a given cell cycle. Furthermore, some origins are activated only in specific developmental or environmental con-ditions, suggesting flexibility in their recognition or usage (DePamphilis 1993; Aladjem 2007; Nordman and Orr-Weaver 2012; Fragkos et al. 2015). Also, the timing of their activation
dur-ing the cell cycle is flexible (Rhind and Gilbert 2013). More recent-ly, the importance of the replication timing program variability in the genetic variations between individuals was underlined (Koren et al. 2014). However, these studies did not investigate replication origin positioning and organization along chromosomes. The chromatin environment may contribute to the flexibility in the choice of the origins to be activated as suggested by the presence of histone modifications at origins. However, a comprehensive “identity code” that could explain this flexibility and that takes into account the genetic and epigenetic signatures of origins ge-nome-wide is still missing in vertebrates. This lack of basic knowl-edge in a crucial cellular mechanism hinders our understanding of the chromosome organization and probably of many diseases caused by unfaithful or illegitimate replication.
Here, we coupled purification of RNA-primed nascent DNA at origins with next-generation sequencing to identify consensus or cooperative genetic and chromatin features of origins in mouse embryonic stem cells (mESCs). Our results allow building a com-prehensive landscape of the prereplication complex (pre-RC) and IS at origins and might help understanding how origin selection may adapt to different chromosome organizations linked to differ-ent cell behaviors.
5
These authors contributed equally to this work.
Present addresses:6Mount Sinai Hospital, New York, NY 10029-6574, USA; 7Institute of Molecular Genetics, CNRS-UMR 5535, 34293 Montpellier, France;8Institute for Research on Cancer and Aging, Nice (IRCAN), CNRS UMR 7284, 06107 Nice, France
Corresponding authors: [email protected], Jacques.van-Helden@ univ-amu.fr
Article published online before print. Article, supplemental material, and publi-cation date are at http://www.genome.org/cgi/doi/10.1101/gr.192799.115.
© 2015 Cayrou et al. This article is distributed exclusively by Cold Spring Harbor Laboratory Press for the first six months after the full-issue publication date (see http://genome.cshlp.org/site/misc/terms.xhtml). After six months, it is available under a Creative Commons License (Attribution-NonCommercial 4.0 International), as described at http://creativecommons.org/licenses/by-nc/ 4.0/.
Research
Cold Spring Harbor Laboratory Press on January 11, 2021 - Published by
genome.cshlp.org Downloaded from
Results
Origin maps reveal three different classes of origins defined
by structural and functional genomic features
For genome-wide mapping of origins in mESCs, we coupled Nascent Strand (NS) purification with high-throughput sequenc-ing (Supplemental Fig. S1A; Methods). In this approach, RNA-primed nascent DNA is first purified from replication origins, and then contaminated DNA is removed by lambda exonuclease (λ-Exo) digestion. We already described this method in detail (Cayrou et al. 2011, 2012b) and showed that it gives accurate and very reliable results, providing that the crucialλ-Exo digestion is performed in optimal conditions (Supplemental Figs. S1, S2; Cayrou et al. 2011; Li et al. 2014; Picard et al. 2014). For high-res-olution analysis, we sequenced three independent NS samples (Supplemental Fig. S1C) and also an RNase A-treated NS sample for peak calling analyses (Supplemental Fig. S1B,C), which is an appropriate background control used in these experiments. Supplemental Figure S1C shows the data reproducibility and the low background obtained with sheared genomic DNA and the RNase A-digested NS sample before incubation with λ-Exo. Supplemental Figure S2 demonstrates that the presence of G4 in the sequence did not affectλ-Exo digestion in our conditions.
We combined two complementary software tools to detect origins. SICER identifies wide genomic zones enriched in reads, whereas SWEMBL highlights the precise position of peaks (Supplemental Fig. S1D; Methods). This joint analysis returned 65,019 high-confidence peaks that identified the major IS of DNA replication and 35,512 initiation zones (IZ) that encom-passed one or several closely associated IS. Most origins contained one (60%) or two IS (22%) (Supplemental Fig. S1D). Therefore, an origin can correspond to a single IS or to an IZ, as previously de-scribed for the Lamin B2 (Abdurashidova et al. 2000) and DHFR or-igins (Kobayashi et al. 1998; Wang et al. 1998). Our new high resolution data are recapitulated by 80.2% of our previous data ob-tained on microarrays on mouse Chromosome 11 (Supplemental Fig. S1E; Cayrou et al. 2011).
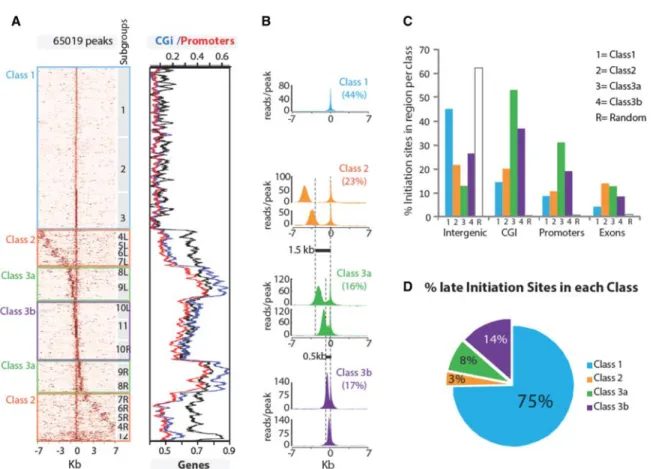
We first investigated how origins are arranged in the genome. Our previous findings, based on microarray and DNA combing analysis of Chromosome 11 in mESCs, suggest that, on average, replication units cover 53 kb and contain four potential origins with an inter-origin spacing of 12.2 kb (Cayrou et al. 2011). Therefore, we analyzed the read density profiles in a 14-kb window, 7 kb each side of the 65,019 IS. Alternative window sizes did not give more substantial information (Methods). Based on k-means clustering of read densities in the 14-kb regions, we defined 12 IS subgroups. By sorting these subgroups according to the IS distance to the neighboring peak, we obtained a striking sigmoid-shaped profile (heatmap in Fig. 1A, left). We next annotated each IS rela-tive to the presence of different genomic features (Fig. 1A, right): genes, promoters (1 kb upstream), and CGI. Based on the combina-tion of read density profiles and genomic features, we could assem-ble the 12 IS subgroups in three qualitatively distinct IS classes (Fig. 1B) that correlated with specific genomic features (Fig. 1C).
Class 1 was characterized by narrow and isolated peaks and included 44% of all IS. The three Class 1 subgroups (1, 2, and 3) (Fig. 1A, left) only differed by the IS strength. The two other origin classes, which formed the sigmoid-shaped profile, contained at least two major IS in the 14-kb window. We detected clear bound-aries between subgroups 7 and 8 (Class 2/3a boundary) and be-tween subgroups 9 and 10 (Class 3a/3b boundary). Class 2 and
Class 3 were defined both by the drastic changes observed in the diagonal slope of read densities and by the associated genomic fea-tures. Class 2, 3a, and 3b profiles were arranged symmetrically with pairs of similarly spaced neighboring peaks appearing twice in the graph: once centered on the leftmost peak and once on the right-most peak (for instance, 4L and 4R subgroups) (Fig. 1A, left).
To evaluate the significance of this arrangement, we used the same in silico procedure to analyze 65,019 randomly selected 14-kb regions in the mouse genome (negative control) (Supplemental Fig. S3A). Most random fragments (n = 47,520) fell within IS-free regions or had no clear peak, and the high-density bins were re-stricted to a single peak per region (no secondary peak like for Classes 2, 3a, and 3b). These results validated the relevance of the topological features observed across Classes 2, 3a, and 3b.
This structural repartition correlated with specific genomic features. Class 1 IS were uniformly distributed along chromosomes (Supplemental Fig. S3B). As with all IS, Class 1 IS were more fre-quent in CGI-, promoter-, or gene-rich regions (P-value = 0) (Fig. 1C; Supplemental Table S1) than in randomly selected regions of the same size. However, they were poorly enriched at CpGi-, promoter-, or gene-rich regions relative to the other classes (Fig. 1C; Supplemental Table S1). Moreover, Class 1 included 75% of all late origins (Fig. 1D; Supplemental Fig. S3B), suggesting that late-replicated regions are essentially composed of thin and iso-lated origins. In contrast, the other two classes, which consisted of grouped IS, included mainly early origins and were more con-centrated in regions rich in genes, promoters, and CGI. Indeed, Class 2 origins were more frequently positioned within genes, pref-erentially inside exons and introns (P-value = 7.9 × 10−141 and 8.65 × 10−53, respectively) (Fig. 1C). Like Class 1, Class 2 origins contained relatively inefficient IS (based on the density of reads/ peak) (Fig. 1B), suggesting more flexibility in the choice of IS with-in these regions. Class 3 was characterized by two strong IS (mean density above 106 reads/peak versus 74 in Class 1), separated by <1.5 kb (Fig. 1B). It included 60% of the strongest IS, and 68% of origins associated with a promoter belonged to Class 3 (data not shown). This class was more likely to be associated with orphan CGI-type (Fenouil et al. 2012) and/or cryptic promoters than only with known promoters. Indeed, although it was significantly associated with promoters (25% of these IS; P-value <5.5 × 10−47) (Supplemental Table S1), more than 45% of Class 3 IS overlapped with a CGI. Moreover, Class 3 represented the vast majority of CGI-positive origins (58%). Reciprocally, CGI are likely good ori-gin predictors as 75% of them overlapped with an IZ and 60% were specifically located on the IS.
These results reveal the existence of distinct classes of origins based on their different structural patterns and their association with specific genomic features.
Efficient replication initiation sites are prominent in open
chromatin domains and facultative heterochromatin
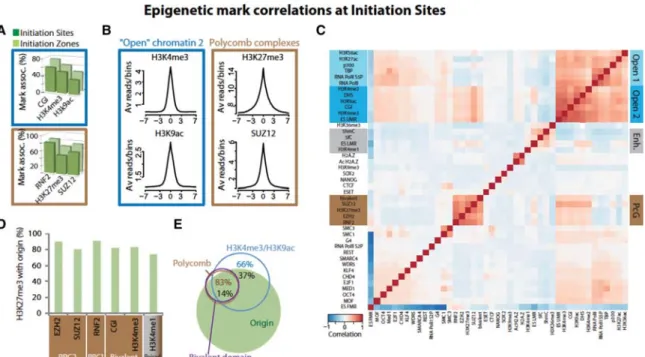
To determine whether IS and IZ have a specific chromatin environ-ment, we integrated 43 known marks/factors from published data on mESCs (Supplemental Table S1; Methods). Open chromatin-2 marks (i.e., marks linked to decondensed chromatin) were detected similarly in IS and IZ, indicating strict positioning on the IS inside the IZ (Fig. 2A, upper; Supplemental Fig. S4A–C; Supplemental Table S1). These marks included not only promoter-specific marks, such as H3K4me3, but also marks that are not strictly promoter-specific, such as H3K9ac and DNase I hypersensitive sites (DHS). Open chromatin marks were present at nearly half of the
promoters and 5′UTRs, but they were two- to threefold enriched when origins were also present in these regions (Supplemental Fig. S4D). A similar overrepresentation was observed in intronic and exonic regions that contained origins. In contrast to the asso-ciation of origins with open chromatin marks, constitutive closed heterochromatin marks, such as H3K9me3, were poorly represent-ed at origins (only 0.8% of IS). The high and sharp profile observrepresent-ed for H3K4me3 and H3K9ac at the IS center suggested a role in origin activation (Fig. 2C, left).
We then compared the correlation between the position of these marks and that of IS (Fig. 2C) and of 1000 randomized sets of 65,019 regions. Open chromatin marks correlated more positive-ly within IS than in randompositive-ly chosen genomic regions (Z-score for the correlation of each pair of marks in IS) (Supplemental Fig. S5A versus Supplemental Fig. S5C), with a strong confidence (Z-score >10). Notably, DHS (the most abundant open chromatin marks at origins: 49% of IS and 65% of IZ) (Supplemental Table S1) showed the highest correlations with IS (Z-score >14) (Supplemen-tal Fig. S5E), suggesting the presence of a nucleosome-depleted re-gion (NDR) as one of the main features of origins. DNase I sensitive sites were also the main determinants of DNA replication timing
(Gindin et al. 2014). Moreover, 66% of the regions containing both H3K4me3 and H3K9ac could detect 32% of origins (Fig. 2E). Less expected was the strong association of IS and IZ with marks/factors related to Polycomb (PcG) complexes (P-value = 0) (Fig. 2A, bottom; Supplemental Fig. S4A, B, left; Supplemental Table S1) that showed a distinct peak centered on the IS (Fig. 2B, right). PcG proteins are involved in gene silencing and form large complexes (PRC1 and PRC2) that can modify chromatin, notably by H3K27me3 deposition. Remarkably, PcG subunits were much more associated with origins than H3K27me3, the major PcG mark (Fig. 2D). Indeed, origins contained >80% of RNF2 binding sites (PRC1 subunit), 75% of SUZ12 binding sites (PRC2 subunit), and 90% of EZH2 sites (the PRC2 catalytic subunit) (Supplemental Fig. S4B, left). Finally, H3K27me3 distribution overlapped with that of H3K4me3 (Fig. 2D), shaping bivalent domains, which regulate transcriptional poising of developmentally regulated genes. As well as PRC1 and PRC2 sites, bivalent domains are strongly associated with origins in pluripotent mESCs (Bernstein et al. 2006). Therefore, PcG factors and open chromatin marks could play a synergic role in the choice of some origins in plurip-otent cells (Fig. 2E).
Figure 1. Three classes of replication origins. (A) Clustering of origins based on read densities around peaks. The left panel displays a heatmap of read densities in 7-kb regions on each side of the peak summit. It shows how an IS is positioned relative to its neighbors and indicates the signal strength (number of reads) and density at each IS. The brown intensity is proportional to the read counts per 100-bp bins. The numbers on the right of the heatmap indicate groups obtained by k-means clustering, and the left/right symmetry between cluster pairs is denoted by identical numbers followed by the L and R suffixes. The three classes of origins defined in the text are highlighted in boxes. The right panel indicates the overlap of IS (± 500 bp from the summit) with CpG islands (blue), promoters (red), and genes (black). (B) Read density mean profiles per class of origins. Each class is defined by assembling groups of IS char-acterized by a specific distance (dotted vertical lines) between two major IS, except for Class 1 origins, which have a single IS within a 14-kb region. The y-axis represents the average number of reads per peak. Class 1 profile is represented by subgroup 1; Class 2 by subgroups 5LR, 6LR; Class 3a by subgroups 8LR, 9LR; and Class 3b by 10LR, 11. (C ) Genomic localization of origins. For each class, the bar plot indicates the proportion of IS associated with intergenic, CGi, promoters, and exons. (D) Distribution of late origins per class. The percentage of IS overlapping with the late-replicating regions defined in Hiratani et al. (2008) (Supplemental Table S1) is indicated for each class.
Replication origin signatures and organization
Cold Spring Harbor Laboratory Presson January 11, 2021 - Published by genome.cshlp.org
Replication initiation zones are frequent in transcriptionally
active domains
Conversely to IS, IZ were associated with marks/factors linked to transcription activity regulation that we define as open chroma-tin-1. Sites in which RNA Pol II and the active mark H3K27ac overlapped were more frequently found at IZ (Fig. 3A, upper; Supplemental Fig. S4B, right; Supplemental Fig. S4C), as indicated by the broad peaks centered on the IS (Fig. 3B, left). Interestingly, the IS strength positively correlated with the presence of RNA Pol II and DHS (148 and 132 reads/peak respectively, compared to 97 reads/peak for all IS), suggesting that replication initiation is fa-vored in proximity of the transcription machinery. The superposi-tion of the “paused” form of RNA Pol II (inhibition of RNA Pol II initiation by flavopiridol) with global RNA Pol II at origins (Supplemental Fig. S6) suggests that transcriptional pausing (Adelman and Lis 2012) favors a chromatin structure more suitable to origin positioning or activation.
In addition to promoters, RNA Pol II and H3K27ac were also present at enhancers that are currently defined by H3K4me1 occu-pancy (Creyghton et al. 2010). In contrast to open chromatin marks, enhancer marks were specifically enriched at IZ compared with IS, as illustrated by the wide and bimodal profile of 5-hydrox-ymethylcytosine (5hmC) and especially of H3K4me1 around the IS (Fig. 3B,D), a characteristic profile found also at promoters and enhancers (Koch et al. 2011). More than 51% of IZ contained at least one enhancer mark, and H3K4me1 alone determined 46% of all IZ (Supplemental Table S1; Fig. 3A, lower).
Enhancers can be characterized according to the levels of colocalization of H3K4me1 with H3K27ac/H3K9ac (active
en-hancers) or H3K27me3 (poised enen-hancers) (Creyghton et al. 2010; Rada-Iglesias et al. 2011). Surprisingly, we observed a sig-nificant correlation of IZ with poised enhancers, but not with ac-tive enhancers (Z-score >4.3 versus ≤1, respectively) (Fig. 3D; Supplemental Fig. S5B,D). However, this did not necessarily in-volve the presence of PcG proteins. These results suggest a cooper-ative activity of H3K4me1 and H3K27me3 to allow a chromatin environment suitable to initiate replication in some enhancer re-gions. Finally, the highest correlations in IZ included G4, in agree-ment with our previous work (Cayrou et al. 2012a). G4 clearly were the most frequent marks at IZ (79% of IZ) (Supplemental Table S1), and 47% of the regions containing enhancer marks and G4 pre-dicted one-third of all origins (Fig. 3E).
Altogether, these findings suggest that epigenetic signatures and DNA structure/sequences specifically associated with active regulatory regions favor the IS choice within transcriptionally ac-tive domains.
The three main origin classes are defined by specific
chromatin environments
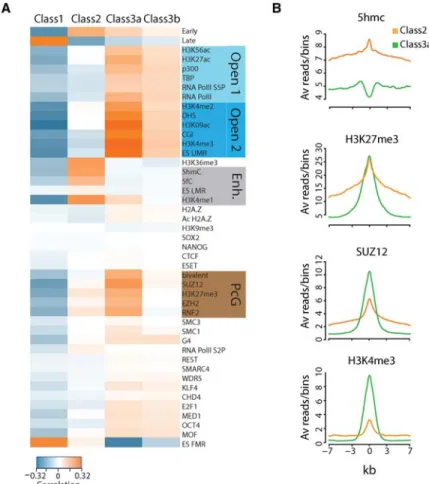
Considering the different chromatin signatures found at origins, we then asked whether the three classes of origins were associated with specific sets of chromatin signatures. Class 1 is clearly very different from the two other classes; it is particularly poor in epige-netic marks, with only two positive correlations with the silenced chromatin marks H3K9me3 and fully methylated regions (ES FMR) (Fig. 4A; Stadler et al. 2011). This is consistent with the weaker link of this class with gene-rich regions and the finding that Class 1 in-cludes mainly late replication origins.
Figure 2. Epigenetic marks and chromatin environment at IS. (A,B) Specific chromatin marks/factors associated with open chromatin-2 (blue boxes) and Polycomb complexes (brown boxes) at initiation sites. (A) Distribution of chromatin marks/factors relative to IS (dark green) and IZ (light green). (B) ChIP-seq signals for H3K4me3, H3K9ac, H3K27me3, and SUZ12 around ±7 kb from IS. (C ) Hierarchical clustering of Pearson correlations between pairs of marks and/or chromatin factors for all IS. Marks and factors in the heatmap are organized according to the clustering described in Methods. Positive correlations are symbolized by a gradation of red that results from the localization of pairs of marks/factors at individual IS. Negative correlations are symbolized by a gradation of blue. Four significant groups of chromatin mark/factor are highlighted on the right: Open 1 chromatin marks/factors group (mostly associated with transcription initiation); Open 2 chromatin marks group (globally linked to decondensed chromatin); Enhancer marks (Enh.); and Polycomb group mark/factors (PcG). (D) More than 80% of H3K27me3 marks at IZ are associated with PRC1 or PRC2 proteins or are inside bivalent domains. (E) Overlap between marks/factors and origins.
Conversely, the other two classes are strongly associated with specific sets of chromatin marks. Class 2 exhibited weak correla-tions with open chromatin marks, but is the only class positively correlated with enhancer marks. Its enrichment in H3K4me1 (60% of IS) and 5hmC (45% of IS) (Supplemental Table S1) is also correlated with H3K36me3, suggesting a selection for enhanc-ers inside active genes. We also found a broad and strong H3K27me3 enrichment in this class (Fig. 4B), in agreement with the detected connection with poised enhancers.
Class 3a origins have the strongest associations with open chromatin-2 marks, such as DHS, H3K9ac, and H3K4me3 (79%, 75%, and 66% of IS, respectively), and with open chromatin-1 marks/factors (Fig. 5A). Class 3a also includes many PcG-positive origins (37% of Class 3a IS were associated with SUZ12 binding sites), particularly those correlated with bivalent domains (correla-tion of 0.18 for Class 3a versus−0.02 for Class 2), in agreement with the H3K27me3 and SUZ12 enrichment at the peak center (Fig. 5B). Class 3b origins have a similar epigenetic profile, but less pronounced than in Class 3a origins.
These data highlight that the different origin classes, first defined in this study based on their structural patterns (Fig. 1A), are also characterized by specific chromatin features.
The G-rich motif is similarly distributed at origins of mouse
and human ES cells
Genetic signatures at origins have remained elusive in multicellu-lar organisms. We previously identified an Origin G-rich Repeated Element (OGRE) that is overrepresented upstream of the IS in mouse Chromosome 11 origins (Cayrou et al. 2011). We thus asked whether this motif was similarly distributed in this
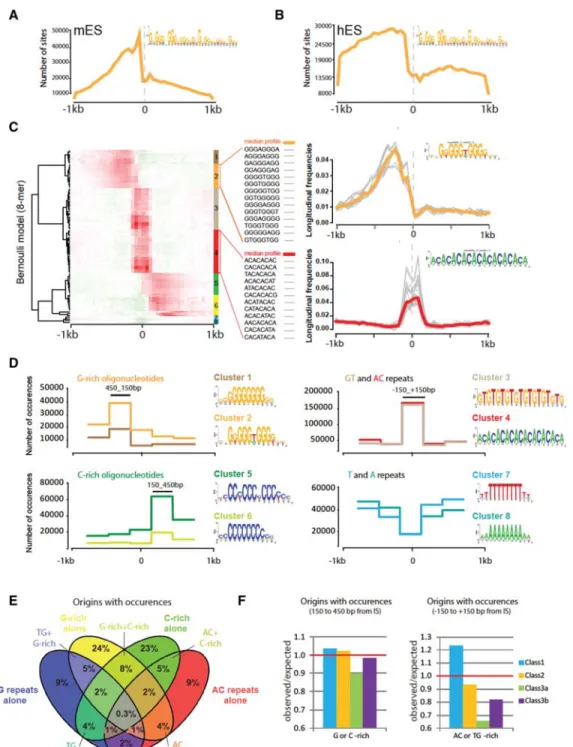
higher-resolution map of mESC origins. To account for the motif strand orientation, we scanned separately the Watson and Crick DNA strands and obtained symmetrical and consistent results. Analysis of the mESC sequencing data highlighted two close peaks of OGRE enrichment, located∼225 and 75 bp upstream of the IS (Fig. 5A). Then, to determine whether OGRE occur also at IS of hu-man ESCs (hESCs), we reanalyzed the raw data from Besnard et al. (2012) and for consistency applied the bioinformatics workflow used for mESC origin mapping. Because Besnard et al. (2012) did not include an experimental negative control, we sequenced frag-mented genomic DNA from the same hESC line and subtracted the obtained values from the Besnard et al. (2012) data. The original article reported 250,000 origins in hESCs, but with our more strin-gent procedure, we found 149,791 potential IS that were contained in 30,056 IZ. This is similar to the result of a recent independent reanalysis of these data (Picard et al. 2014). We detected an OGRE motif upstream of human origins, and its occurrence distri-bution abruptly dropped at the precise location of the IS (Fig. 5B). The G-rich zone was wider in human (∼1 kb) than in mouse sam-ples (<500 bp), consistent with the broader (6 kb in human versus 2.3 kb on average for mouse origins) and multi-IS composition (50% of origins have three or more IS) of hESC origins. We con-clude that hESC origins also contain an oriented OGRE motif, like mESC origins.
Initiation sites are characterized by specific
oligonucleotide profiles
Our previous analyses (Cayrou et al. 2011) relied on a generic motif discovery tool (MEME) (Bailey et al. 2015), based on the detec-tion of overrepresented motifs. We extended this analysis by Figure 3. Epigenetic marks and chromatin factors at IZ. (A,B) Specific chromatin marks/factors associated with open chromatin-1 (light blue boxes) and enhancers (gray boxes) at initiation zones. (A) Distribution of chromatin marks/factors relative to IS (dark green) and IZ (light green). (B) ChIP-seq signals for H3K27ac, RNA Pol II, H3K4me1, and 5hmC around ±7 kb from the IS. (C ) Hierarchical clustering of Pearson correlations between pairs of marks and/or chromatin factors at IZ. Marks and factors in the heatmap are ordered according to the clustering performed for the IS (see Fig. 2C). Positive correlations between pairs of marks/factors in individual IZ regions are symbolized by a gradation of red. Negative correlations are symbolized by a gradation of blue. (D) Percent overlap between poised (H3K4me1/H3K27me3) and active (H3K4me1/H3K27ac) enhancers within IZ. (E) Overlap between marks/factors and origins.
Replication origin signatures and organization
Cold Spring Harbor Laboratory Presson January 11, 2021 - Published by genome.cshlp.org
characterizing the positional distribution profile of each oligonu-cleotide (“k-mer”) around the IS. We used the RSAT position-anal-ysis program (van Helden et al. 2000) to count the occurrences of all k-mers (from 1 to 8 b) in non-overlapping windows (50 bp) from−1 to +1 kb relative to the IS summits, according to the Watson and Crick strand. Observed occurrences were compared with the random expectation using aχ2test. Significant k-mers
were clustered according to their position profiles (Fig. 5C). k-mer clusters were further assembled and used as seeds to extract motifs (sequence logos) (Fig. 5D). The following analysis focused on 8-mer oligonucleotides, but the analysis of smaller k-mers gave comparable results (see supporting website).
The density heatmap (Fig. 5C) revealed groups of 8-mer oligo-nucleotides with highly significant positional biases around the IS. The first group was composed of G-rich 8-mer sequences (Supplemental Table S2) that showed a strong enrichment 225 bp on the left side of the summits on the Watson strand. This group could be further subdivided in two clusters (1 and 2 in Fig. 5C) composed of related, but distinct oligonucleotides. The posi-tional profiles of these G-rich oligonucleotides (Fig. 5C, upper right) were in line with those described for the OGRE motif. As Watson and Crick strands were considered separately, the left-side enrichment in G repeats and the right-left-side enrichment in
C repeats showed two symmetrical views of the same phenomenon: the enrich-ment for G-rich sequences on the 5′side of the IS. We also detected highly significant oligonucleotide motifs cen-tered on the IS, all related to the poorly complex 8-mer ACACACAC sequence (Fig. 5D, cluster 3) or its reverse comple-ment TGTGTGTG (cluster 4). Finally, the analysis of positional biases also re-vealed a strong avoidance of poly-T and poly-A oligonucleotides at IS (clusters 7 and 8, respectively).
Based on the heatmap, we identi-fied two well-separated regions around the IS. The region between 450 and 150 bp from the IS was enriched in G-rich repeats on the left of the IS (Fig. 5C,D, clusters 1 and 2) and in C-rich repeats on the right of the IS (clusters 5 and 6). Conversely, the central region (between −150 and +150 bp) contained more TG and AC repeats (clusters 3 and 4). We then counted the occurrences of each oligonucleotide in 300-bp-wide slices corresponding to these regions and com-puted the sum of occurrences per slice for each oligonucleotide cluster. We ana-lyzed the combinations of these signals in individual peaks and found that 71% of origins displayed one or more TG and/or AC occurrence profiles and that 80% of them featured G- or C-rich oligo-nucleotides. Among these oligonucleo-tide-positive origins, a large part (66%) contained only one of the four oligonu-cleotide groups. These origins had either G-rich occurrences upstream or C-rich occurrences downstream, and only 12% had both (Fig. 5E). This subdivision was also true for the TG and AC repeats because only 4% of positive origins had a combined profile. The presence of G- or C-rich occurrences upstream of the IS did not exclude the occurrence of TG and AC repeats at the IS. However, only 25% of positive origins had both (P-value <0.0001), suggesting a specialization of G/C-rich oligonucleotides and of AC/TG repeats in the determination of different origin types.
We then asked whether specific sequence profiles were asso-ciated with the different classes of origins (Fig. 5F). G- or C-rich oc-currences were not restricted to a particular class. Conversely, AC and TG repeats were clearly overrepresented in Class 1 origins. This result suggests that Class 1 origins, which are poor in epige-netic marks, are more associated with specific sequences than the other classes. In contrast, Class 3a origins, which are rich in chromatin marks, showed the lowest abundance of each oligonu-cleotide group (Fig. 5F). Consistently, the number of occurrences per origin decreased rapidly with the gain in chromatin marks (Supplemental Fig. S7). This observation was true for all chromatin marks associated with origins described in Figure 3. The overrepre-sentation of AC and TG repeats in Class 1 origins could contribute to specify replication initiation inside genomic regions devoid of chromatin marks.
Figure 4. Origin classes are linked to specific chromatin signatures. (A) Association of chromatin marks/ factors within each class. Pearson correlation between pairs of chromatin marks/factors for all IS in each class. Class 1 IS (n = 28,443) are correlated with closed chromatin marks and anticorrelated with all other marks/factors. Class 2 IS (n = 14,873) are the only IS positively correlated with enhancer features (Enh.), whereas Class 3a and 3b IS (n = 10,547) are associated with Open 2 and Polycomb group (PcG) chroma-tin marks/factors. (B) ChIP-seq signals for 5hmC, H3K27me3, SUZ12, and H3K4me3 around ±7 kb from the center of Class 2 and Class 3a IS.
Figure 5. Sequence motifs at origins. (A,B) Distribution of OGRE sites around IS in mouse (A) and human (B) ES cells. PWM-based scanning of 1-kb regions on both sides of origin summits to detect OGRE motif instances. The x-axis indicates the position relative to the origin summit, the y-axis the number of predicted OGRE sites per 50-bp window, for the 65,019 mouse origins (A), and 149,791 human origins (B), respectively. (C ) Clustering of oligonucleotide occurrence profiles. The left panel shows the hierarchical clustering of positional profiles of 8-mer occurrences in 50-bp non-overlapping windows over 1 kb on each side of peak summits. Each row corresponds to one specific k-mer. The color scale indicates the per k-mer normalized frequency. Local over- or underrepresentation is denoted by red or green hues, respectively. The right panels show detailed examples of individual position profiles for two clusters of k-mers. Colored bold lines represent the median profile of normalized frequencies for the entire cluster. The inset sequence logos were built by scanning sequences with matrices resulting from k-mer assemblies. (D) Profiles of origin-associated motifs. Distribution profiles of origin-associated motifs, obtained by scanning origin regions with the matrices identified in the previous step (C ). The y-axis indicates the number of motif occurrences within each bin (300 bp). We combined all profiles in four different groups (G-rich, C-rich, GT/AC, and T/A). Sequence logos of the origin-associated motifs are displayed beside the corresponding profiles. (E) Proportion of origins with the representative motifs. Each origin containing at least one occurrence of the motif represen-tative of each group is reported. The occurrence must be within the most enriched part within the origin (e.g., between +150 and +450 bp from the IS for cluster 2). (F ) Proportion of origins positive for a specific motif per class. Origins containing at least one of the representative 8-mers are assigned according to their class. G/C-rich motif-positive origins are in Class 1, 2, and 3a/b (left), whereas origins enriched in AC or TG repeats are mainly in Class 1 (right).
Replication origin signatures and organization
Cold Spring Harbor Laboratory Presson January 11, 2021 - Published by genome.cshlp.org
A labile nucleosome is positioned at replication
initiation sites
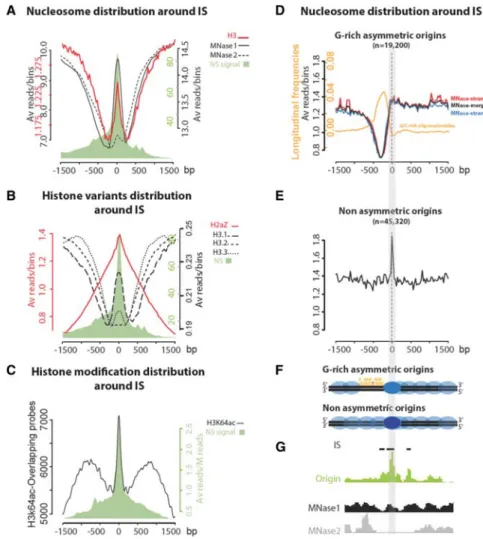
To assess nucleosome density at IS, we used two different data sets obtained by micrococcal nuclease digestion followed by sequenc-ing (MNase-seq): MNase 1 (Fenouil et al. 2012) and MNase 2 (Fig. 6A, solid and dotted black lines, respectively; Teif et al. 2012). We
observed a strong NDR on each side of the IS in both data sets, con-firmed by the histone H3 position precisely overlapping the IS center (Fig. 6A, red line). Conversely, a nucleosome density peak was localized precisely at the IS, and its intensity varied ac-cording to the data set. This suggests that a nucleosome is posi-tioned at the replication start and is surrounded by a NDR of∼200 bp. This is in agreement with results based on the com-putational prediction of nucleosome oc-cupancy at origins (Cayrou et al. 2012a) and with the MNase-seq results at six mammalian origins (Lombraña et al. 2013). The positioned nucleosome on the IS was present in all classes of origins (Supplemental Fig. S8B). Class 3a origins presented the stronger NDR profile, per-fectly in line with the nucleosome mapping data in the highly efficient S. pombe origins (Lantermann et al. 2010). Because analysis of the raw data indicated that the MNase 2 set was more digested than the MNase 1 set (Supplemental Fig. S8A), we hypothesized that the nu-cleosome positioned at the IS is labile. Indeed, when looking at individual ori-gins, we noticed that the nucleosome density in the two sets differed, particu-larly when the origin size and the number of IS increased (Supplemental Fig. S8B). This finding confirms the relationship between origin strength and chromatin structure.
Moreover, we detected one oriented NDR relative to the positioned nucleo-some (Supplemental Fig. S8C, red dot), suggesting a specific orientation of this NDR relative to individual origins. Sever-al recent studies have shown that the nucleotide sequence could play a role in the nucleosome positioning. Particular-ly in human, some GC-rich regions seem to be nucleosome-depleted, differ-ently from yeast, where it is the AT-rich regions that are most often associated with a NDR. Therefore, we analyzed the nucleosome distribution around the IS relative to the strand of the G-rich occur-rences found in Figure 5. We observed a strict NDR only on the origin part that is enriched in G-rich occurrences, up-stream of the IS. (Fig. 6D). The same re-sult was obtained with the H3 profile around the IS, considering the DNA strand on which the G-rich occurrences are located (Supplemental Fig. S9). In contrast, we did not detect any NDR on origins without significant enrichment in G-rich k-mers on their 5′ side (Fig. 6E). This analysis also confirmed the presence of a nucleosome at the IS, both present in G-rich asymmetric re-gions or G-rich nonasymmetric rere-gions (Fig. 6F,G).
Figure 6. A labile nucleosome is present at the replication initiation site. (A) Nucleosome occupancy at origins. ChIP-seq signals for two different MNase digestion sets at ±1.5 kb around the IS (solid and dashed black lines). The global profile of origins centered on IS is in green. The two MNase profiles are matching, except on the IS, indicating a labile nucleosome. The histone H3 ChIP-seq signal is in red. (B) Distribution of histone H3 variants at origins. ChIP-seq signals for H3.1 (large dashed black line), H3.2 (medium dashed black line), H3.3 (fine dashed black line), and H2AZ (red line) at ±1.5 kb of IS (global profile in green). (C ) Distribution of H3K64ac around IS. ChIP-chip signals for H3K64ac (50% top probes distribution) at ±1.5 kb of IS (global profile in green). (D,E) Nucleosome distribution around IS according to the G-rich sequence asymmetry. (D) A group of origins with G-rich asymmetry with initiation sites that show a highly significant enrichment (P-value 1 × 10⁻²) in either G-rich k-mers on the left side of the initiation sites (MNase-strand+, blue line, n = 9518) or in C-rich k-mers on the right side (MNase-strand−, red line, n = 9682). We thus oriented the right-side C-rich plot to systemati-cally represent the features in the 5′to 3′direction. Note the striking consistency between MNase pro-files obtained from left-side G-rich and right-side C-rich occurrences (MNase-merge, black line). The orange curve indicates the profile of G-rich occurrences around the IS considering the DNA strand on origins oriented according to the asymmetry of G-rich k-mer occurrences. (E ) A group of nonasym-metric origins (n = 45,320) was defined by initiation sites with no significant enrichment for either of these two signals. Note the acute peak of MNase at the precise position of the IS and the absence of upstream depletion, which contrasts with G-rich asymmetric origins. (F) Schematic representa-tion of the nucleosome distriburepresenta-tion around IS. (G) Genome browser representarepresenta-tions of Nascent Strands, MNase1, and MNase2 enrichment profiles are shown for a representative G-rich asym-metric origin.
In transcriptionally active chromatin, unstable nucleosomes contain both H2AZ and H3.3 variants (Jin and Felsenfeld 2007). Therefore, to further investigate the nucleosome lability at IS, we analyzed ChIP-seq data on histone variants (Jia et al. 2012). However, the presence of histone variants at IS did not convincing-ly explain the observed nucleosome lability, as H3.1 was the main H3 variant at IS. Moreover, we only observed a small H3.3 peak and, as expected, no H3.2 (Fig. 2B). H2AZ was broadly en-riched at replication origins (Fig. 6B, red line), but 10% of the H2AZ sites only covered 8.6% of IS (Supplemental Table S1). We then investigated whether specific epigenetic marks could explain nucleosome lability. A recent work suggested a role of the previous-ly uncharacterized H3K64ac mark in nucleosome stability and dy-namics (Di Cerbo et al. 2014). We observed that 86% of origins covered by the H3K64ac ChIP assay were associated with at least one positive probe (Supplemental Fig. S8D). Moreover, H3K64ac (top 50% stronger probes) (Supplemental Fig. S8E) displayed a high and sharp profile centered on the labile nucleosome at IS and also a broad profile around the IS (Fig. 6C) in all origin classes (Supplemental Fig. S8F). These profiles were detected inside genes as well as in intergenic regions (Supplemental Fig. S8G).
In summary, each IS contains a positioned labile nucleosome flanked by a NDR 200 bp upstream of the IS. This nucleosome is particularly enriched in H3K64ac, suggesting that this mark has a potential new role in initiation of DNA replication.
Discussion
Altogether our data bring new insights into the nature and flexibil-ity of metazoan origins. Origins appear to be organized in a bipar-tite fashion, with a nucleosome-free, G-rich region upstream of a nucleosome positioned at the IS. They can be classified in three classes with different structural organization, nucleotide composi-tion, epigenetic properties, and genomic distribution.
Coexistence of three different origin classes
The structural organization of origins within each of the three classes differs from that of neighboring origins. This organization is remarkably paralleled by specific features within each class. We emphasize that these three classes could be further subdivided without altering the main conclusions reached in this study.
Class 1 is the main origin class (44% of all IS). They are located in gene-poor regions and contain limited epigenetic signatures, consistent with being mainly late replicated origins. Nevertheless, they are enriched in strand-asymmetric sequences, such as ACACACAC or TGTGTGTG repeats, at the IS. Conversely, the two other classes include early origins located in gene-rich regions with specific chromatin marks. This is reminiscent of a recent analysis that classified S. cerevisiae origins in two main groups (“DNA-dependent” and “chromatin-dependent”) based on their in vivo and in vitro DNA-ORC affinity (Hoggard et al. 2013). Accordingly, Class 1 origins, poor in chromatin marks and 77% of which are associated with at least one preferential sequence, might represent“sequence-dependent” origins, whereas the other two classes, associated with specific chromatin features, might define“chromatin-dependent” origins. Class 1 “sequence-depen-dent” origins, like the “DNA-dependent” origins in yeast, account for 75% of late origins, in contrast to“chromatin- dependent” or-igins that are mainly early firing oror-igins. This observation suggests the preservation in eukaryotes of a sequence-dependent
mecha-nism for origin selection and positioning in late-replicated regions, possibly to compensate the deficit in chromatin marks.
G-rich or G4 signatures at replication origins
and nucleosome organization
Most origins contain a G-rich or the complementary C-rich octamer. The distribution of these motifs, relative to the IS, is com-parable to that of the OGRE motif (Cayrou et al. 2011). Moreover, we also found the G-rich motif in hESCs. The G-rich sequence is not at the IS, but 250 bp upstream of it, reflecting the fact that this motif is oriented relative to the IS. We previously proposed that these G-rich elements could form G4 (Cayrou et al. 2012a). It was subsequently suggested that G4 occur in human origins as well (Besnard et al. 2012), and they influence replication initiation in chicken cells (Valton et al. 2014). We confirm here that 78% of mESC origins contain at least one potential G4 structure on the leading strand template.
How can these OGRE/G4 elements favor replication initia-tion? Their position strongly suggests a role in origin recognition at the pre-RC site rather than in origin opening at the IS. In support of this hypothesis, G-rich elements were identified as a binding site for ORC in mouse rDNA (Zellner et al. 2007), and a recent bio-chemical analysis showed that purified ORC could bind to G4 RNA or DNA (Hoshina et al. 2013). In the Drosophila genome, ORC binding sites contain a central GC-rich region surrounded by AT-rich sequences (Vorobyeva et al. 2013). G-rich motifs/G4 may help in destabilizing the proximal double-stranded DNA structure (König et al. 2013), facilitating the MCM2-7 helicase access to the leading single-stranded DNA template.
In addition, G-rich regions, particularly G4, correlate with nu-cleosome depletion in many eukaryotes (Rhodes 1979; Iyer and Struhl 1995; Huppert and Balasubramanian 2007; Halder et al. 2009; Wong and Huppert 2009; Fenouil et al. 2012). Mouse origins contain a NDR, like other eukaryote origins (Mavrich et al. 2008; Berbenetz et al. 2010; Eaton et al. 2010; MacAlpine et al. 2010; Lubelsky et al. 2011; Givens et al. 2012), and here we show that this region overlaps with the G-rich/G4 element upstream of the IS and not with the IS itself. This is in agreement with the hypoth-esis that this G-rich nucleosome-free region may be the pre-RC assembly site. Interestingly, Saccharomyces japonicus are character-ized by high GC content, while AT content is a negative predictor of origin function (Xu et al. 2012), similar to our observation in mouse ES cells.
As G4 can inhibit replication fork progression (Sarkies et al. 2010; Paeschke et al. 2011), it could be asked how a replication inhibitory element might also stimulate replication. DNA replica-tion initiareplica-tion occurs in two temporal steps. Pre-RCs are formed in G1, and only 20%–30% of these pre-RCs are activated in each cell during S phase. In their folded form, G4 could negative-ly regulate initiation of DNA replication at pre-RCs; however, when unfolded, they could trigger DNA replication at the subpop-ulation of pre-RCs that are activated during S phase. G4 forma-tion may be favored by formaforma-tion of an R-loop on the C strand (Fragkos et al. 2015), and G4/OGRE elements could function as a structural switch: folded or unfolded. Alternatively, replication origins could be activated at pre-RCs and then transiently stall at the proximal G4 on the leading strand, a phenomenon similar to transcriptional pausing (Liu et al. 2015). This mechanism could be used to start initiation on the opposite strand, similarly to the model proposed for the DBF4 replication origin (Romero and Lee 2008). Alternatively, it might control the timing of
Replication origin signatures and organization
Cold Spring Harbor Laboratory Press on January 11, 2021 - Published by
genome.cshlp.org Downloaded from
origin activation, as Rif1 has recently been found to bind G4 (Kanoh et al. 2015).
An AC/TG asymmetric repeated motif and a labile-positioned
nucleosome at the initiation site
We also identified an AC (or complementary TG) repeat precisely at the IS center in 40% of origins, particularly in late-replicated or-igins (Class 1). CA/GT repeats are strongly enriched at nucleosome-positioning sequences in the mouse (Widlund et al. 1997), and they overlap with the nucleosome positioned at IS in our study. This is reminiscent of the nucleosome positioned downstream from the ORC binding site described in budding yeast origins (Eaton et al. 2010) and in a panel of six mouse origins (Lombraña et al. 2013). Moreover, TG-rich sequences can form Z-DNA struc-tures (Wahls et al. 1990, 1991; Majewski and Ott 2000) that have been detected in positioned nucleosomes, where they facilitate their remodeling (Liu et al. 2006; Maruyama et al. 2013). Remark-ably, MCM helicase activity is weak on a nucleosome template, and the chromatin remodeling complex FACT is necessary to pro-mote DNA unwinding (Tan et al. 2006). In agreement, we found a strong enrichment of H3K64ac strictly centered on the nucleo-some at the IS, a new chromatin mark associated with labile nucle-osomes in mESCs (Di Cerbo et al. 2014). These results suggest a new role for this mark in positioning a labile nucleosome that pre-vents the accessibility to the IS outside the required time and that can be remodeled when the pre-RC is activated.
Plasticity and synergy of origin selection by specialized
epigenetic signatures
Two of the three classes of origins are correlated with a specific chromatin environment, consistent with the identification of “chromatin-dependent” origins in S. cerevisiae (Hoggard et al. 2013). Each class is characterized by a specific origin structure and relationship with the surrounding chromatin. Class 2 origins correspond to large initiation zones with many inefficient initia-tion sites and are overrepresented in enhancer regions (identified by H3K4me1), possibly offering more flexibility to initiate DNA replication. Interestingly, poised enhancers are frequently associ-ated with origins (75%), whereas active enhancers are poorly rep-resented (34%). Indeed, association of H3K4me1 with H3K27 methylation, deposited on chromatin by EZH2 (PRC2 catalytic subunit) (Kuzmichev et al. 2002), may provide a chromatin envi-ronment suitable for replication initiation. Moreover, the low SUZ12 abundance in Class 2 origins (Fig. 5B) suggests that H3K27me3 alone ensures flexible initiation rather than strict initi-ation in poised enhancers.
Conversely, strong SUZ12 enrichment was found in the high-ly efficient Class 3a origins that replicate earhigh-ly in S phase. This SUZ12 enrichment centered on the IS (Fig. 3B) suggests that PcG proteins are more linked to origin activation than to pre-RC estab-lishment. Moreover, loss of SUZ12 (Pasini et al. 2004) or of EZH2 impairs entry in S phase, and the number of origins is increased in EZH2-deficient cells (Piunti et al. 2014). The explanation given was that DNA replication fork stalling promotes the activation of dormant origins. However, the distribution profile of inter-origin distances in Ezh2−/−cells is strikingly similar to the profile predict-ed for“Random origin firing” in mESCs (Cayrou et al. 2011), in which all potential origins are randomly activated, leading to an increase in the number of very small, but also very large inter-ori-gin distances. The partial effect on inter–origin distances observed
by Piunti et al. (2014) is consistent with the small number of PcG sites in the genome, and thereby with the number of origins affect-ed by EZH2 deficiency. These observations suggest that PcG pro-teins structurally restrict the position of origin activation inside Polycomb domains.
Our analysis also shows that open chromatin marks, such as H3K4me3, are major features of origins in mESCs, notably of Class 3a origins, the most representative“chromatin-dependent” origins. The low rate of origin localization near transcription start sites (31% of Class 3a origins) cannot explain the overrepresenta-tion of this mark at origins (66%). On the other hand, the high lev-el of histone acetylation (75% for the H3K9ac levlev-el) in these origins may favor their accessibility (Görisch et al. 2005). The high efficiency of Class 3a origins and the absence of any other strong origin in the vicinity imply a constraint to initiate replica-tion at specific locareplica-tions in these regulatory regions.
Class 3a origins also show high CGI content that can create bivalent domains in mESCs (Wachter et al. 2014). These domains (80.6% of bivalent domains are in mESC origins) are composed of an activating (H3K4me3) and a repressive mark (H3K27me3) (Bernstein et al. 2006) and contain promoters of developmentally important genes that are kept poised for activation until lineage specification. Consistently, we found poised RNA Pol II at mESC origins, suggesting that the regulation of transcription and origin firing are linked. For instance, G/C-rich sequences and open/biva-lent chromatin marks could act as a platform to recruit chromatin remodeling or modification factors, both for the replication origin program and the transcription program.
Genetic and epigenetic guidance of replication initiation sites
Our analysis shows that combinations of specific genomic sig-natures regulate the localization of IS in complex eukaryotes. Importantly, specificity appears to be achieved by the synergic ac-tion of sequence motifs and chromatin modificaac-tions to allow the flexible selection of replication origins in different genomic con-texts. In gene-poor regions that are replicated late in the cell cycle, origin selection seems to be more dictated by sequence-specific fea-tures. Conversely, epigenetic signatures appear more involved in origin selection in early replicating gene-rich regions, in agree-ment with their open chromatin configuration.Our study also shows that IS are characterized by specific sig-natures, such as a well-positioned nucleosome with specific sequences and epigenetic marks. In contrast, the upstream se-quence contains a G-rich element inside a nucleosome-depleted region, which is likely to be the pre-RC site.
The existence of several classes of origins, with distinct sets of features to control origin positioning, appears to be an important mechanism to regulate origin usage. This flexibility in elements that can drive origin positioning could be used by eukaryotic cells to adapt to the environment, to the constraints linked to the com-plex structure and variety of conformations of chromatin and chromosomes, and finally to different tissue-specific transcription programs.
Methods
Cell culture
CGR8 mESCs were cultured on gelatin-coated dishes (feeder-free, to avoid DNA contamination by MEF cells) in GMEM medium sup-plemented with 10% of FBS and 1000 units/mL of LIF.
Nascent strand isolation
Nascent strands (NS) were purified as previously described in detail (Cayrou et al. 2012b). Briefly, after extraction with DNAzol, NS were first separated from genomic DNA by sucrose gradient. Several fractions of interest containing NS DNA (0.5–2 kb in size) were phosphorylated by T4 polynucleotide kinase and digested twice withλ-Exo to eliminate contaminating DNA. The first round of digestion was with 100–150 units λ−Exo (i.e., 300–500 units/μg DNA) overnight at 37°C. The resulting DNA was precipitated with ethanol, phosphorylated again, and digested again in the same conditions. A thirdλ−Exo digestion (100 units) can also be per-formed for 2 h at 37°C. Three samples were purified from three in-dependent cell cultures. The RNase A controls were obtained by treating NS-containing fractions with 50–100 μg/mL RNase A beforeλ−Exo digestion to remove RNA primers at the 5′ end of the NS. As a control, we also used genomic DNA sonicated to the same size as the NS DNA and treated byλ−Exo as described for the NS samples. This protocol differs in several ways from a recent-ly described method (Foulk et al. 2015) in which short NS were not purified by sucrose gradient before λ−Exo digestion. Instead, a large amount of whole replicating DNA was used. Moreover, as a negative control in the above study, a large amount of total frag-mented DNA (150μg) was digested with λ−Exo in strong limiting conditions (0.7 units ofλ-Exo/μg of DNA). This is 500- to 1000-fold less than in our previous works (Supplemental Fig. S2; Cayrou et al. 2012b).
Sequencing and read mapping
Single-stranded NS DNA was then converted into double-stranded DNA by random priming using DNA polymerase I (Klenow frag-ment). Heat-denatured sheared genomic DNA and RNase A-digest-ed samples were also random primA-digest-ed before library preparation using the Illumina ChIP-seq DNA Sample Prep Kit, according to the manufacturer’s instructions. Samples were sequenced us-ing the Illumina HiSeq 2000 at the MGX GenomiX facility (Montpellier). For each sample, sequenced reads were mapped as in Supplemental Material.
Peak calling
After a thorough evaluation (Supplemental Material), we com-bined two peak calling programs with complementary properties (Fig. 1B). SWEMBL (https://www.ebi.ac.uk/~swilder/SWEMBL/) identifies well-delimited peaks, whereas SICER (Zang et al. 2009) returns wider regions enriched in reads. All SICER regions that overlapped with at least one SWEMBL peak were retained and de-fined as IZ. Reciprocally, all SWEMBL peaks falling within a SICER region were identified as IS.
Random peak selection
As a negative control for the subsequent analyses (peak clustering, coverage of chromatin marks, motif discovery), the RSAT random-genome-fragments program was used to select random genomic regions of the same number and sizes as the origin peaks.
Read density maps
Read occurrence profiles were obtained by extracting 7 kb on each side of the summit of each peak (10-kb data provided in Supplemental Material) and counting the reads per 100-bp bins. Data processing was done in R (R Core Team 2014) by applying k-means clustering on the read occurrence profiles with various numbers of clusters. For visual purposes, the resulting clusters were sorted according to their average density profile to highlight
the relationships between the central peak and its first closest neighbor. On the density map, pairs of neighbor peaks appear twice: once centered on the leftmost peak, and once on the right-most peak. Consistently, our clustering procedure revealed sym-metrical clusters. We labeled clusters as“L” or “R,” respectively, to denote the left-side or right-side location of the secondary peak. For further analysis, we regrouped the symmetrical pairs of clusters (e.g., cluster 10L and 10R form cluster 10).
We developed a custom R library (ocpR; available in Sup-plemental Materials and http://tagc.univ-mrs.fr/origins/) to auto-mate data processing and test the impact of different parameters (k, summit flanking size) that allow data clustering, ordering, and visualization. Based on the visual inspection of the resulting heatmaps, we retained k = 19 clusters. Clustering results with other k values are in Supplemental Material.
To assess the clusters’ relevance, we performed two negative controls: (1) k-means clustering on randomized bins (random per-mutation of read count values inside each row independently); and (2) random selection of genome fragments using the RSAT program random-genome-fragments.
Overlap with genomic features and data from other sources
Genomic annotations were downloaded from the UCSC Table Browser tool (Mouse genome version NCBI37/mm9 NCBI37). Overlapping of origins with the genomic annotations was done as in the Supplemental Material. Data on histone marks and transcription factors in mESCs were downloaded from the GEO da-tabase (http://www.ncbi.nlm.nih.gov/geo/). The accession num-bers are detailed in Supplemental Table S1.Heatmap, correlations, and clustering
Comparison between ChIP-seq data sets (histone marks and TFBS BED files) and peaks (IS) or zones (IZ) was computed using BEDTools annotateBed (Quinlan and Hall 2010) that allows the annotation of multiple BED files (histone marks, ChIP-seq marks) against a reference (IS and IZ) and returns a matrix of overlapping marks. A Pearson’s correlation matrix was computed in R, from which a correlation distance (d = 1− r) was derived. Mark cluster-ing and heatmap visualization were computed with the R function gplots: heatmap.2. Pairwise comparisons of genomic coordinates were computed with BEDTools intersectBed.
Ab initio motif discovery
The RSAT program position-analysis (van Helden et al. 2000) was used to detect oligonucleotides (k-mers) with positional biases around peak summits. The occurrence of all k-mers from 1 to 8 nt were counted in 50-bp-wide non-overlapping windows from −1 to +1 kb relative to origin summits. The difference between observed and expected distribution (window-specific Bernoulli model) was measured with aχ2test, and the top 100 ranking
sig-nificant k-mers were clustered based on their positional profiles of occurrences. Clusters of co-occurring k-mers were used to define position-specific signals, which were used to orientate each peak for the polarity-oriented analysis of MNase occupancy.
Data access
The high-throughput sequencing data from this study have been submitted to the NCBI Gene Expression Omnibus (GEO; http://www.ncbi.nlm.nih.gov/geo/) under accession number GSE68347. A supporting website with the details of the analysis is available at http://tagc.univ-mrs.fr/origins/.
Replication origin signatures and organization
Cold Spring Harbor Laboratory Presson January 11, 2021 - Published by genome.cshlp.org
Acknowledgments
The research leading to these results received funding from the European Research Council (FP7/2007-2013 Grant Agreement no. 233339). This work was also supported by the Fondation pour la Recherche Médicale (FRM) and the European Commission Network of Excellence EpiGeneSys (HEALTH-F4-2010-257082).
References
Abdurashidova G, Deganuto M, Klima R, Riva S, Biamonti G, Giacca M, Falaschi A. 2000. Start sites of bidirectional DNA synthesis at the human lamin B2 origin. Science287: 2023–2026.
Adelman K, Lis JT. 2012. Promoter-proximal pausing of RNA polymerase II: emerging roles in metazoans. Nat Rev Genet13: 720–731.
Aladjem MI. 2007. Replication in context: dynamic regulation of DNA rep-lication patterns in metazoans. Nat Rev Genet8: 588–600.
Bailey TL, Johnson J, Grant CE, Noble WS. 2015. The MEME Suite. Nucleic Acids Res43: W39–W49.
Berbenetz NM, Nislow C, Brown GW. 2010. Diversity of eukaryotic DNA replication origins revealed by genome-wide analysis of chromatin structure. PLoS Genet6: e1001092.
Bernstein BE, Mikkelsen TS, Xie X, Kamal M, Huebert DJ, Cuff J, Fry B, Meissner A, Wernig M, Plath K, et al. 2006. A bivalent chromatin struc-ture marks key developmental genes in embryonic stem cells. Cell125: 315–326.
Besnard E, Babled A, Lapasset L, Milhavet O, Parrinello H, Dantec C, Marin JM, Lemaitre JM. 2012. Unraveling cell type–specific and reprogramma-ble human replication origin signatures associated with G-quadruplex consensus motifs. Nat Struct Mol Biol19: 837–844.
Cayrou C, Coulombe P, Vigneron A, Stanojcic S, Ganier O, Peiffer I, Rivals E, Puy A, Laurent-Chabalier S, Desprat R, et al. 2011. Genome-scale analy-sis of metazoan replication origins reveals their organization in specific but flexible sites defined by conserved features. Genome Res 21: 1438–1449.
Cayrou C, Coulombe P, Puy A, Rialle S, Kaplan N, Segal E, Méchali M. 2012a. New insights into replication origin characteristics in metazoans. Cell Cycle11: 658–667.
Cayrou C, Grégoire D, Coulombe P, Danis E, Méchali M. 2012b. Genome-scale identification of active DNA replication origins. Methods 57: 158–164.
Costas C, de la Paz Sanchez M, Stroud H, Yu Y, Oliveros JC, Feng S, Benguria A, López-Vidriero I, Zhang X, Solano R, et al. 2011. Genome-wide map-ping of Arabidopsis thaliana origins of DNA replication and their associ-ated epigenetic marks. Nat Struct Mol Biol18: 395–400.
Creyghton MP, Cheng AW, Welstead GG, Kooistra T, Carey BW, Steine EJ, Hanna J, Lodato MA, Frampton GM, Sharp PA, et al. 2010. Histone H3K27ac separates active from poised enhancers and predicts develop-mental state. Proc Natl Acad Sci107: 21931–21936.
Delgado S, Gómez M, Bird A, Antequera F. 1998. Initiation of DNA replica-tion at CpG islands in mammalian chromosomes. EMBO J 17: 2426–2435.
DePamphilis ML. 1993. Origins of DNA replication that function in eukary-otic cells. Curr Opin Cell Biol5: 434–441.
Di Cerbo V, Mohn F, Ryan DP, Montellier E, Kacem S, Tropberger P, Kallis E, Holzner M, Hoerner L, Feldmann A, et al. 2014. Acetylation of histone H3 at lysine 64 regulates nucleosome dynamics and facilitates transcrip-tion. eLife3: e01632.
Eaton ML, Galani K, Kang S, Bell SP, MacAlpine DM. 2010. Conserved nucleosome positioning defines replication origins. Genes Dev 24: 748–753.
Fenouil R, Cauchy P, Koch F, Descostes N, Cabeza JZ, Innocenti C, Ferrier P, Spicuglia S, Gut M, Gut I, et al. 2012. CpG islands and GC content dic-tate nucleosome depletion in a transcription-independent manner at mammalian promoters. Genome Res22: 2399–2408.
Foulk MS, Urban JM, Gerbi SA. 2015. Characterizing and controlling intrin-sic biases of lambda exonuclease in nascent strand sequencing reveals phasing between nucleosomes and G-quadruplex motifs around a sub-set of human replication origins. Genome Res25: 725–735.
Fragkos M, Ganier O, Coulombe P, Méchali M. 2015. DNA replication origin activation in space and time. Nat Rev Mol Cell Biol16: 360–374. Gindin Y, Valenzuela MS, Aladjem MI, Meltzer PS, Bilke S. 2014. A
chroma-tin structure-based model accurately predicts DNA replication timing in human cells. Mol Syst Biol10: 722.
Givens RM, Lai WK, Rizzo JM, Bard JE, Mieczkowski PA, Leatherwood J, Huberman JA, Buck MJ. 2012. Chromatin architectures at fission yeast transcriptional promoters and replication origins. Nucleic Acids Res40: 7176–7189.
Görisch SM, Wachsmuth M, Tóth KF, Lichter P, Rippe K. 2005. Histone acet-ylation increases chromatin accessibility. J Cell Sci118: 5825–5834. Halder K, Halder R, Chowdhury S. 2009. Genome-wide analysis predicts
DNA structural motifs as nucleosome exclusion signals. Mol Biosyst5: 1703–1712.
Hiratani I, Ryba T, Itoh M, Yokochi T, Schwaiger M, Chang CW, Lyou Y, Townes TM, Schübeler D, Gilbert DM. 2008. Global reorganization of replication domains during embryonic stem cell differentiation. PLoS Biol6: e245.
Hoggard T, Shor E, Müller CA, Nieduszynski CA, Fox CA. 2013. A link be-tween ORC-origin binding mechanisms and origin activation time re-vealed in budding yeast. PLoS Genet9: e1003798.
Hoshina S, Yura K, Teranishi H, Kiyasu N, Tominaga A, Kadoma H, Nakatsuka A, Kunichika T, Obuse C, Waga S. 2013. Human origin recog-nition complex binds preferentially to G-quadruplex-preferable RNA and single-stranded DNA. J Biol Chem288: 30161–30171.
Huppert JL, Balasubramanian S. 2007. G-quadruplexes in promoters throughout the human genome. Nucleic Acids Res35: 406–413. Iyer V, Struhl K. 1995. Poly(dA:dT), a ubiquitous promoter element that
stimulates transcription via its intrinsic DNA structure. EMBO J14: 2570–2579.
Jia J, Zheng X, Hu G, Cui K, Zhang J, Zhang A, Jiang H, Lu B, Yates J III, Liu C, et al. 2012. Regulation of pluripotency and self-renewal of ESCs through epigenetic-threshold modulation and mRNA pruning. Cell 151: 576–589.
Jin C, Felsenfeld G. 2007. Nucleosome stability mediated by histone vari-ants H3.3 and H2A.Z. Genes Dev21: 1519–1529.
Kanoh Y, Matsumoto S, Fukatsu R, Kakusho N, Kono N, Renard-Guillet C, Masuda K, Iida K, Nagasawa K, Shirahige K, et al. 2015. Rif1 binds to G quadruplexes and suppresses replication over long distances. Nat Struct Mol Biol doi: 10.1038/nsmb.3102.
Kobayashi T, Rein T, DePamphilis ML. 1998. Identification of primary initi-ation sites for DNA repliciniti-ation in the hamster dihydrofolate reductase gene initiation zone. Mol Cell Biol18: 3266–3277.
Koch F, Fenouil R, Gut M, Cauchy P, Albert TK, Zacarias-Cabeza J, Spicuglia S, de la Chapelle AL, Heidemann M, Hintermair C, et al. 2011. Transcription initiation platforms and GTF recruitment at tissue-specif-ic enhancers and promoters. Nat Struct Mol Biol18: 956–963. König SL, Huppert JL, Sigel RK, Evans AC. 2013. Distance-dependent duplex
DNA destabilization proximal to G-quadruplex/i-motif sequences. Nucleic Acids Res41: 7453–7461.
Koren A, Handsaker RE, Kamitaki N, Karlic´ R, Ghosh S, Polak P, Eggan K, McCarroll SA. 2014. Genetic variation in human DNA replication tim-ing. Cell159: 1015–1026.
Kuzmichev A, Nishioka K, Erdjument-Bromage H, Tempst P, Reinberg D. 2002. Histone methyltransferase activity associated with a human mul-tiprotein complex containing the Enhancer of Zeste protein. Genes Dev 16: 2893–2905.
Lantermann AB, Straub T, Strålfors A, Yuan GC, Ekwall K, Korber P. 2010. Schizosaccharomyces pombe genome-wide nucleosome mapping reveals positioning mechanisms distinct from those of Saccharomyces cerevisiae. Nat Struct Mol Biol17: 251–257.
Li B, Su T, Ferrari R, Li JY, Kurdistani SK. 2014. A unique epigenetic signature is associated with active DNA replication loci in human embryonic stem cells. Epigenetics9: 257–267.
Liu H, Mulholland N, Fu H, Zhao K. 2006. Cooperative activity of BRG1 and Z-DNA formation in chromatin remodeling. Mol Cell Biol 26: 2550–2559.
Liu X, Kraus WL, Bai X. 2015. Ready, pause, go: regulation of RNA polymer-ase II pausing and relepolymer-ase by cellular signaling pathways. Trends Biochem Sci40: 516–525.
Lombraña R, Almeida R, Revuelta I, Madeira S, Herranz G, Saiz N, Bastolla U, Gómez M. 2013. High-resolution analysis of DNA synthesis start sites and nucleosome architecture at efficient mammalian replication ori-gins. EMBO J32: 2631–2644.
Lubelsky Y, Sasaki T, Kuipers MA, Lucas I, Le Beau MM, Carignon S, Debatisse M, Prinz JA, Dennis JH, Gilbert DM. 2011. Pre-replication complex proteins assemble at regions of low nucleosome occupancy within the Chinese hamster dihydrofolate reductase initiation zone. Nucleic Acids Res39: 3141–3155.
MacAlpine HK, Gordân R, Powell SK, Hartemink AJ, MacAlpine DM. 2010. Drosophila ORC localizes to open chromatin and marks sites of cohesin complex loading. Genome Res20: 201–211.
Majewski J, Ott J. 2000. GT repeats are associated with recombination on human chromosome 22. Genome Res10: 1108–1114.
Marahrens Y, Stillman B. 1992. A yeast chromosomal origin of DNA replica-tion defined by multiple funcreplica-tional elements. Science255: 817–823. Maruyama A, Mimura J, Harada N, Itoh K. 2013. Nrf2 activation is
associat-ed with Z-DNA formation in the human HO-1 promoter. Nucleic Acids Res41: 5223–5234.