HAL Id: hal-00318354
https://hal.archives-ouvertes.fr/hal-00318354
Submitted on 30 Jul 2007
HAL is a multi-disciplinary open access
archive for the deposit and dissemination of
sci-entific research documents, whether they are
pub-lished or not. The documents may come from
teaching and research institutions in France or
abroad, or from public or private research centers.
L’archive ouverte pluridisciplinaire HAL, est
destinée au dépôt et à la diffusion de documents
scientifiques de niveau recherche, publiés ou non,
émanant des établissements d’enseignement et de
recherche français ou étrangers, des laboratoires
publics ou privés.
reconnection
S. M. Imber, S. E. Milan, B. Hubert
To cite this version:
S. M. Imber, S. E. Milan, B. Hubert. Observations of significant flux closure by dual lobe reconnection.
Annales Geophysicae, European Geosciences Union, 2007, 25 (7), pp.1617-1627. �hal-00318354�
www.ann-geophys.net/25/1617/2007/ © European Geosciences Union 2007
Annales
Geophysicae
Observations of significant flux closure by dual lobe reconnection
S. M. Imber1, S. E. Milan1, and B. Hubert2
1Department of Physics and Astronomy, University of Leicester, Leicester, UK
2Institut d’Atmospherique et de Geophysique, Universit´e de Li`ege, Li`ege, Belgium
Received: 3 April 2007 – Revised: 15 June 2007 – Accepted: 21 June 2007 – Published: 30 July 2007
Abstract. We present an interval of dual lobe reconnection
during which interplanetary magnetic field lines are captured by the magnetosphere by reconnecting at high latitudes in both the Northern and the Southern Hemispheres. This event was identified using measurements of the ionospheric con-vection flow and observations of the aurora using the Super-DARN radars and the IMAGE spacecraft. A cusp spot, char-acteristic of northward IMF, is clearly visible for a 30 min pe-riod enabling the ionospheric footprint of the Northern Hemi-sphere merging gap to be accurately determined. During the interval a strong burst of sunward flow across the dayside open/closed field line boundary (OCB) is observed, which we interpret as the reconfiguration of the magnetosphere fol-lowing a burst of reconnection. Noon-midnight and dawn-dusk keograms of the aurora show that the polar cap shrinks during the interval indicating that a large amount of flux was closed by the reconnection. Using the SuperDARN potential maps it is possible to calculate that the amount of flux closed during the interval is 0.13 GWb which represents approxi-mately 10% of the pre-existing polar cap. The number of ions captured by the burst of dual lobe reconnection was
cal-culated to be ∼2.2×1031, more than sufficient to populate a
cold, dense plasma sheet. That a dense plasma sheet was not subsequently observed is discussed in terms of subsequent changes in the IMF.
Keywords. Magnetospheric physics (Magnetospheric
con-figuration and dynamics; Plasma convection; Solar wind-magnetosphere interactions)
Correspondence to: S. M. Imber (si45@ion.le.ac.uk)
1 Introduction
1.1 Reconnection during northward IMF
When the interplanetary magnetic field (IMF) is directed northwards it is expected that lobe reconnection will take place (e.g. Dungey, 1963; Russell, 1972; Reiff and Burch, 1985; Crooker, 1992; Milan et al., 2000). Interplanetary magnetic field lines drape over the subsolar point and are antiparallel with the geomagnetic field just tailward of the cusps. If a lobe field line and an interplanetary magnetic field line reconnect in either the Northern or the Southern Hemisphere, the result is an open field line with one foot-print mapping to the polar cap inside the auroral oval and the other out in the solar wind, such that the field line is draped over the dayside magnetopause (Crooker, 1992). The iono-spheric footprint of the lobe reconnection site can be imaged as a cusp spot poleward of the main dayside auroral oval if the solar wind density is sufficiently high (e.g. Øieroset et al., 1997; Milan et al., 2000). A combination of the magnetic tension force on the bent field line and the anti-sunward flow of the solar wind results in a reverse twin-cell ionospheric convection pattern, usually with sunward flow in the noon sector (e.g. Cowley, 1981; Huang et al., 2000; Milan et al., 2000). The process of lobe reconnection does not open or close any field lines and therefore the associated convection pattern is contained within the polar cap (Fig. 1a) and the
po-lar cap will remain of constant size. When the BY component
of the IMF is non-zero and the IMF is northward, this single lobe reconnection takes place simultaneously but indepen-dently in both hemispheres, so two cusp spots are observed (Østgaard et al., 2005). These cusp spots are independent as the reconnection in each hemisphere involves a different IMF field line (Cowley, 1981).
When the IMF BY component is zero or close to zero,
the location of the merging gaps in both hemispheres will be such that one IMF field line will be able to reconnect
(b) Dual lobe reconnection
(a) Single lobe reconnection (c) Low latitude reconnection
Fig. 1. Schematic representations of ionospheric convection dur-ing sdur-ingle lobe, dual lobe and low latitude reconnection. The upper figures represent the geomagnetic field, with the Sun to the left of the figures. The lower figures show the ionospheric convection pat-terns looking down on the Northern polar cap. The solid circle is the OCB, encircling the polar cap. The dashed portion of the OCB is the merging gap, the arrowed lines are flow streamlines and the large arrows indicate expansion or contraction of the polar cap. Lo-cal noon is directed towards the top of the figure.
at both merging gaps. This process is called dual lobe re-connection (DLR), and is thought to occur when the clock angle is very small, i.e. the IMF is very strongly northward (Dungey, 1963; Cowley, 1981; Song and Russell, 1992; Im-ber et al., 2006). The result of one interplanetary field line reconnecting in both hemispheres is a closed geomagnetic field line (Fig. 1b). Since this process is closing flux, the re-sulting ionospheric flow pattern displays sunward flow across the dayside open/closed field line boundary (OCB). It is this sunward flow signature that is used to identify the process of dual lobe reconnection. In addition, since the process closes open (lobe) field lines the polar cap would be expected to shrink (Sandholt et al., 1999, 2000), with poleward motion along adiaroic portions of the OCB (cf. the case for south-ward IMF, Cowley and Lockwood, 1992).
In a previous study, Imber et al. (2006) identified an in-terval of DLR, calculating the magnetic flux closure and the expected capture of solar wind plasma by the process. Al-though the amount of flux closed was small such that a con-traction of the polar cap was not obvious, the plasma capture was sufficient to lead to the formation of a dense plasma sheet (e.g. Øieroset et al., 2005, and references therein), with the
proton density of the plasma sheet reaching values >5 cm−3.
The present paper discusses observations of DLR during 21 October 2001. This event presents an ideal opportunity to study the fundamental reconnection process as the IMF clock angle passes slowly through zero. As the IMF remains al-most directly northward for an appreciable length of time, the DLR process continues to close flux for ∼10 min. In ad-dition, good SuperDARN coverage of the dayside Northern
auroral oval and additional coverage by the IMAGE space-craft allow continual monitoring of the polar cap, the aurora and the ionospheric plasma flows as they respond to the re-connection.
2 Observations
The interval studied here is 18:00–24:00 UT on 21 Octo-ber 2001. It was chosen primarily because the SuperDARN radars provided excellent coverage of the ionospheric con-vection flows near the dayside auroral oval during a period when the upstream solar wind monitors showed the IMF clock angle passing gradually through zero. In addition the IMAGE spacecraft provided good coverage of the auroral configuration in the Northern Hemisphere.
2.1 IMF conditions
The upstream solar wind conditions were measured by three spacecraft: ACE (Stone et al., 1998; Smith et al., 1998; McComas et al., 1998), Geotail (Kokubun et al., 1994)
and WIND (Lepping et al., 1995). ACE was located at
GSM X=221, Y=8.8 and Z=−25.2 RE and the ACE data
was lagged by 37.5 min to allow for the spacecraft position
∼220 REupstream of the Earth, using an average solar wind
velocity of −624.6 km s−1(Fig. 2). ACE observed the GSM
BZcomponent to be at approximately −20 nT until 20:55 UT
when it passed through zero to ∼22 nT. It then fell again to negative values peaking at −30 nT before the end of the inter-val. There was therefore an interval between 20:35 UT and
21:35 UT during which the GSM BZcomponent was
posi-tive (Fig. 2). The BY component of the IMF was observed
to increase from −10 nT to 20 nT, then decrease steadily to
−20 nT at 20:55 UT. Following this it returned to ∼25 nT
be-fore falling to negatives values again towards the end of the interval (Fig. 2). The clock angle was therefore observed to
pass gradually from −180◦(southward), through zero
(north-ward) to +180◦over a timescale of just over 3 h (Fig. 2). It
should be noted that relatively high magnetic field strengths in the solar wind are due to a co-rotating interaction region.
During the interval Geotail was near the bowshock, at
GSM X=2, Y=−19 and Z=0 RE. It observed very similar
variations in the GSM BY and BZcomponents, and the clock
angle was observed to pass through zero at exactly the same time as for ACE (Fig. 2). For short periods during the
inter-val Geotail measured enhanced inter-values of BY and BZrelative
to those measured by ACE. This is due to compression of the field when Geotail was located within the magnetosheath. Despite this the clock angle variation was very similar to that at ACE. Although data were not observed for the full interval, the location of Geotail relatively close to the magnetopause gives us confidence in the time lag calculated for the ACE data.
-20 -100 10 20 GSM By -20 -100 10 20 GSM Bz -100 0 100 Clock Angle ACE -40 -200 20 40 GSM By -60 -40 -200 20 GSM Bz 18 19 20 21 22 23 24 -100 0 100 Clock angle Geotail -20 -100 10 20 GSM By -20 -100 10 20 GSM Bz 1800 1900 2000 2100 2200 2300 0000 UT -100 0 100 Clock angle WIND
Fig. 2. GSM BY and BZinterplanetary magnetic field components along with the corresponding clock angle, measured by ACE and WIND in the solar wind and Geotail in the upstream solar wind and occasionally within the magnetosheath, 18:00–24:00 UT on 21 October 2001. Vertical lines mark the average time that the clock angle passed through zero–20:55 UT.
WIND was located at GSM X=40, Y=−10 and Z=3.5 RE
and the data was lagged by 6.5 min to take into account the upstream location of the spacecraft (Fig. 2). Again there was
excellent agreement with the ACE data in the IMF BY and
BZ components, and again the clock angle passed through
zero at the same time: 20:55 UT. The excellent agreement between the solar wind monitors gives us confidence that we know the time at which DLR might be expected to occur to a reasonable degree of accuracy.
2.2 IMAGE
The IMAGE spacecraft passed over the Northern polar cap between 18:00 and 24:00 UT on 21 October 2001. Images are available from the Wideband Imaging Camera (WIC), and the Spectrographic Imager instrument (Mende et al., 2000a, b), which operates 2 cameras imaging electron au-rora (SI13) and Doppler-shifted Lyman alpha emission from down-going hydrogen atoms associated with proton precipi-tation (SI12). Both WIC and the SI13 images were obscured
Fig. 3. A typical image from the SI12 instrument on the IMAGE spacecraft. The image is looking down on the Northern polar cap with noon to the top. The proton aurora is clearly visible as the darker portion of the image. The black rectangle represents the area used to observe the change in brightness of a nightside portion of the auroral oval during the interval.
by dayglow on the dayside so the SI12 proton aurora images, relatively unaffected by dayglow, are used in this study. Fig-ure 3 shows a typical SI12 image during this interval taken at 21:08 UT. The image is plotted on a polar grid looking down on the Northern Hemisphere with noon at the top of the image. The auroral oval is clearly visible, as is a promi-nent cusp auroral spot in the noon sector associated with the northward IMF conditions (Milan et al., 2000). This cusp spot is caused by solar wind plasma travelling down newly reconnected field lines and is seen both in the SI12 (proton) and SI13 (electron) images. In order for a spot to appear the solar wind density has to be sufficiently high for a significant number of solar wind particles to be present on reconnecting IMF field lines (Frey et al., 2002). The spot is particularly important in this event as it represents the footprint of the re-connecting field lines and therefore enables us to observe the location and motion of the merging gap with changing IMF conditions. High luminosities in the top-left of the image are an artefact.
Noon-midnight and dawn-dusk keograms were generated from the auroral observations and are presented in Fig. 4, the vertical dashed line marks the time at which the clock angle is observed to pass through zero. It is clear from the keograms that the auroral oval is located at relatively low latitudes due to intense solar wind-magnetosphere coupling under south-ward IMF conditions prior to 20:35 UT. During the interval the auroral oval is observed to move both equatorwards and
Fig. 4. Dawn-dusk and noon-midnight keograms of the SI12 data during the interval of interest, 18:00 to 24:00 UT on 21 October 2001. In the first panel dawn is at the top and dusk at the bottom, in the second, noon is at the top and midnight at the bottom. These demonstrate that the auroral oval expands and contracts throughout the interval. Below this is the clock angle measured by ACE with the vertical dashed line representing the time at which the clock angle passed through zero.
polewards indicating changes in the open flux content of the magnetosphere (e.g. Milan et al., 2003). There is also a cusp spot observed near noon in the noon-midnight keogram of Fig. 4 which moves gradually duskward with time. The spot is first formed at 20:54 UT when the IMF turned strongly
northward. As BY<0 at this time the spot forms in the
prenoon sector as reported by Milan et al. (2000). As BY
changes the spot moves, through noon at 21:10 UT when it
would be expected that BY=0. As BY becomes more
posi-tive, the spot is observed to move into the postnoon sector, reaching 13:30 MLT. The intensity of the spot decreases and it finally disappears at approximately 22:00 UT.
2.3 SuperDARN radars
Throughout the interval the SuperDARN radar coverage of the dayside portion of the Northern auroral oval was excel-lent. Using the line-of-sight measurements of the ionospheric convection flow from the 9 Northern Hemisphere radars it is possible to create a map of the electrostatic potential pat-tern associated with this convection (Ruohoneimi and Baker, 1998).
Fig. 5. SI12 images of the Northern polar cap, superimposed over which are the potential contours and flow pattern determined by analysis of SuperDARN radar data. (a) a typical southward IMF twin cell convection pattern (b) Equatorward flow across the OCB.
The SuperDARN flow patterns were plotted over the si-multaneous SI12 images at 2 min cadence. When the IMF is southward, prior to 20:35 UT, the convection cells are typ-ical of low latitude dayside reconnection with anti-sunward flow across the dayside OCB, as would be expected during this time (Fig. 5a). As the clock angle approaches zero how-ever, some sunward flow is observed in the noon portion of the auroral oval (Fig. 5b). This sunward flow crosses the
dayside auroral oval, extending down to magnetic latitudes
of approximately 63◦and is observed between 20:58 UT and
21:14 UT. During this time the sense of the convection cells is observed to reverse, with sunward flow at high latitudes and return flow at lower latitudes. Sunward flow near noon is the expected signature of both single and dual lobe recon-nection. The inclusion of sunward flow extending to such low latitudes indicates the possibility that the flow crosses the OCB, therefore that dual lobe reconnection has taken place. In order to determine whether this has taken place however, it is necessary to first calculate the position of the OCB.
2.4 Identifying the OCB
An interval of sunward flow near noon extending to
lati-tudes ∼63◦ has been identified from ionospheric flow
pat-terns generated using data from the Northern Hemisphere SuperDARN radars. In order to ascertain whether dual lobe reconnection has taken place it is necessary to determine whether the flows crossed the dayside OCB, therefore the lat-itude of the dayside OCB must be identified to a reasonable degree of accuracy. In our previous study we were able to as-sume the location of the OCB to be constant throughout the interval as the polar cap did not contract significantly (Im-ber et al., 2006). However in the present case the keograms (Fig. 4) show that the location of the aurora (and therefore the OCB) moves considerably during the interval and cannot be approximated to constant latitude.
We took the poleward boundary of the proton aurora, mea-sured with the SI12 camera, as a proxy for the OCB. The pro-ton auroral spot is associated with the cusps but it is unclear whether the cusp spot is on open or closed field lines, and in fact this will depend upon the reconnection mechanism that has taken place. For this analysis we have assumed that it is on open field lines, (therefore that single lobe reconnection has taken place) and have placed the boundary equatorwards of it (Fig. 6a). During dual lobe reconnection the merging gap is collocated with the OCB at the poleward edge of the proton spot, and sunward flows across this merging gap are in response to the closing of open field lines (Fig. 6b). Once this process has stopped, the OCB will not be circular therefore in order to return to an equilibrium shape the boundary will move sunwards in the noon sector, resulting in correspond-ing sunward flow signatures (Fig. 6c). These flows are not crossing the OCB itself as DLR has stopped, but instead are adiaroic, and moving with the OCB. It is not possible to dis-tinguish between the flows associated with the DLR process itself, and the ensuing adiaroic flows, as both demonstrate sunward flow, so it is not possible to observe the exact time at which DLR stops.
The latitude of the OCB at 06:00, 12:00 and 18:00 MLT was estimated from the keograms in Fig. 4 and the location of the OCB was then determined by interpolating between these latitudes at intervals of 0.25 h of MLT, estimating the location of the equatorward edge of the cusp spot from the latitude
OCB
high energy trapped electrons
merging gap (a) Single lobe reconnection
cusp spot observed polewards of the OCB but equatorwards of the merging gap
OCB merging gap
cusp spot observed equatorward of the merging gap and the OCB
(b) Dual lobe reconnection
(c) Flows observed following a burst of DLR
OCB
Fig. 6. Schematics of the Northern polar cap with noon to the top of the diagram, thick dashed lines represent the merging gap, solid lines the OCB and the black arrowed lines are flow streamlines. These demonstrate expected particle populations and ionospheric convection for (a) single lobe reconnection where twin reverse cells are observed (b) ongoing dual lobe reconnection where there is sun-ward flow across the dayside OCB (c) magnetospheric reconfigura-tion following dual lobe reconnecreconfigura-tion, where the OCB is an adiaroic boundary, i.e. there is no flow crossing the OCB.
of the poleward edge of the aurora either side of it where necessary. The estimated OCB latitudes at 06:00, 12:00 and 18:00 MLT are plotted in panels (b), (c) and (d) of Fig. 7.
The ionospheric flow across the dayside OCB can now be determined from the SuperDARN convection maps at 2 min cadence, i.e. that of the SI12 images. Figure 7a shows the velocity of the flow perpendicular to the OCB in the frame of reference of the boundary with time between 18:00 and 24:00 UT along the x axis, and magnetic local time (MLT) between 09:00 and 15:00 along the y axis. Blue contours represent sunward flow and red contours represent poleward flow. Plotted below this is the clock angle determined from the ACE spacecraft, lagged by 37.5 min to take into account
the location of ACE ∼220 REupstream. The vertical dashed
lines mark times of specific interest to be discussed later. The second vertical dashed line represents the time at which
the clock angle passed through zero. When BZ<0 (prior to
20:35 UT) there is strong antisunward flow, at times covering the entire MLT range. The strength of this flow is severely decreased when the IMF turns northward and it is only ob-served over a range of a few hours of MLT. A large patch of sunward flow is observed crossing the dayside OCB which lasts approximately 35 min and begins just prior to the clock angle passing through zero. The length of the patch of sun-ward flow is 4 h of MLT from Fig. 7a, and we assume that this represents the length of the ionospheric projection of the dual lobe merging gap. The sunward flow reached a maximum
ve-locity of 478 m s−1relative to the boundary, at 21:08 UT. We
take this signature of sunward flow across the boundary as an indication that dual lobe reconnection has taken place.
Fig. 7. (a) A contour plot showing the velocity of plasma flow across the OCB, determined from the keograms in Fig. 4. Blue represents flow equatorward while red represents flow poleward. (b), (c), (d) show the latitude of the OCB at 06:00, 12:00 and 18:00 MLT. (e) is the clock angle measured at the ACE space-craft lagged to the magnetopause. One interval of equatorward flow across the OCB can be clearly identified beginning at 20:49 UT. The first vertical dashed line marks the time at which the clock an-gle passed through −15◦, the angle at which it has been calculated that DLR would be expected to commence. The second vertical line represents the time at which the clock angle passes through zero. The third vertical line marks the time at which the IMF turns southwards and coincides with the end of the sunward flow.
3 Discussion
An interval of dual lobe reconnection has been identified using IMAGE Spectrographic Imager data and the Super-DARN radar network. The interval was selected as the clock angle observed by ACE, Geotail and WIND passed relatively slowly through zero therefore dual lobe reconnection could be expected to take place for a longer period of time than in previous studies. The OCB was identified from the SI12 images as the poleward edge of the dayside aurora and sun-ward flow crossing this boundary was observed for a period of 35 min. The OCB was observed to move poleward during the interval, indicating that a significant amount of magnetic flux was closed. A cusp auroral spot was observed to pass
through noon near the time of the onset of dual lobe recon-nection.
3.1 Constraining the clock angle
It is possible to calculate the range of clock angles within which dual lobe reconnection might be expected to occur given the length of the merging gap as described by Imber et al. (2006). Assuming that the reconnection points are
tail-ward of the cusp, at GSM Z=±10 RE and X=5 RE on the
magnetopause and having estimated the length of the merg-ing gap to be 4 h of MLT, we estimate that in this case the
threshold clock angle for dual lobe reconnection is ±15◦(as
discussed in Imber et al. (2006), Figs. 10 and 11). This is
comparable to the ±10◦determined by Imber et al. (2006).
The first vertical dashed line in Fig. 7 represents the ap-proximate time at which the clock angle passed through
−15◦. It is clear from comparing the time of the onset of
the sunward flow with the dashed line that reconnection does appear to begin promptly at the time predicted by the thresh-old clock angle calculated from the length of the merging gap. The second vertical dashed line marks the time at which
the clock angle passed through 0◦. Dual lobe reconnection
would be expected to cease when the clock angle exceeds
±15◦; at which time single lobe reconnection would be
ex-pected to recommence. The third vertical dashed line marks
the time at which the clock angle passed through 90◦, that
is the IMF turned southwards. This is the time at which the flows associated with lobe reconnection would be expected to decrease and low latitude reconnection commences. Dur-ing low latitude reconnection an IMF field line reconnects with a geomagnetic field line at the subsolar point (Fig. 1c). The first field lines to reconnect will be the ones most re-cently formed during the process of dual lobe reconnection. This means that following a southward turning of the IMF, the sense of the ionospheric dual cell convection patterns will reverse from lobe reconnection convection patterns to low latitude convection patterns and the sunward flow (inter-preted as the magnetospheric reconfiguration following the burst of dual lobe reconnection) would be expected to cease.
Comparing the time when the clock angle passes through 90◦
with the time when the sunward flow across the OCB is ob-served to cease, this does appear to be the case.
The duration of the flow was determined from Fig. 7 to be approximately 35 min. The dual lobe reconnection itself is only thought to take place while the clock angle is within
approximately 15◦of zero (∼10 min), and the sunward flow
continuing after this time is interpreted as the reconfigura-tion of the magnetosphere following the burst of dual lobe reconnection. The rearrangement of the magnetic field by DLR modifies the shape of the magnetosphere, such that it no longer presents a streamlined shape to the flow of the so-lar wind. Flows are excited within the magnetosphere to re-turn it to equilibrium (see also Cowley and Lockwood, 1992). The period of sunward flow in this interval is significantly
longer than previous studies have identified (Sandholt et al., 2000; Imber et al., 2006). This is likely to be due to the clock angle passing very slowly through zero, therefore dual lobe reconnection taking place for a longer period of time than in previous cases. The result is a larger amount of flux being closed and therefore as expected the magnetosphere takes more time to adjust to this. This theory is in agreement with the keograms (Fig. 4) which clearly show that during this event the polar cap is observed to shrink, indicating that a large amount of flux has been closed.
Previous studies (e.g. Lavraud et al., 2006) have concluded that DLR can take place for clock angles significantly larger than those identified here. It is possible that DLR continues
beyond a value of +15◦in this study as it is not possible to
determine the time that the reconnection stops. The threshold angles for which DLR takes place depends on the length and location of the merging gap in each hemisphere.
3.2 Flux capture
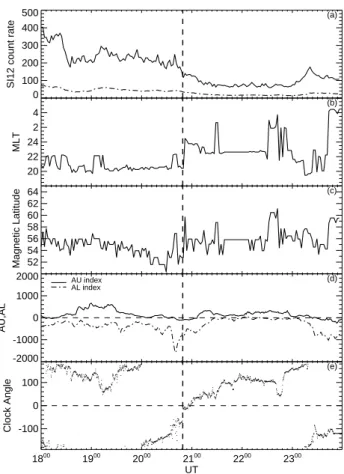
It is possible to calculate the flux closed during this burst of reconnection by integrating the electric field derived from the SuperDARN convection maps along the dayside OCB with respect to time. The total flux closed was calculated to be 0.13 GWb. Another method used to determine the flux closed during the interval is to calculate the total flux in the polar cap before the burst of reconnection began, and then recalculate it at the end of the interval. It was not possible to perform this calculation in previous studies as the amount of flux closed was so small that the polar cap was not observed to shrink. Reconnection in the tail must also be taken into considera-tion as it will also result in the polar cap shrinking. Figure 8d displays the AL and AU indices during this period, and these indicate that a substorm took place just prior to the start of our event. The maximum and mean brightness of a section of the nightside auroral oval (Fig. 3) is plotted in Fig. 8a. It suggests that the substorm activity is decreasing at the time of the onset of DLR (marked by the vertical dashed line in Fig. 8), and although substorm activity is likely to account for the shrinking of the auroral oval before the start of the in-terval, it is unlikely to account for the significant polewards motion of the OCB during the interval itself. The latitude and MLT of the area of maximum brightness are plotted in panels (b) and (c), and these demonstrate that for most of the interval this bright area remains fairly stationary. The sub-storm auroral bulge was located in the pre-midnight sector, but this fades by 20:50 UT such that the maximum bright-ness is in the midnight sector (i.e. the nightside activity level has fallen to a significantly lower level). Hence we assume that the nightside reconnection rate is small during the burst of DLR.
The polar cap contained 1.51 GWb of flux before the in-terval of reconnection, and 1.35 GWb after the inin-terval, and therefore the total flux closed during the interval is the differ-ence between these values, 0.16 GWb. Hdiffer-ence the amounts
0 100 200 300 400 500
SI12 count rate
(a) 20 22 24 2 4 MLT (b) 52 54 56 58 60 62 64 Magnetic Latitude (c) 1800 1900 2000 2100 2200 2300 UT -100 0 100 Clock Angle (e) -2000 -1000 0 1000 2000 AU,AL AU index AL index (d)
Fig. 8. (a) Maximum and mean brightness of a nightside portion of the auroral oval, this portion being outlined in Fig. 3. (b) The magnetic local time of the brightest pixel within this area (c) The magnetic latitude of the brightest pixel within the area (d) the AL and AU indices during the interval of interest (e) the clock angle measured by ACE lagged to the magnetopause. The vertical dashed line marks the onset of dual lobe reconnection as calculated from Fig. 7.
of flux closed estimated from the two methods are in close agreement, any discrepancy possibly being accounted for by ongoing nightside reconnection. These two values represent approximately 10% of the total flux in the polar cap prior to the onset of DLR, as well as corresponding to a
reconnec-tion rate of 0.13 GWb600 s ≈200 kV if it is assumed that the dual
lobe reconnection lasts 10 min. This reconnection rate is ex-tremely high when compared to results of other studies, such as Chisham et al. (2004), and serves to highlight the signif-icance of dual lobe reconnection under specific IMF condi-tions, namely a strong, northward pointing IMF.
The maximum and mean brightness of each SI12
im-age between 9.5 and 14.5 MLT and 65–75◦was determined
throughout the interval. There is a large increase in both the maximum and the mean brightness at the time of the sunward flow (Fig. 9a) due to the presence of the cusp spot. We ex-pect that single lobe reconnection is taking place throughout the interval whenever the IMF is northward. The enhanced
0 50 100 150 200
SI12 count rate
(a) 10 11 12 13 14 MLT (b) 65 70 75 80 Magnetic latitude (c) 1800 1900 2000 2100 2200 2300 UT -100 0 100 Clock Angle (e) -2000 -1000 0 1000 2000 AU index AL index (d)
Fig. 9. (a) The maximum and mean brightness of a dayside portion of the auroral oval, between 9.5 and 14.5 MLT and 65–75◦latitude. (b) The magnetic local time of the brightest pixel within this area (c) The magnetic latitude of the brightest pixel within this area (d) The AL and AU indices during the interval of interest (e) the clock angle measured by ACE, lagged to the magnetiopause. The vertical dashed line marks the onset of dual lobe reconnection.
brightening coincides with the onset of dual lobe reconnec-tion, identified in Fig. 7 and marked by the vertical dashed line. We therefore interpret this brightening as the signa-ture of additional particle flux from the Southern Hemisphere travelling up newly reconnected field lines and being de-tected in the Northern auroral oval. This provides further evidence that dual lobe reconnection has taken place. The extremely large increase in the maximum brightness sug-gests that a significant number of particles were captured onto closed field lines during the reconnection. During the interval the solar wind density fluctuates between ∼5 and
55 cm−3, therefore it is also possible that an increase in the
solar wind density could have been responsible for some of the observed brightening.
Figure 9b shows the variation in MLT of the brightest por-tion of the dayside auroral oval. During the period prior to the cusp spot (and after it has disappeared) there is no consis-tently bright location, however the formation and subsequent
0 500 1000 1500 2000 Flow speed (m s -1) (a) 0 50 100 150
Cusp spot brightness
(c) 9 10 11 12 13 14 Cusp spot MLT (d) 0 100 200 300 Alpha (degrees) (b) 2048 2100 2112 2124 2136 UT -100 0 100 Clock Angle (e)
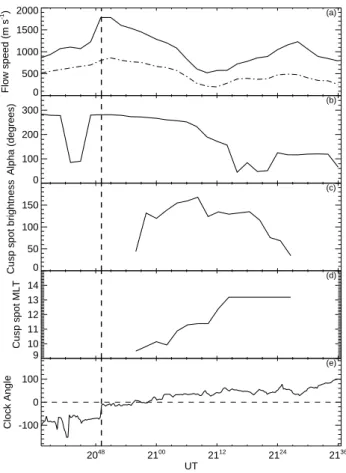
Fig. 10. (a) The maximum and mean velocity of ionospheric flow measured by the SuperDARN radars within a sector 9.5–14.5 MLT and 65–75◦magnetic latitude between 20:36 and 21:36 UT (b) The angle of the maximum velocity vector to North, clockwise in de-grees (c) The brightness of the cusp spot (d) The MLT of the cusp spot (e) The clock angle measured by ACE, lagged to the magne-topause. The vertical dashed line represents the time at which the reconnection is thought to have commenced.
duskward motion of the cusp spot is clearly visible, closely
following IMF BY as it moves from negative through to
posi-tive values. Figure 9c is the magnetic latitude of the brightest portion of the dayside auroral oval and it is clear that fol-lowing the onset of reconnection this moves poleward and remains so after the cusp spot has disappeared. This indi-cates that the polar cap has decreased in size, and therefore that significant amounts of flux have been closed by DLR.
The maximum and the mean flow speed calculated from the SuperDARN convection patterns between 9.5 and
14.5 MLT and 65–75◦ are plotted in Fig. 10a. At the
ob-served onset of the reconnection, marked by the vertical dashed line in Fig. 10, the maximum flow clearly decreases
from approximately 1800 m s−1 to 500 m s−1. Sandholt et
al. (2000) theorised that this decrease in the velocity of newly reconnected field lines could be due both to ionospheric re-sistance and the newly reconnected field lines no longer be-ing directly connected to the fast flowbe-ing magnetosheath
field. α is defined as the angle of the maximum velocity
vec-tor, measured clockwise in degrees from 0◦(North). This is
plotted in Fig. 10b, with the brightness and MLT of the cusp spot in Figs. 10c and d. These show that at the time when the cusp spot is passing through 12:00 MLT and at its brightest, the maximum and mean flows reach a minimum. The max-imum flow vectors appear also to rotate with the cusp spot,
pointing eastwards initially, passing through 180◦(Sunward)
as the cusp spot passes through 12:00 MLT, then pointing westwards. This is consistent with the expected variation in
convection as the BY component of the IMF goes from
neg-ative, through zero, to positive values.
3.3 Plasma capture
It has been postulated that dual lobe reconnection should be an extremely efficient solar wind plasma capture mechanism for the magnetosphere (Sandholt et al., 1999, 2000; Imber et al., 2006), and hence may be a mechanism for the popu-lation of the cold dense plasma sheet which sometimes oc-curs after prolonged periods of northward IMF (e.g. Øieroset et al., 2005, and references therein). Closed field lines that have undergone dual lobe reconnection will proceed into the tail. These field lines contain a large amount of solar wind plasma that was captured during DLR. This plasma would be of solar wind origin and would therefore be cold (defined by Oieroset et al. (2005) as <1 keV), and if the solar wind density was high enough and the reconnection proceeded for enough time, it is thought that sufficient particles would be captured to significantly enhance the density of the plasma sheet (Imber et al., 2006). The plasma sheet density is
usu-ally ∼0.3 cm−3and Oieroset et al. (2005) define the
thresh-old density for the cthresh-old, dense plasma sheet to be 1–2 cm−3.
Dual lobe reconnection has been observed prior to the for-mation of a cold dense plasma sheet in previous studies (e.g. Imber et al., 2006), although the exact plasma transfer mech-anism from the dayside to the tail once the plasma has been captured is as yet unclear.
It is possible to put an upper limit on the amount of plasma captured during this interval by calculating the amount of plasma on the interplanetary field lines that reconnected in both hemispheres. If the flux closed during the reconnec-tion is known, it is possible to calculate the volume of the upstream solar wind that contains this amount of flux. Then knowing the density of the solar wind from the up-stream measurements made by ACE and WIND it is pos-sible to calculate the number of particles captured during the interval. The magnetic flux closed during the reconnec-tion was calculated earlier to be ∼0.13 GWb. The equato-rial cross-sectional area of the upstream volume containing
∼0.13 GWb of magnetic flux is given by A=F/B where F
is the flux closed and B is the average BZ component of
the IMF (17.2 nT). The GSM-Z dimension of this volume is given by the distance between the two cusps, here estimated
to be ∼20 RE. Given that the upstream proton number
den-sity is 23 cm−3, the number of protons captured is of the
or-der of 2×1031. We now make the assumption that all of these
particles end up in the plasma sheet. Estimating the plasma
sheet dimensions to be 50 RE, 35 REand 5 RE in X, Y and
Z, the density of the plasma sheet would therefore increase by a factor of ∼20 to be >10 particles per cubic centimetre.
Plasma data from the LANL spacecraft (Bame et al., 1993; McComas et al., 1993) passing through the plasma sheet in-dicates that a dense plasma sheet does not appear to have been detected following this interval of dual lobe reconnec-tion. It is believed that the formation of a cold dense plasma sheet takes considerable time (Terasawa et al., 1997), and the interval between the dual lobe reconnection closing field lines on the dayside and these field lines entering the tail might be expected to be of the order of 9 h. An analysis of the IMF conditions during the event show that the sun-ward flow abruptly ends as the IMF turns southsun-ward (Fig. 7). This is thought to be because low latitude reconnection com-mences at this time and the newly closed field lines are there-fore opened again. A cold dense plasma sheet would not be expected to form in this case as the closed field lines would not have had time to convect into the tail before the onset of low latitude reconnection. This example therefore serves to show that DLR is capable of capturing sufficient plasma to populate the cold dense plasma sheet, but that crucially the IMF must remain northwards for some considerable amount of time after in order to allow the newly captured particle flux to enter the plasma sheet.
4 Conclusion
We have presented an interval of dual lobe reconnection dur-ing which a significant amount of flux is closed (∼10% of the pre-existing polar cap). Noon-midnight and dawn-dusk keograms show that the polar cap shrank visibly during the interval and although a small amount of this flux closure may be due to nightside reconnection, we have calculated that 0.13 GWb of flux are closed by the process of dual lobe re-connection. This represents significantly more flux than has been identified in previous studies. The reason for this is thought to be that the clock angle passed extremely slowly through zero and therefore the reconnection took place for longer than previously. We were also able to estimate that
∼2×1031protons were captured during the burst of dual lobe
reconnection by estimating the upstream volume of the solar wind containing the amount of magnetic flux closed during the event. This number of particles would be more than capa-ble of populating a cold, dense plasma sheet, although in this case the IMF turned southwards shortly after the occurrence of the DLR, so the newly closed flux was opened again be-fore the particles could be transferred into the plasma sheet. We can therefore conclude that in order for dual lobe recon-nection to populate the cold, dense plasma sheet, the IMF is
required to pass slowly through zero, and stay northward for a considerable amount of time afterwards.
Acknowledgements. S. Imber is supported by a PPARC
stu-dentship. B. Hubert is supported by the Belgian National Fund for Scientific Research (FNRS) and his work was supported by the PRODEX program of the European Space Agency (ESA). We would like to thank CDAWeb and the National Geophysical Data Center for access to many data sets. We would also like to thank the principal investigators of all the other instruments used in this study; N. F. Ness at Bartol Research Institute and D. J. McComas at South-west Research Institute for ACE MFI and SWE data, S. B. Mende of the University of California, Berkeley for the IMAGE FUV data, R. Lepping for the WIND MFI data, S. Kokubun for the Geotail MGF data and M. Thomsen for the LANL MPA data. We would also like to thank all of the principal investigators of the Super-DARN radars.
Topical Editor I. A. Daglis thanks P. E. Sandholt and another anonymous referee for their help in evaluating this paper.
References
Bame, S. J., McComas, D. J., Thomsen, M. F., Barraclough, B. L., Elphic, R. C., Glore, J. P., Gosling, J. T., Chavez, J. C., Evans, E. P., and Wymer, F. J.: Magnetospheric plasma analyzer for space-craft with restrained resources, Rev. Sci. Instrum., 64(4), 1026– 1033, 1993.
Chisham, G., Freeman, M. P., Coleman, I. J., Pinnock, M., Hairston, M. R., Lester, M., and Sofko, G.: Measuring the dayside recon-nection rate during an interval of due northward interplanetary magnetic field, Ann. Geophys., 22, 4243–4258, 2004,
http://www.ann-geophys.net/22/4243/2004/.
Cowley, S. W. H.: Magnetospheric and ionospheric flow and the in-terplanetary magnetic field, in: Physical basis of the Ionosphere in the Solar-Terrestrial System, AGARD CP-295, pp. 4/1–4/14, 1981.
Cowley, S. W. H. and Lockwood, M.: Excitation and decay of so-lar wind-driven flows in the magnetosphere-ionosphere system, Ann. Geophys., 10, 103–115, 1992,
http://www.ann-geophys.net/10/103/1992/.
Crooker, N. U.: Reverse Convection, J. Geophys. Res., 97, 19 363– 19 372, 1992.
Dungey, J. W.: The structure of the ionosphere, or adventures in velocity space, in: Geophysics: The Earth’s Environment, edited by: DeWitt, C., Hiebolt, J., and Lebeau, A., 526–536, Gordon and Breach, New York, 1963.
Frey, H. U., Mende, S. B., Immel, T. J., Fuselier, S. A., Claflin, E. S., G´erard, J.-C., and Hubert, B.: Proton aurora in the cusp, J. Geophys. Res., 107, 1091, doi:10.1029/2001JA900161, 2002. Huang, C., Sofko, G. J., Koustov, A. V, Andre, D. A., Ruohoniemi,
J. M., Greenwald, R. A., and Hairston, M. R.: Evolution of ionospheric multicell convection during Northward interplane-tary magnetic field with |Bz/By| >1, J. Geophys. Res., 108,
27 095–27 107, 2000.
Imber, S. M., Milan, S. E., and Hubert, B.: The auroral and iono-spheric flow signatures of dual lobe reconnection, Ann. Geo-phys., 24, 3115–3129, 2006,
http://www.ann-geophys.net/24/3115/2006/.
Kokubun, S., Yamamoto, T., Acu˜na, M. H., Hayashi, K., Shiokawa, K., and Kawano, H.: The GEOTAIL magnetic field experiment, J. Geomagn. Geoelectr., 46, 7–21, 1994.
Lavraud, B., Thomsen, M. F., Lefebvre, B., Schwartz, S. J., Seki, K., Phan, T. D., Wang, Y. L., Fazakerley, A., R`eme, H., and Balogh, A.: Evidence for newly closed magnetosheath field lines at the dayside magnetopause under northward IMF, J. Geophys. Res., 111(A5), A05211, doi:10.1029/2005JA011266, 2006. Lepping, R. P., Acuna, M. H., Burlaga, L. F., Farrell, W. M.,
Slavin, J. A., Schatten, K. H., Mariani, F., Ness, N. F., Neubauer, F. M., Whang, Y. C., Byrnes, J. B., Kennon, R. S., Panetta, P. V., Scheifele, J., and Worley, E. M.: The Wind Mag-netic Field Investigation, Space Sci. Rev., 71, 207–229, 1995. McComas, D. J., Bame, S. J., Barraclough, B. L., Donart, J. R.,
Elphic, R. C., Gosling, J. T., Moldwin, M. B., Moore, K. R., and Thomsen, M. F.: Magnetospheric Plasma Analyzer: Initial three spacecraft observations from geosynchronous orbit, J. Geophys. Res., 98, 13 453–13 465, 1993.
McComas, D. J., Blame, S. J., Barker, P., Feldman, W. C., Phillips, J. L., Riley, P., and Griffee, J. W.: Solar Wind Electron Proton Alpha Monitor (SWEPAM) for the Advanced Composition Ex-plorer, Space Sci. Rev., 86, 563–612, 1998.
Mende, S. B., Heetderks, H., Frey, H. U., Lampton, M., Geller, S. P., Habraken, S., Renotte, E., Jamar, C., Rochus, P., Spann, J., Fuselier, S. A., Gerard, J.-C., Gladstone, R., Murphree, S., and Cogger, L.: Far ultraviolet imaging from the IMAGE spacecraft. 1. System design, Space Sci. Rev., 91, 243–270, 2000.
Mende, S. B., Heetderks, H., Frey, H. U., Lampton, M., Geller, S. P., Abiad, R., Siegmund, O. H. W., Tremsin, A. S., Spann, J., Dougani, H., Fuselier, S. A., Magoncelli, A. L., Bumala, M. B., Murphree, S., and Trondsen, T.: Far ultraviolet imaging from the IMAGE spacecraft. 2. Wideband FUV imaging, Space Sci. Rev., 91, 271–285, 2000.
Milan, S. E., Lester, M., Cowley, S. W. H., and Brittnacher, M.: Dayside convection and auroral morphology during an interval of Northward interplanetary magnetic field, J. Geophys. Res., 105, 15 741–15 755, 2000.
Milan, S. E., Lester, M., Cowley, S. W. H., Oksavik, K., Brittnacher, M., Greenwald, R. A., Sofko, G., and Villain, J.-P.: Variations in polar cap area during two substorm cycles, Ann. Geophys., 21, 1121–1140, 2003,
http://www.ann-geophys.net/21/1121/2003/.
Øieroset, M., Sandholt, P. E., Denig, W. F., and Cowley, S. W. H.: Northward interplanetary magnetic field cusp aurora and high-latitude magnetopause reconnection, J. Geophys. Res., 102(A6), 11 349–11 362, 1997.
Øieroset, M., Raeder, J., Phan, T. D., Wing, S., McFadden, J. P., Li, W., Fujimoto, M., R`eme, H., and Balogh, A.: Global cooling and densification of the plasma sheet during an extended period of purely Northward IMF on October 22–24, 2003, Geophys. Res. Lett., 32, L12S07, doi:10.1029/2004GL021523, 2005.
Østgaard, N., Mende., S. B., Frey, H. U., and Sigwarth, J. B.: Simul-taneous imaging of the reconnection spot in the opposite hemi-spheres during Northward IMF, Geophys. Res. Lett., 32, L21104, doi:10.1029/2005GL024491, 2005.
Reiff, P. H. and Burch, J. L.: IMF By-dependent plasma flow and Birkeland currents in the dayside magnetosphere: 2. A global model for Northward and southward IMF, J. Geophys. Res., 90, 1595–1609, 1985.
Ruohoniemi, J. M. and Baker, K. B.: Large-scale imaging of high-latitude convection with Super Dual Auroral Radar Network HF radar observations, J. Geophys. Res., 103, 20 797–20 811, 1998. Russell, C. T.: The configuration of the magnetosphere, in: Crit-ical Problems of Magnetospheric Physics, edited by: Dyer, E. R., Inter-Union Comm. on Sol. Terr. Phys., Natl. Acad. of Sci., Washington, D.C., 1972.
Sandholt, P. E., Farrugia, C. J., Cowley, S. W. H., Denig, W. F., Lester, M., Moen, J., and Lybekk, B.: Capture of magnetosheath plasma by the magnetosphere during Northward IMF, Geophys. Res. Lett., 26, 2833–2836, 1999.
Sandholt, P. E., Farrugia, C. J., Cowley, S. W. H., Lester, M., Denig, W. F., Cerisier, J.-C., Milan, S. E., Moen, J., Trondsen, E., and Lybekk, B.: Dynamic cusp aurora and associated pulsed re-verse convection during northward interplanetary magnetic field, J. Geophys. Res., 105, 12 869–12 894, 2000.
Smith, C. W., Acuna, M. H., Burlaga, L. F., L’Heureux, J., Ness, N. F., and Scheifele, J.: The ACE Magnetic Fields Experiment, Space Sci. Rev., 86, 611–632, 1998.
Song, P. and Russell, C. T.: Model of the Formation of the Low-latitude Boundary Layer for Strongly Northward Interplanetary Magnetic Field, J. Geophys. Res., 97, 1411–1420, 1992. Stone, E. C., Frandsen, A. M., Mewaldt, R. A., Christian, E. R.,
Margolies, D., Ormes, J. F., and Snow, F.: The Advanced Com-position Explorer, Space Sci. Rev., 86, 1–22, 1998.
Terasawa, T., Fujimoto, M., Mukai, T., Shinohara, I., Saito, Y., Ya-mamoto, T., Machida, S., Kokubun, S., Lazarus, A. J., Steinberg, J., T., and Lepping, R. P.: Solar Wind Control of Density and Temperature in the Near-Earth Plasma Sheet: WIND-GEOTAIL Collaboration, Geophys. Res. Lett., 24, 935–938, 1997.