HAL Id: lirmm-01064247
https://hal-lirmm.ccsd.cnrs.fr/lirmm-01064247
Submitted on 15 Sep 2014
HAL is a multi-disciplinary open access
archive for the deposit and dissemination of sci-entific research documents, whether they are pub-lished or not. The documents may come from teaching and research institutions in France or abroad, or from public or private research centers.
L’archive ouverte pluridisciplinaire HAL, est destinée au dépôt et à la diffusion de documents scientifiques de niveau recherche, publiés ou non, émanant des établissements d’enseignement et de recherche français ou étrangers, des laboratoires publics ou privés.
Non-invasive devices and methods for large animal
monitoring using automated video processing
Fabienne Porée, Vincent Creuze, Marie-Laure Specq, Nathalie Samson,
Jean-Paul Praud, Guy Carrault
To cite this version:
Fabienne Porée, Vincent Creuze, Marie-Laure Specq, Nathalie Samson, Jean-Paul Praud, et al.. Non-invasive devices and methods for large animal monitoring using automated video processing. Innovation and Research in BioMedical engineering, Elsevier Masson, 2014, 35 (4), pp.173-181. �10.1016/j.irbm.2014.02.002�. �lirmm-01064247�
Non invasive devices and methods for large animal monitoring
using automated video processing
F. Poréea,b, V. Creuzec, M.-L. Specqd, N. Samsond, J.-P. Prauddand G. Carraulta,b
Addresses:
a Laboratoire Traitement du Signal et de l’Image (LTSI), Université de Rennes 1, Campus de Beaulieu,
35042 Cedex, Rennes, France
bINSERM, U1099, Université de Rennes 1, Campus de Beaulieu, 35042 Cedex, Rennes, France cLIRMM, Université de Montpellier 2, CNRS, 161 rue Ada, 34095 Montpellier Cedex 5, France
dDepartments of Pediatrics and Physiology, Université de Sherbrooke, 3001 12th North Avenue, Sherbrooke
(QC), Canada
Corresponding author: Fabienne Porée
Laboratoire Traitement du Signal et de l’Image (LTSI), Université de Rennes 1, Campus de Beaulieu, 35042 Cedex, Rennes, France
Tel.: +33-2-23-23-62-24; Fax: +33-2-23-23-69-17
Abstract
Objectives:It is now standard for polysomnographical equipment to include video recording, although this modality is generally underexploited, since there is no automated processing associated with the latter. In the present report, we investigated the set of features that can be automatically extracted from a video recording, in the context of monitoring of freely moving, non-sedated, newborn lambs.
Material and methods: Our database contained seven lambs and a total of 11 recordings, using two dif-ferent cameras allowing a top view and a side view. Using appropriate methodologies, we show that it is possible to estimate the lamb’s movements, its posture (standing or lying) as well as its covered trajectory. Results: Results are discussed as a function of the camera and show that side view recording is well suited for accurate scoring of the lamb’s posture, whereas trajectory is best estimated using the top view camera. On the other hand, both cameras provide qualitatively similar results for the estimation of movement of the animals.
Conclusion: The data gained from automated video processing, as reported herein, may have multiple applications, especially for animal studies, but may also be extended to human sleep monitoring.
1. Introduction
Better understanding and treatment of disorders of cardiorespiratory control in newborns and infants still offer many challenges. The latter include prevention and treatment of frequent disorders such as apneas of prematurity [1] and apparent life-threatening events in infants [2], as well as prevention of sudden infant death syndrome [3]. Given the limitation of research protocols feasible in human infants, an important part of our research program focuses on the study of various newborn lamb models, mimicking conditions we encounter daily in human infants [4, 5]. Most of our lamb studies necessitate prolonged monitoring for hours throughout the various states of consciousness, which can be repeated along several days. We systematically use a custom-made radiotelemetry system for polysomnography (PSG) recording, which allows the monitoring of an extensive number of electrophysiological signals 24 hours a day [6].
The wealth of data collected during such prolonged PSG first led us to search for a simple means to recognize the standing posture in lambs, in order to ascribe wakefulness to these time epochs. In addition, the recent need to further assess movement activity, as well as tracking locomotor activity, led us to review the available options for studying movements. Changes in body position from lying to standing posture in the lamb have previously been recorded by a pressure catheter attached to the back of the animal or inserted intravasculary, meaning that the lamb is tethered to a pressure gauge [7]. While actimetry has been successfully used to quantify movement activity over several days in lambs, it is however unable to track locomotor activity [8]. To our knowledge, available photobeam chambers, e.g. from San Diego Instruments, San Diego, CA, USA or Med Associates, Inc., St. Albans, VT, USA, can monitor locomotor activity in rodents only [9]. Force and pressure plates can track locomotor activity in large animals, however these sophisticated techniques are better suited for fine analysis of gait kinetics [10]. Finally, thermic camera recordings have been used to acquire trajectory in rats.
From the early days of physiology, direct visual observation has been an important component of ex-perimental methods to document a subject’s behavior. Over time, interpretation of recordings of multiple physiological signals, such as PSG, has largely benefited from the association of behavioral criteria and electrophysiological criteria for sleep staging. Technical advances have allowed the development of various video-monitoring systems with working capabilities under both daylight as well as infrared illumination. As recommended by current guidelines, (e.g. ASTA/ASA Addendum to AASM Guidelines for Recording and Scoring Sleep (Paediatric Rules, 2011), it is now standard for PSG equipment to include video recording, in order to visually document movements and posture during sleep in humans. Review of the literature reveals
a high number of studies dealing with the use of visual analysis of video monitoring for sleep staging in humans [11, 12, 13] and animals [14, 15] or for studying movements during sleep in children with hyper-activity disorder [16]. Finally, more recent works highlight the potential of automated video processing for movement and posture detection in the context of sleep disorders [17, 18, 19], epilepsy [20, 21, 22, 23] or activity detection [24, 25, 26]. As a result, video recording thus appeared as a simple, inexpensive and non-invasive approach seemingly capable of fulfilling several research needs.
Video-monitoring systems, such as Ethovision XT7 (Noldus, Wageningen, The Netherlands), ANY-maze (Wood Dale, IL, USA) or Stereoscan (Clever Sys, Reston, VA, USA) are also used for the automated tracking and analysis of movement, activity, and behavior of any animal types, including from drosophila and zebrafish to farm animals in all forms of enclosures [27, 28, 29, 30, 31, 32, 33]. Such systems can be used to calculate movement velocity and distance travelled as well as to record the trajectory of a moving animal under various conditions [34, 35, 36]. They are however fairly complex and do not allow to recognize standing from lying postures.
The present work proposes a system including the devices and the methods allowing to extract a set of parameters and informations on the activity and behavior of non-sedated, freely moving lambs, using video monitoring. For this purpose, three methods were developed in order to: 1) estimate movement, 2) differen-tiate between standing and lying postures, and 3) characterize locomotor activity of a freely moving animal in an enclosure. Two infrared cameras were used and, based on literature review, different video processing methods were implemented in order to assess the contribution of top and side views individually as well as in combination. These methods present a real advantage since they were adapted to work automatically for any protocol and animal. They also present substantial time savings considering that such experiments are often time consuming and require extensive experience. In addition, while this study shows the application to monitoring of lambs, it can be applied to other types of animals.
This paper is organized as follows. Devices and methods are detailed in section 2. Section 3 outlines the protocol, the database and the results. A discussion upon the methods and the results is driven in section 4. Finally, section 5 gives the conclusion and discusses several real-life context applications in order to underline the interest of the approach.
2. Device and methods
The full system that we developed includes the device and the video analysis methods. They are de-scribed hereafter.
2.1. Device
In order to obtain a good view of the animal, the device was composed as follows:
• The studied lamb was housed in a Plexiglas chamber, with a surface of 1.3 m2, where it could move freely and have access to food and drink.
• Since experiments took place during night or in obscurity, the enclosure was illuminated by an infrared lamp (IR).
• Two infrared-sensitive video cameras were installed to record the scene. One was located above the chamber, looking downwards (top view of the scene), and the other facing the chamber, thus giving a side view of the scene.
• The lamb was equipped with a tag, a black square with sides of 5 cm, affixed on the back, to follow the animal in the top view case. The size of the marker has been chosen according to the following two constraints. Not only it has to be maximized in order to ease its detection (especially when it is tilted) in spite of the bad imaging conditions (low resolution webcam with poor lighting conditions), but it also has to fit in the limited available area on the scientific instrumentation bag fastened onto the back of the lamb (see Figure 9). The lamb had also been surgically instrumented with several electrodes and sensors to collect physiological signals for another study, which is out of the scope of the present article.
2.2. Video analysis methods
After the recordings of videos of the animal, different types of information may be extracted in order to obtain a global and detailed interpretation of its behavior, for long durations. For this purpose, we propose to estimate three features of the animal’s behavior:
• the movement which quantifies the amount of activity during the experiment,
• the posture which completes the precedent and provides information on alternation of sleep/wake stages (since an animal does not sleep while standing in general),
• the locomotor activity which allows to characterize all the parameters related to the activity of the animal (such as explored surface, covered distance, etc.).
Depending on the features, either top view, side view or both cameras may be used.
Methodological approaches developed to reach these goals are detailed below. Some of them can be viewed as a real time adaptation of existing methods where a training step has been added to automate the analysis.
2.2.1. Estimation of movement
Different types of approaches may be used to estimate the movement from videos, the most common being based on time differencing and optical flow methods [37]. Here we selected the first approach for its simplicity and reduced computational costs. The algorithm, that can be applied either to the side view or the top view camera, is detailed in Figure 1. An example generated from a side view recording is shown in Figure 2.
input frame fi
= grayscale conversion of fi
mi = absolute difference between
current frame and previous frame
mib = binary thresholding and
erosion of mi
ni = white pixels count corresponding to movements
between fi-1 and fi
input frame fi-1
= grayscale conversion of fi-1 fi-1 g fig fig fi-1 g
Figure 1: Flowchart detailing the algorithm applied to videos to estimate movement activity between frames fi−1and fi.
The movement between frames fi−1(Figure 2.a) and fi(Figure 2.b) acquired at times ti−1and ti
respec-tively is estimated for each pixel (x,y) as follows:
mi(x,y) =| fig(x,y) − f g i−1(x,y) | (1) where fg i (and f g
i−1) is the grayscale version of the color frame fi(and fi−1) from the input video file. Indeed, using colors is meaningless with infrared light, and this technique substancially decreases the computational cost.
(a) previous frame fi-1 (b) current frame fi
(c) mi= fi (d) mib = binarization and erosion of mi
g
− fi−1g
Figure 2: Previous (a) and current (b) frames ( fi−1and fi) and (c) the resulting absolute difference mi. (d) Eroded binary value mbi
of frame mi.
Frame mi (Figure 2.c) which is a grayscale image, is then: i) thresholded to allow conversion into a
binary frame and ii) eroded to reduce noise influence. The resulting frame mb
i (Figure 2.d) is such that white
(black) pixels correspond to pixels whose value has (not) changed since last sampling time ti−1. The number
ni of white pixels is recorded and represents the magnitude of the animal’s movement between frames fi−1 and fi.
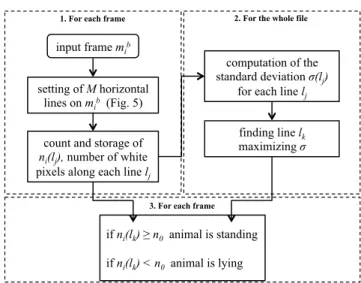
2.2.2. Posture detection
Posture detection problem was addressed with the side view. The first step of the algorithm relies on the detection of movement presented in section 2.2.1. The second step is illustrated in Figure 3 and detailed thereafter.
To ascertain whether the animal is standing or lying, the number of white pixels along a given horizontal line, placed approximately to the height of its back, is quantified. Therefore, if a sufficient amount of white pixels of mb
i are retrieved along this line, it means that the animal is standing. Otherwise, it is considered as
lying.
input frame mib
setting of M horizontal lines on mib (Fig. 5)
count and storage of ni(lj), number of white
pixels along each line lj
1. For each frame
finding line lk
maximizing σ computation of the standard deviation σ(lj)
for each line lj
if ni(lk) ≥ n0 animal is standing
if ni(lk) < n0 animal is lying
2. For the whole file
3. For each frame
Figure 3: Flowchart detailing the algorithm applied to a side view video to detect the animal’s posture. following adaptive law, for each frame mb
i:
• M horizontal lines (l1to lM) are placed regularly on the frame, as depicted on Figure 4.
! !!! ! !! ! !!
Figure 4: M horizontal lines l1to lMare placed on mbi. The line that will be used to determine between the standing and the lying
postures is called lk.
• Along each line lj( j = 1,. . . ,M), the number of white pixels ni(lj) is computed. Subsequently, once the whole file has been processed:
• For each line lj, the standard deviation σ(lj) of ni(lj), the number of white pixels for all the frames mbi, is computed.
• The line lk that will be used to determine between the standing and the lying postures is the line that
maximizes the standard deviation:
lk= arg max j∈[1,M]
This expression is justified by the fact that the strongest variations in the number of white pixels (from zero when the lamb is lying to its maximum when it is standing) are observed for line lk, corresponding
to the very top of the back of the lamb. On the contrary, in the lower part of the frame, the number of white pixels is always large, irrespective of the lamb’s posture. Likewise, lines located above lkhave smaller
values of standard deviation as they, at most, only correspond to the head of the lamb.
Once lkhas been identified, for each frame mbi, the standing (or lying) posture is determined if the number
of white pixels along lk, ni(lk), is greater (lower) than a threshold n0. The value of n0can be obtained from
the histogram of the values ni(lk).
Let us note that Figure 4 corresponds to the detection of a standing posture. One can see both the current silhouette of the lamb and its silhouette at the previous frame. This latter remains visible due to the differentiation between the previous and the current frame.
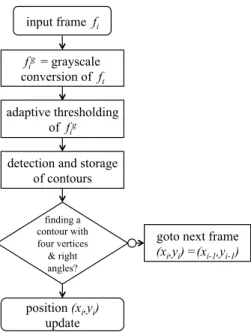
2.2.3. Characterization of locomotor activity
In order to characterize the locomotor activity of the lamb, we proceeded with only top view recordings, since a top view obviously provides a higher visibility of the animal moving in the chamber. For this purpose, we propose a method based on the detection of a marker. However, preliminary tests having demonstrated that standard markers (e.g. ARTag [38]) cannot be properly detected due to the poor quality of video recordings (low resolution, high compression, high noise due to the IR sensor), we conducted experiments with a basic black square marker affixed to the back of the lamb.
The method used to detect the marker is summarized by the flowchart depicted in Figure 5. Firstly, to deal with the issue of strong illumination variations of the scene (only one IR lamp), color images are transformed to grayscale images and then to binary images by applying an adaptive threshold, depending of the neighborhood of each pixel [39]. Secondly, in order to detect the square marker, we use a Canny edge detection, followed by a Hough transform to localize the four sides of the marker (see segmentation and line fitting methods in sections 5 and 10 of [37]). The Canny edge detector is very well suited to our IR images, as it includes a noise reduction. Then, we ascertain whether angles between joint edges are approximately 90 degrees. Thereafter, the trajectory is obtained by storing, for each frame, the (xi,yi) position of the center of the marker. If the marker is not detected (e.g. when the lamb is lying), the position is recorded as unchanged and therefore (xi,yi) = (xi−1,yi−1).
Then, from the two-dimensional vector (X,Y) = [(x1,y1), . . . , (xN,yN)], of the estimated trajectory, where N is the total number of frames of the video file, it is therefore possible to compute the distance
input frame fi
fig = grayscale conversion of fi adaptive thresholding
of fig detection and storage
of contours finding a contour with four vertices & right angles?
goto next frame
(xi,yi) =(xi-1,yi-1)
position (xi,yi) update
Figure 5: Flowchart of the algorithm applied to top view video to estimate the animal’s trajectory.
Dcovered by the lamb by:
D= N
∑
i=2 q ( ¯xi− ¯xi−1)2+ ( ¯yi− ¯yi−1)2 (3)where ¯xi and ¯yi are the low pass filtered versions of xi and yi respectively, in order to significantly reduce
the influence of measurement noise. These values are obtained by means on sliding windows. This distance is first measured in pixels, which allows quantitative comparison of different videos as long as they are performed with the same camera. Then, the value in meters can be retrieved after calibration of the camera (intrinsic parameters).
Finally, the utilization distribution, which depicts the map representing the frequency of presence of the lamb on each pixel, can also be estimated by using kernel density methods [40].
3. Results
3.1. Protocol and video recordings database
Experiments (described in section 2.1) were conducted in the animal facilities dedicated to ovine re-search at the Faculty of Medicine and Health Sciences, Université de Sherbrooke. The Plexiglas chamber was in conformity with the requirements of the Canadian Committee for Animal Care and the protocol was approved by the Ethics Committee for Animal Care and Experimentation of the Université de Sherbrooke.
A total of 11 color video recordings, obtained with seven different lambs, were acquired, with three types of IR cameras, along with several image sizes, resolutions and qualities (compression), representing
more than 50 hours of experimentation. In addition, amongst the 11 recordings, six (three top view and three side view) were synchronously performed.
Table 1 summarizes the technical features of the video files studied. Table 1: Summary of technical features of video files.
Top view Side view
Number of videos 4 7
Duration Total (h) 16.9 33.6
of Mean ± std (h) 4.2 ± 5.5 4.8 ± 5.2
recordings Range (h) 0.2 - 12.0 0.4 - 16.0
Video resolution (pixels) 320x240 or 640x480
Video bit rates (kbps) 185 or 1900
Number of frames per second 30
Codec WMV7
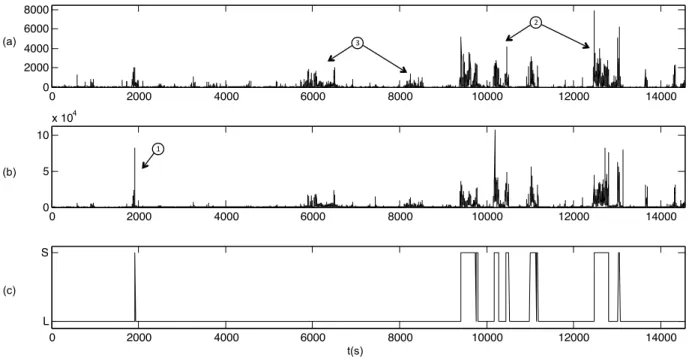
3.2. Estimation of movement
Movement can be estimated using either a top view camera or a side view camera. Figure 6 illustrates an example; identical results were observed for all videos. It shows the detection obtained from the top view video (Figure 6(a)) and the side view video (Figure 6(b)), during the same experiment. The manual scoring of standing/lying postures was added in Figure 6(c) for purposes of discussion of the results.
By comparing Figures 6(a) and (b), we observe that the two series are similar and lead to the same interpretation. However, small differences can be pointed, as in Figure 6(b) corresponding to short1 vertical movement, that are more visible with the side view compared to the top view. Movements occurring when the lamb is standing lead for the most part to higher values (see in Figure 6(a)), since they mostly2 correspond to walking. By contrast, movement measured when the lamb is lying are of low amplitude (see
3
in Figure 6(a)) and are related to head movements.
3.3. Posture detection
3.3.1. Optimization of the parameters
As reported in the methods section, we propose an original and automatic procedure to adjust the line maximizing the standard deviation. This line is chosen between M lines preliminary placed on the frames.
Firstly, this number M was optimized on the seven side view video recordings. For this purpose, we computed, as a function of the number of horizontal lines extending from 5 to 25, the concordance (in %) between manual and automated scoring, i.e. the percentage of time for which the posture (standing or lying)
t (s)! (a) (b) 0 2000 4000 6000 8000 10000 12000 14000 0 2000 4000 6000 8000 0 2000 4000 6000 8000 10000 12000 14000 0 5 10 x 104 0 2000 4000 6000 8000 10000 12000 14000 L S (c) 1" 3" 2" (a) (b) (c) t(s)
Figure 6: Movement detection from top view (a) and side view (b) during the same experiment (duration: 4 hours). (c) gives the postures of the lamb (L: lying, S: standing).
is correctly detected by automated scoring (compared with manual scoring, considered as the truth). Results are plotted in Figure 7. The curves show that below 15 lines, concordance is consistently insufficient. Then, depending on the video, a gap is observed between 15 and 18 lines, reaching performances nearing 100%. For this reason, we adjusted the number of lines to 20.
Secondly, Figure 8 illustrates an example of an experiment aimed at estimating the optimal line lk,
that will be used to discriminate standing and lying postures. By examining the evolution of the standard deviation of the number of white pixels on each line, its maximum is reached with line l14, corresponding to the best position of the horizontal line.
3.3.2. Performances
The method used to detect the lamb’s posture was evaluated on the seven side view video recordings. For each of these recordings, a visual scoring (i.e. human scoring) was performed and used as a reference to estimate the automated scoring performances. It is worthwhile to note that the scoring of standing and lying postures has been performed by only one scorer since it was not considered as a scorer-dependent task.
The performances of the automated scoring relative to the visual scoring have been subsequently com-puted. These scores (in percentage) summarized in Table 2 include: (1) standing scored as standing (%S sc
5 10 15 20 25 0 20 40 60 80 100 conc orda nc e (%) number of lines
Figure 7: Optimization of the number of lines performed on the seven side view video recordings.
0 5 10 14 15 20 0 5 10 15 20 25 30 35
Standard deviation of the number of white pixels detected along horizontal lines
line number st a n d a r d d e v ia ti o n line number std of t he num be r of w hi te pi xe ls
Figure 8: Standard deviation of the number of white pixels along each horizontal line (l1to l20) computed for the entire video.
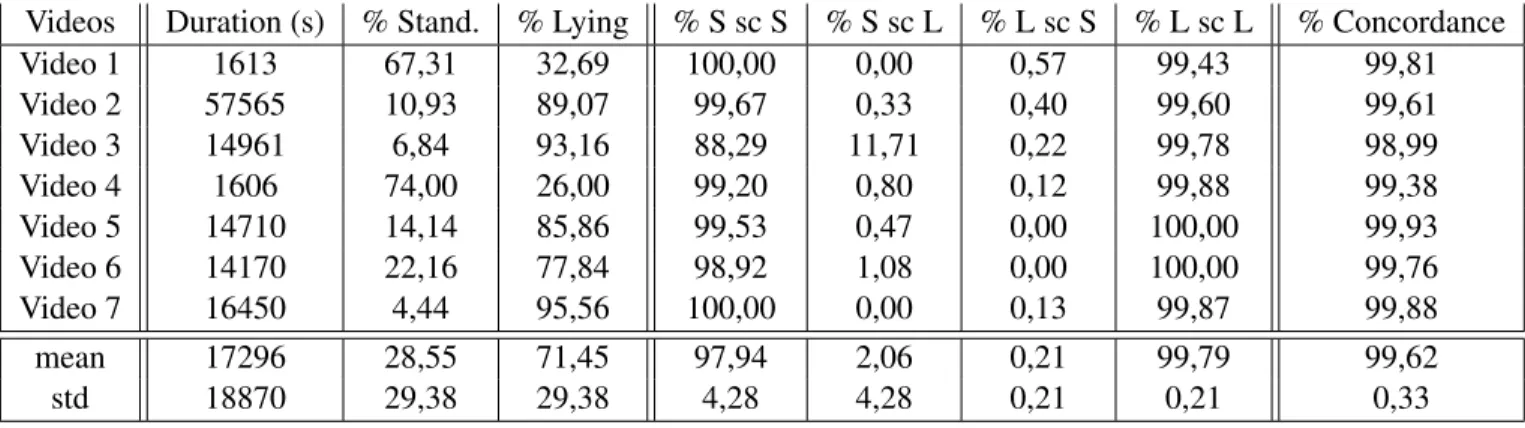
Table 2: Performances for lamb’s posture scoring using a side view camera (in %). S: standing, L: lying.
Videos Duration (s) % Stand. % Lying % S sc S % S sc L % L sc S % L sc L % Concordance
Video 1 1613 67,31 32,69 100,00 0,00 0,57 99,43 99,81 Video 2 57565 10,93 89,07 99,67 0,33 0,40 99,60 99,61 Video 3 14961 6,84 93,16 88,29 11,71 0,22 99,78 98,99 Video 4 1606 74,00 26,00 99,20 0,80 0,12 99,88 99,38 Video 5 14710 14,14 85,86 99,53 0,47 0,00 100,00 99,93 Video 6 14170 22,16 77,84 98,92 1,08 0,00 100,00 99,76 Video 7 16450 4,44 95,56 100,00 0,00 0,13 99,87 99,88 mean 17296 28,55 71,45 97,94 2,06 0,21 99,79 99,62 std 18870 29,38 29,38 4,28 4,28 0,21 0,21 0,33
S), (2) standing scored as lying (%S sc L), (3) lying scored as standing (%L sc S), (4) lying scored as lying (%L sc L), and (5) global concordance (% Concordance). The total duration and the percentage of time standing and lying are provided for each video. In addition, the mean and standard deviation of the values obtained with the seven recordings are computed. Results show that the lying posture was consistently well detected, with a mean concordance of 99.79% between the automated and the visual scoring. With regard to the standing posture, values were slightly lower, although primarily due to video 3, where 11.71% of stand-ing was scored as lystand-ing. These errors were due to external experimental disturbances (lightstand-ing modifications and passing of people in front of the camera).
We can remark that columns 5 and 8 of Table 2 can be interpreted as sensibility and specificity values, if we consider the problem of the detection of the standing posture (and the contrary for the detection of the lying posture).
3.4. Characterization of locomotor activity
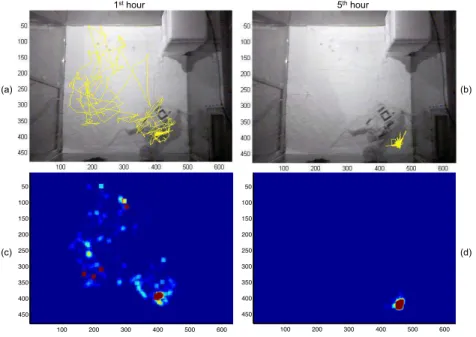
Two examples of a one-hour long trajectory (the first and the fifth from video 5) are depicted in Figures 9 (a) and (b). The first example corresponds to a sequence when the lamb was awake and walked a great deal, whereas in the second example, the lamb was quiet and lying.
1st hour 5th hour 100 200 300 400 500 600 50 100 150 200 250 300 350 400 450 100 200 300 400 500 600 50 100 150 200 250 300 350 400 450 1st hour 5th hour (a) (c) (b) (d)
Figure 9: Top: two examples of one-hour long trajectory. (a) 1st hour, (b) 5th hour of the experiment. Bottom (c) and (d): Corresponding maps representing the frequency of presence of the lamb on each pixel.
Then, from the trajectories, the distance (see eq. 3) covered by the lamb was computed and yielded 17.9 m and 0.5 m respectively.
Finally, Figures 9 (c) and (d) illustrate the utilization distribution applied to the same videos and allows to obtain a complementary view of the lamb’s activity during an experiment.
4. Discussion
In the present study, we proposed a full system including the devices and the methods allowing to extract a set of parameters and informations on a large animal protocol, by the use of the video. We showed that, using two different cameras, it is possible to estimate the posture (standing or lying), the movement as well as the locomotor activity of a large animal, a lamb in this experiment.
Lamb posture scoring was performed with the side view. The first step of the algorithm relies on the detection of movement method, computing absolute difference between successive frames. The second step consists in counting the number of white pixels crossing an horizontal line placed to the height of the lamb’s back. Consequently, a time delay corresponding to less than one sampling period affects the scoring each time the lamb is lying down. In such instances, the binary frame shows white pixels (i.e. motion) corresponding to both previous standing posture and current lying posture. On the other hand, this phenomenon understandably does not imply any delay when the lamb is standing up. If the posture detection need to be precisely estimated, it is necessary to correct the scoring files at the end of the processing.
When comparing the automated to the manual scoring, we obtained a concordance of 99.62%. These results are of notable interest since they show that video recording appears as a non-invasive, fast, and robust alternative for observing the evolution of the lamb’s posture for long experiments. From this, it is also possible to quickly compute percentages of standing or lying times. In addition, they suggest that the pressure catheter attached to the animal’s back in [7], initially used to isolate the lying stages, could be removed and replaced by this video processing.
Characterization of the locomotor activity was obtained with the top view, applying a method based on the detection of a square marker affixed on the back of the lamb. As the marker is fixed on the animal, the measured trajectory is more accurate than it would be with a method based on the center of gravity of the movement (which does not always correspond to the same area of the body) or even with a method based on shape recognition. In fact, these latter methods can lead to erroneous locomotor activity detection when the animal is lying and only moving its head or legs.
However, the estimation of movement was realized using either side view, either top view, both yielding qualitatively similar results. Nevertheless, it is important to notice that the lamb’s posture cannot be directly estimated from the movements, since absence of movement may be encountered when the lamb is standing as well as when it is lying.
Finally, it is important to note that the proposed approach does not require any knowledge of the back-ground of the observed scene. The latter can even change during the sequence without decreasing the accu-racy. Moreover, these proposed methods have a training step that eliminates the need for manual tuning. It is also worthwhile to note that it can process in real-time, except during the training period of the threshold detection used for the differentiation of the standing and lying postures. The time needed to analyse a one hour long video record is only 41 s for the side view, and 310 s for the top view, which implies more complex computations (values measured on a Dell Latitude E6230 laptop, with an Intel Core (TM) i7-3520M CPU running at 2.90 GHz under Microsoft Windows 7 Operating System).
In a practical use, depending of the objective of the study, different cases may be envisaged. With a top view camera, it will be possible to obtain the estimation of the movement and the locomotor activity. With a side view camera, it will be possible to obtain the estimation of the movement and the posture. If both posture and trajectory have to be estimated, it will be necessary to place two cameras and synchronize both recordings before the processing step.
5. Conclusion
The system presented here is currently being used at the Université de Sherbrooke in the context of polysomnography studies. But, data gained from automated video processing, as reported in the present study, could have multiple applications, as exemplified below. Accurate detection of standing posture by a side view camera will be invaluable for the automated scoring of sleep, by immediately allowing to recognize time epochs where lambs are standing as wakefulness. Quantification and pattern recognition of movement and locomotor activity by a combination of a side view camera and/or a top view camera will be of valuable assistance to characterize signs pertaining to the lamb’s welfare and good health, e.g., in the days following surgical instrumentation or after weaning from total liquid ventilation to spontaneous respiration in models of respiratory distress [41]. In addition, they will assist in recognizing abnormal neurological status, e.g. after exposure to toxic substances such as cigarette smoke [42] or polybrominated diphenyl ethers (PBDE) [43] in lambs.
These proposed methods can obviously be extended to other animals, for example for monitoring re-habilitation in cats with spinal cord injury, a promising area of translational research [44]. They can also be adapted for monitoring in humans, from newborns to adults. Several parts of the proposed algorithms would be useful for processing videos acquired in patients with epilepsy or various sleep disorders, as well as for the monitoring of falling persons. We are particularly interested in the video-monitoring of newborns and young infants, when sleep stages are often defined according to their behavior [45]. Interestingly, the non-invasiveness of our present video methods would allow to remove some sensors and improve neonatal well-being, which constitutes a crucial component of neonatal care nowadays [46].
Acknowledgment
This work was supported by the FRSQ - INSERM Program for Short-term Exchanges. J.-P. Praud is the holder of the Canada Research Chair in Neonatal Respiratory Physiology and a member of the FRSQ-funded Centre de recherche clinique Étienne-Le Bel, Sherbrooke University Hospital.
References
[1] Zhao, J., Gonzalez, F., Mu, D.. Apnea of prematurity: from cause to treatment. European journal of pediatrics 2011;170(9):1097–1105.
[2] Fu, L.Y., Moon, R.Y.. Apparent life-threatening events an update. Pediatrics in Review 2012;33(8):361–369.
[3] Fish, F.A., Kannankeril, P.J.. Diagnosis and management of sudden death in children. Current Opinion in Pediatrics 2012;24(5):592–602.
[4] Boudaa, N., Samson, N., Carrière, V., Germim, P.S., Pasquier, J.C., Bairam, A., et al. Effects of caffeine and/or nasal cpap treatment on laryngeal chemoreflexes in preterm lambs. Journal of Applied Physiology 2013;114(5):637–646.
[5] Beuchée, A., Hernández, A.I., Duvareille, C., Daniel, D., Samson, N., Pladys, P., et al. Influence of hypoxia and hypercapnia on sleep state-dependent heart rate variability behavior in newborn lambs. Sleep 2012;35(11):1541.
[6] Samson, N., Dumont, S., Specq, M.L., Praud, J.P.. Radio telemetry devices to monitor breathing in non-sedated animals. Respiratory Physiology & Neurobiology 2011;179(2-3):111–8.
[7] Grant, D.A., Davidson, T.L., Fewell, J.E.. Automated scoring of sleep in the neonatal lamb. Sleep 1995;18:439–45.
[8] Rurak, D., Fay, S., Gruber, N.. Measurement of rest and activity in newborn lambs using actigraphy: studies in term and preterm lambs. Reproduction, Fertility and Development 2008;20(3):418–430. [9] Chang, W.L., Breier, M.R., Yang, A., Swerdlow, N.R.. Disparate effects of pramipexole on
lo-comotor activity and sensorimotor gating in Sprague-Dawley rats. Pharmacology Biochemistry and Behavior 2011;99(4):634–8.
[10] Oosterlinck, M., Pille, F., Huppes, T., Gasthuys, F., Back, W.. Comparison of pressure plate and force plate gait kinetics in sound warmbloods at walk and trot. The Veterinary Journal 2010;186(3):347–51.
[11] Anders, T.F., Sostek, A.M.. The use of time lapse video recording of sleep-wake behavior in human infants. Psychophysiology 1976;13(2):155–158.
[12] Fuller, P., Wenner, W., Blackburn, S.. Comparison between time-lapse video recordings of behavior and polygraphic state determinations in premature infants. Psychophysiology 1978;15(6):594–8. [13] Morielli, A., Ladan, S., Ducharme, F., Brouillette, R.. Can sleep and wakefulness be distinguished
in children by cardiorespiratory and videotape recordings? CHEST 1996;109(3):680–7.
[14] Balzamo, E., Van Beers, P., Lagarde, D.. Scoring of sleep and wakefulness by behavioral analysis from video recordings in rhesus monkeys: comparison with conventional EEG analysis. Electroen-cephalography and Clinical Neurophysiology 1998;106(3):206–12.
[15] BuSha, B., Leiter, J.C., Curran, A.K., Li, A., Nattie, E.E., Darnall, R.A.. Spontaneous arousals during quiet sleep in piglets: a visual and wavelet-based analysis. Sleep 2001;24(5):499–513.
[16] Konofal, E., Lecendreux, M., Bouvard, M., Mouren-Simeoni, M.. High levels of nocturnal activity in children with attention-deficit hyperactivity disorder: A video analysis. Psychiatry and Clinical Neurosciences 2001;55(2):97–103.
[17] Stradling, J., Thomas, G., Belcher, R.. Analysis of overnight sleep patterns by automatic detection of movement on video recordings. Journal of Ambulatory Monitoring 1988;1(3):217–22.
[18] Nakajima, K., Matsumoto, Y., Tamura, T.. Development of real-time image sequence analysis for evaluating posture change and respiratory rate of a subject in bed. Physiol Meas 2001;22(3):N21–8. [19] Okada, S., Ohno, Y., Goyahan, , Kato-Nishimura, K., Mohri, I., Taniike, M.. Examination of
non-restrictive and non-invasive sleep evaluation technique for children using difference images. In: Engineering in Medicine and Biology Society (EMBC). Annual International Conference of the IEEE. 2008, p. 3483–7.
[20] Karayiannis, N.B., Tao, G., Frost Jr., J.D., Wise, M.S., Hrachovy, R.A., Mizrahi, E.M.. Au-tomated detection of videotaped neonatal seizures based on motion segmentation methods. Clinical Neurophysiology 2006;117(7):1585–94.
[21] Koroutchev, K., Korutcheva, E., Kanev, K., Rodriguez Albarino, A., Muniz Gutierrez, J.L., Farinez Balseiro, F.. Detection of unusual objects and temporal patterns in EEG video recordings. In: Advances in Visual Computing, PT 1, Proceedings of 5th International Symposium on Visual Computing, Las Vegas, NV; vol. 5875 of Lecture Notes in Computer Science. 2009, p. 965–74. [22] Cuppens, K., Lagae, L., Ceulemans, B., Van Huffel, S., Vanrumste, B.. Automatic video detection
of body movement during sleep based on optical flow in pediatric patients with epilepsy. Med Biol Eng Comput 2010;48(9):923–31.
[23] Pediaditis, M., Tsiknakis, M., Leitgeb, N.. Vision-based motion detection, analysis and recog-nition of epileptic seizures–a systematic review. Computer Methods and Programs in Biomedicine 2012;108(3):1133–1148.
[24] CA, D., KA, A.. Joint wavelet video denoising and motion activity detection in multimodal human ac-tivity analysis: application to video-assisted bioacoustic/psychophysiological monitoring. EURASIP Journal on Advances in Signal Processing 2008;2008:792028.
[25] Tamura, T.. Home geriatric physiological measurements. Physiological Measurement 2012;33(10):R47.
[26] Töreyin, B.U., Dedeo˘glu, Y., Çetin, A.E.. HMM based falling person detection using both audio and video. In: Computer Vision in Human-Computer Interaction. Springer; 2005, p. 211–220.
[27] Schank, J.C.. The development of locomotor kinematics in neonatal rats: An agent-based modeling analysis in group and individual contexts. Journal of Theoretical Biology 2008;254(4):826–42. [28] Cline, M.A., Nandar, W., Bowden, C., Calchary, W., Smith, M.L., Prall, B., et al. The threshold of
amylin-induced anorexia is lower in chicks selected for low compared to high juvenile body weight. Behavioural Brain Research 2010;208(2):650–4.
[29] McQuibban, A.G., Joza, N., Megighian, A., Scorzeto, M., Zanini, D., Reipert, S., et al. A drosophila mutant of letm1, a candidate gene for seizures in wolf-hirschhorn syndrome. Human Molecular Ge-netics 2010;19(6):987–1000.
[30] Cachat, J., Stewart, A., Utterback, E., Hart, P., Gaikwad, S., Wong, K., et al. Three-dimensional neurophenotyping of adult zebrafish behavior. PLoS ONE 2011;6(3):e17597.
[31] Martins-Silva, C., De Jaeger, X., Guzman, M.S., Lima, R.D.F., Santos, M.S., Kushmerick, C., et al. Novel strains of mice deficient for the vesicular acetylcholine transporter: Insights on transcriptional regulation and control of locomotor behavior. PLoS ONE 2011;6(3):e17611.
[32] Fisher, S.P., Godinho, S.I., Pothecary, C.A., Hankins, M.W., Foster, R.G., Peirson, S.N.. Rapid assessment of sleep-wake behavior in mice. Journal of Biological Rhythms 2012;27(1):48–58. [33] Valente, D., Wang, H., Andrews, P., Mitra, P.P., Saar, S., Tchernichovski, O., et al. Characterizing
animal behavior through audio and video signal processing. MultiMedia, IEEE 2007;14(4):32–41. [34] Walton, A., Branham, A., Gash, D.M., Grondin, R.. Automated video analysis of age-related motor
deficits in monkeys using ethovision. Neurobiology of Aging 2006;27(10):1477–83.
[35] Brendle, J., Hoy, S.. Investigation of distances covered by fattening pigs measured with videomotiontracker. Applied Animal Behaviour Science 2011;132(1-2):27–32.
[36] Chen, Y.J., Li, Y.C., Huang, K.N., Jen, S.L., Young, M.S.. Stand-alone video-based animal tracking system for noiseless application. Instrumentation Science and Technology 2009;37(3):366–378.
[37] Forsyth, D., Ponce, J.. Computer Vision: A Modern Approach (2nd Edition). Pearson Education, Limited; 2011.
[38] Fiala, M.. Artag, a fiducial marker system using digital techniques. In: Computer Vision and Pattern Recognition, 2005. CVPR 2005. IEEE Computer Society Conference on; vol. 2. 2005, p. 590–6. [39] Parker, J.R.. Algorithms for Image Processing and Computer Vision. Wiley com; 2010.
[40] Silverman, B.. Density estimation for statistics and data analysis. Monographs on statistics and applied probability; Chapman and Hall; 1986.
[41] Avoine, O., Bossé, D., Beaudry, B., Beaulieu, A., Albadine, R., Praud, J.P., et al. Total liq-uid ventilation efficacy in an ovine model of severe meconium aspiration syndrome. Crit Care Med 2011;39(5):1097–103.
[42] St-Hilaire, M., Duvareille, C., Avoine, O., Carreau, A.M., Samson, N., Micheau, P., et al. Ef-fects of postnatal smoke exposure on laryngeal chemoreflexes in newborn lambs. Journal of Applied Physiology 2010;109(6):1820–1826.
[43] Abdelouahab, N., Suvorov, A., Pasquier, J.C., Langlois, M.F., Praud, J.P., Takser, L.. Thyroid disruption by low-dose BDE-47 in prenatally exposed lambs. Neonatology 2009;96:120–4.
[44] Frigon, A., Johnson, M.D., Heckman, C.J.. Altered activation patterns by triceps surae stretch reflex pathways in acute and chronic spinal cord injury. J Neurophysiol 2011;106:1669–78.
[45] Prechtl, H.F.. The behavioural states of the newborn infant (a review). Brain research 1974;76(2):185– 212.
[46] Als, H.. Program guide: Newborn individualized developmental care and assessment program (nid-cap): An education and training program for health care professionals. Boston, MA: Children’s Medi-cal Center Corporation 2002;.


![[PDF] Cours Air : Les vecteurs, les Tests et les matrices | Cours informatique](data:image/gif;base64,R0lGODlhAQABAIAAAP///wAAACH5BAEAAAAALAAAAAABAAEAAAICRAEAOw==)