HAL Id: insu-01353771
https://hal-insu.archives-ouvertes.fr/insu-01353771
Submitted on 13 Aug 2016HAL is a multi-disciplinary open access archive for the deposit and dissemination of sci-entific research documents, whether they are pub-lished or not. The documents may come from teaching and research institutions in France or abroad, or from public or private research centers.
L’archive ouverte pluridisciplinaire HAL, est destinée au dépôt et à la diffusion de documents scientifiques de niveau recherche, publiés ou non, émanant des établissements d’enseignement et de recherche français ou étrangers, des laboratoires publics ou privés.
Stratospheric Warming, Observed Above the Tropical
Site of Gadanki (13.5°N, 79.2°E) with a Rayleigh Lidar
U. Jaya Prakash Raju, Philippe Keckhut, M. Krishnaiah, Y. Bhavani Kumar
To cite this version:
U. Jaya Prakash Raju, Philippe Keckhut, M. Krishnaiah, Y. Bhavani Kumar. Temperature Anomalies Associated with Sudden Stratospheric Warming, Observed Above the Tropical Site of Gadanki (13.5°N, 79.2°E) with a Rayleigh Lidar. International Journal of Chemical Sciences, SADGURU Publications, 2016, 14 (S2), pp.527-542. �insu-01353771�
________________________________________
*
Author for correspondence; E-mail: lidarraju@gmail.com
www.sadgurupublications.com
TEMPERATURE ANOMALIES ASSOCIATED WITH SUDDEN
STRATOSPHERIC WARMING, OBSERVED ABOVE THE
TROPICAL SITE OF GADANKI (13.5
°N, 79.2°E) WITH A
RAYLEIGH LIDAR
U. JAYA PRAKASH RAJU
a*, P. KECKHUT
a, M. KRISHNAIAH
band
Y. BHAVANI KUMAR
ca
Laboratoire Atmospheres, Milieux, Observations Spatiales, IPSL, CNRS-INSU, University
a
Versailles-Saint Quentin, University Pierre et Marie Curie, Place Jussieu, 75252 PARIS, FRANCE
b
Department of Physics, Sri Venkateswara University, TIRUPATHI – 517502 (A.P.) INDIA
c
National Atmospheric Research Laboratory, P.B. No: 123, TIRUPATHI – 517502 (A.P.) INDIA
c
Currently Staying at Department of Physics, Vels University, Pallavaram, CHENNAI (T.N.) INDIA
ABSTRACT
A quasi continuous Rayleigh lidar measurements of middle atmospheric temperature (30-70km region) have been carried out from Gadanki (13.5 N, 79.2 E), India between June, 1998 and April, 1999. Summer temperature showed a smooth and regular variation with altitudes and reasonably good agreement with MSISE-90 model atmosphere. By, contrast winter temperatures are perturbed continuously by planetary waves, as long as prevailing winds are westerlies, from October to March. Pronounced stratospheric cooling and a minor stratospheric warming events were observed during this winter period. The stratopause height and temperature vary considerably during the evolution of this phenomenon. Spectral analysis of the data reveals the presence of a 16-day wave interpreted as a free Rossby wave, another wave with large perturbations having periods of 23 to 35 days. Amplitude and Phases of theses waves exhibits a peculiar structure “quiet atmospheric layer” corresponds to the regions of minimum variability of Quasi-Stationary planetary wave no. 2 of the CIRA-86 model. The thermal structure of tropical stratosphere of northern hemisphere seems to be influenced by the dynamics of the winter time stratospheric warmings at the mid/high-latitudes. The stratospheric warming event over Gadanki appeared to be linked to warming event over the mid-latitude region. Our analysis partially strengthens the point of “propagation of 16-day planetary waves over equatorial stratosphere invades the mid-latitudes from the tropics during the evolution of Stratospheric Sudden Warming”.
INTRODUCTION
Important wave motions in the middle atmosphere occur at different scales including gravity waves, planetary waves, thermal tides…. Planetary Wave upward propagation represents one of the main causes of variability of the middle atmospheric temperature. Planetary (Rossby) waves as their name implies are large scale (~104 km) (Holton, 2004) waves and their restoring force is the meridional gradient of potential vorticity (or the variation of Coriolis parameter with latitude). Planetary wave sources include large-scale orography and land-sea contrasts. These waves are westward propagating relative to the mean flow (Brasseur and Solomon, 2005). Planetary waves propagate vertically only when the mean winds are westerly, with velocity less than a critical value. Since this condition exists only during winter, planetary waves are absent in the stratosphere during summer. Wave breaking occurs when the phase velocity of the wave is equal to the background horizontal wind (ch = !h). The zonal force exerted by planetary waves on the stratosphere can induce an equator to pole Brewster-Dobson circulation. While planetary waves interact with the mean flow they ate responsible for the transport of critical species (e.g. ozone, water vapor) in the middle atmosphere. Hence lot of studies on planetary waves have been made for mid, high and polar latitudes (e.g. Arnold and Robinson, 1998; Luo et al., 2000,2002a,b; Bittner et al., 1994; Offermann et al., 1987; Salby et al., 2002; Dunkerton and Delisi, 1986), but remain sparse for low latitudes (Kishore et al., 2006). Planetary wave activity leads to sudden stratospheric warming over polar stratosphere due to interactions with the mean flow (Labitzke, 1981). Charlton and Polvani (2007) have performed a climatology and have identify different types of warming events using NCEP/NCAR and ECMWF reanalysis data sets by documenting the major mid-winter stratospheric warming events from 1958 to 2002. Recently Hauchecorne et al. (2007) and Siskind et al. (2007) have studied the downward transport of NOx in the wintertime Arctic middle atmosphere and have shown the association with sudden stratospheric warmings of 2004 and 2006, and have reported an elevated stratopause in connection with vertical propagation and breaking of a planetary wave.
Rayleigh lidars have emerged as a robust technique for sounding the stratosphere and mesosphere and provides high resolution (15 min, 100 m) vertical temperature profiles of the 30-90 km altitude range (Hauchecorne and Chanin, 1980). Rayleigh lidar studies have supported a variety of investigations of the thermal structure of the middle atmosphere providing data for studies of long term and seasonal variations as well as tides, planetary and gravity waves. Lidar and rocket data have been used for several studies of winter thermal structure and planetary wave propagation in the middle atmosphere (Hauchecorne et al., 1987; Offermann et al., 1987; Jenkins et al., 1987; Di Donfransisco et al., 1996; Marenco et
al., 1997; Namboothiri, 1999). They found the atmosphere was very active with minor and major stratospheric warmings and applying harmonic analysis, they derived waves having periods are of the order of several days and weeks and are interpreted as planetary waves along with ‘quiet layers’ and some peculiar features, such as split stratopause (or) a near adiabatic lapse rate in the mesosphere. Recently Hauchecorne et al. (2006) studied the interannual variability of Planetary Wave activity in winter (October to April) during 20 years (from 1981–1982 to 2000–2001) from OHP station and found two dominant modes of free travelling Rossby waves known as 16 day- and 12 day-waves and the role of the Quasi-Biennial Oscillation (QBO) in the modulation of Planetary Wave activity is also discussed. A statistical study of Sudden Stratospheric warming events over 20 years of lidar data has been given by Charyulu et al. (2007) from the same station.
For low latitudes however studies on winter thermal structure and planetary scale waves is few, Krishnamurthy et al. (2000) derived equatorial waves in the winter of 1999 by using MST radar and lidar data as a part of the equatorial wave studies campaign 1999. Gravity wave activity modulated by equatorial waves in the low latitudinal middle atmosphere was observed for the first time by Parameswaran et al. (2002) and derived quasi sinusoidal wave by Rajeev et al. (2003) for the same station. Sivakumar et al. (2004) observed warm stratopause over tropical region, Gadanki and is attributed due to the planetary wave breaking at high latitude. Kishor kumar et al. (2006) derived planetary waves in the middle atmosphere from the same station using the two campagain periods data of 1999 and 2000. They found that the slow Kelvin waves having periodicity of 16 days shows the dominance in the stratosphere and mesosphere. In this paper we use a quasi-continuous night time temperature profiles from April 1998 to July 1999 obtained from Rayeigh lidar at Gadanki to study the local temperature variations and their interpretation in terms of planetary waves propagation.
Observations and data analysis Rayleigh lidar
The lidar observations presented here were made on 90 nights during the period from April 1998 to July 1999. The data were collected continuously for a period of 4 to 6 h on clear nights, starting around 20:00 LT. The recorded raw data is in the form of photon count profiles with a height resolution of 300m and time resolution of 250 s. The height range considered for the present study extends from 30 to 70 km, although the temperature was derived up to 90 km. The large fluctuations resulting from a low signal-to-noise ratio at higher heights is the reason for limiting the height coverage to 70 km for wave studies. The method of deriving the temperature profile from the measured photon count profile closely
follows the method given by Hauchecorne and Chanin (1980) and is described in detail by Sivakumar et al. (2003). The time duration and height extent of the data determine the upper limits of the wave period and vertical wavelength, respectively.
RESULTS AND DISCUSSION
Lidar observations of winter time temperature anomalies
To study, the planetary waves, a quasi-continuous survey of the night time temperature profile has been performed from April 1998 to July 1999. Because during the winter of 1998-99, a variation of the temperature profile with a period of about 20 days was observed and is attributed by the authors to the propagation of planetary waves. In this section, the series of 90 profiles obtained during this period are used to study the local temperature variations and their interpretation in terms of planetary wave propagation.
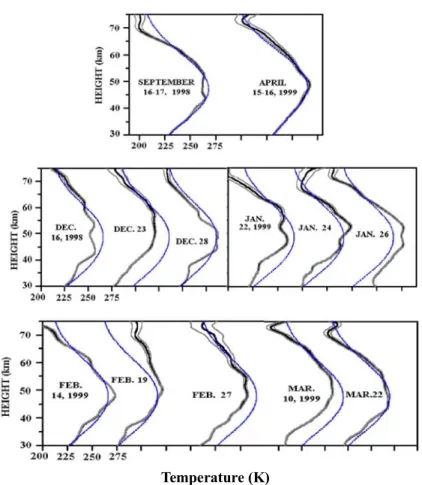
Fig. 1 presents thirteen nightly mean temperature profiles obtained between September, 1998 to April, 1999 are representative of typical situations. The hardware averaged photon count profiles are summed over entire period (typically 4-6 hrs) for deriving theses nightly mean temperature profiles. Vertical smoothing was applied to these profiles using a running mean over 20 points (3 km). In the figure the successive profiles are sifted by 50K and the date of observation is indicated for each plot. Each experimental profile is also indicated with the associated uncertainties the uncertainty is minimum on the first few kilometers from the top level of the profiles. Also shown for validation is the MSISE-90 model for the appropriate month and latitude (13.50N). The profile of September 16 (night of September 16-17) is typical of the equinox period. It is very close to the MSISE-90 model in the stratosphere and mesosphere and does not present any large perturbation except at stratopause region. By contrast, temperature profiles during winter period showed far more variability with height and marked disagreement with the model. The three profiles of December 1998 have been obtained during the more disturbed period of the winter. A definite cooling (15 K) noticeable near 50 km on December 16, later in a weak time it increases and covers downward the entire stratosphere reaching a minimum value of 23 K up to December 23 and dissipated on 22nd January 99. It is interesting to note that a sudden stratospheric warming (SSW) event was detected on 26th January 99 with a temperature rise of 10K in the region above 40 km and the magnitude of warming was enhanced and moved into the mesospheric region on 19th February 99. This warming was followed by deep cooling observed on 27th February 99 in the entire stratosphere. A deep cooling followed by the warming, the stratosphere reaches a stable situation only after 3 weeks on March 22nd.
Temperature (K)
Fig. 1: Series of 13 lidar temperature profiles obtained from Sep.98 to Apr.99. The dotted line represents the MSISE-90 model for the corresponding
day and latitude. The standard deviation (± 1σ) is indicated
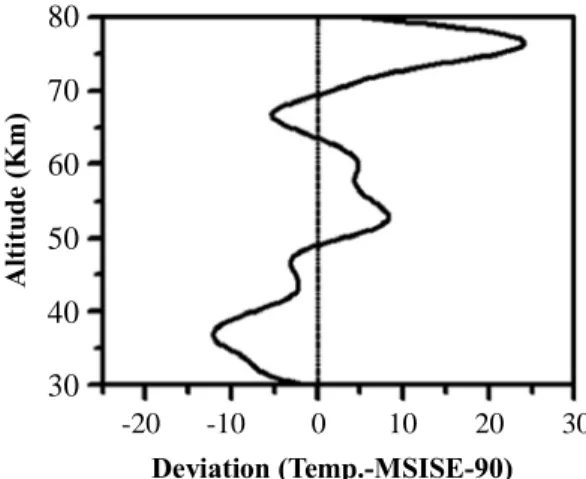
The perturbation of these profiles is characterized by a vertical wavelength of about 30 km, as shown in Fig. 2 for January 24, 1999. Such vertical wavelengths of about 30–50 km, have already been reported by many authors during more disturbed winter periods (Offer Mann et al., 1979; Hauchecorne and Chanin, 1982, 1983). Owing to these structures the vertical temperature gradient may reach a mean value of -7K per km in the region of 50-60 km (figure 1). Further analysis of temperature changes shows that the cooling pattern moved down in to the lower stratosphere on 28 December, again 3 weeks later on January 22 it appeared in the stratosphere up to 55 km. After two more days, on 24th Jan.99 stratospheric cooling had moved to create warming by 6 K at around stratopause (52 km). This mesospheric warming spreads to the entire stratosphere, with the cooling of the upper mesosphere as seen in the temperature profile of 26th Jan. After three weeks a minor warming observed at stratopause region (by 7 K), moved to mesosphere strongly by 19th
Feb.99. Later a week on 27 February 1999 a deep stratospheric cooling was observed up to 55 km. This deep stratospheric cooling persists up to 10 March 1999, and then weakened by 22 March 1999. The profile corresponding to April 15, 1999, shows the returns to a summer quiet situation without perturbations induced by planetary waves.
A lti tu de (K m) Deviation (Temp.-MSISE-90) 80 70 60 50 40 30 -20 -10 0 10 20 30
Fig. 2: Deviation of temperature profile for the height of Jan 24, 1999 from MSISE-90 model
Temperature and vertical wind velocity profiles from April 1998 and July 1999 used in the present study were obtained from the India Meteorological Department (IMD), Chennai, the nearest place at a radial distance of 120 km from the Rayleigh Lidar site. IMD Chennai launches Radiosonde balloons every day at 0000GMT and 1200 GMT. The maximum height reached by the radiosonde balloons was in the range of 25-30 km. The combination of lidar and radiosonde temperature observations lead to construct a time-height section of the temperature from 25 to 80 km is depicted in Fig. 3 together with the mean zonal wind from 0 to 30 km. During the period from June to September 1998, the temperature isopleths are nearly horizontal corresponding to very little time variation in the temperature profiles. During that period, easterly winds are present in the lower stratosphere, a situation that prevents the propagation of the planetary waves into the stratosphere (Carney and Drazin, 1961). In November, winds changes from easterly to westerly in the lower stratosphere. The planetary waves may then propagate into middle atmosphere, and a succession of large perturbations in the temperature profiles appear in the upper stratosphere and in the mesosphere. The maximum amplitude of these perturbations is observed in January after a period of strong westerly winds and just before the ‘major warming’ occurred over the polar region at the end of December,99 (Manney et al., 1999). In February and March, the zonal wind is locally easterly or moderately westerly and the amplitude of the perturbations decreases. A return to the quiet summer situation is observed at the
beginning of April. One of the notable features in the winter stratosphere is the sudden stratospheric warming event presented in Fig. 1, its dramatic feature is the rapid descent of the stratopause from its average altitude down to below 40 km combined with an increase of its temperature by many tens of Kelvin within few days. As shown in Fig. 3, the stratopause descended almost 10 km from 55 km observed at mid January to 45 km within ten days, while its temperature rose rapidly to a peak of 275 K, that is 10K warmer than the corresponding temperature of the MSISE-90 model. At the same time the upper mesosphere cooled and lower stratosphere stayed cold. Further, the stratopause descended to lower heights and reached to quiet situation during March.
Fig. 3: (top) Time-height contour of lidar temperature from Apr 1998 to Jul 1999;
(Bottom) Time-height contour of the radiosonde zonal wind (m/s) westerly winds are ≥ 0 and represented by red colour area; easterly winds are ≤ 0 and
represented by black colour area. Contour lines are plotted by steps of 20 m/s
Comparison with high-lattitude temperature anomlies
We have checked the occurrence of any major stratospheric warming during our observation period over polar/mid latitude regions. A major sudden stratospheric warming is occurred over the polar region at the end of December and is reported by Manney et al. (1999). Consequently two sudden stratospheric warming events were observed over mid latitudes at mid of Dec. 98/Jan. 99. Fortunately we have the available data from OHP during Dec. 98 – Feb. 99. Details of OHP lidar system configuration and technical features are mention elsewhere (Hauchecorne and Chanin, 1980; 1987). Eleven representative height distributions of temperature profiles along with ± 1 standard deviation obtained between Dec.98 – Feb. 99 are shown in Fig. 4, together with the relevant MSISE-90 model profile. It
is known that sudden stratospheric warmings are associated with the vertical propagation of planetary waves: the warming has to be observed to proceed from the upper mesosphere toward the lower stratosphere, producing the large changes in the altitude and temperature of the startopause. Such a feature is confirmed by the present analysis. Fig. 4 shows the double stratopause (the statopause region appears to be split in to two maxima) with more pronounced peak at higher altitude during the build up phase of warming. Similar pattern was reported by (Offermann et al., 1987 and Marenco et al., 1997). High temperatures are first encountered in the mesosphere for the profiles of 12 and 13 Dec.98 and it progressively propagate downward, eventually producing the large warming in the stratopause region of consecutive nights from 14 to 17, Dec.98 profiles with warm stratopause (magnitude of ~40 K) with temperature more than 300K. Further the warming of the stratosphere was associated with a cooling of the mesosphere. After warming, the stratopause cools by approximately 20K by producing double startopause again in 18 Dec. Normal condition prevails on next day of 19 Dec. Later one month again minor stratospheric warming is observed at 20 Jan, 99 with temperature increase of 22 K and it recovers normal with in a week time.
Fig. 4: Lidar temperature profiles for winter Dec. 98-Jan.99 obtained from OHP
Rayleigh lidar. T ± 1σ curves are also shown. The dotted line represents the MSISE-90 model for the corresponding day and latitude
The thermal structure of tropical stratosphere of northern hemisphere seems to be influenced by the dynamics of the winter time stratospheric warmings at the high-and mid latitudes. During the first major warming event over mid latitude (at mid Dec.1998) was associated with a minor cooling (on 23rd) at Gadanki and persists for 2-3 days through out the entire middle atmosphere (Fig. 1). But for second warming event over mid latitudes (at the end of Jan. 1999), a warming event was detected at 26th Jan, 99 and persisted for two weeks. After two weeks the dominant cooling was observed for a week time with magnitude of 5-17 K in the stratospheric region of Gadanki. For the first time global extent of the high-latitude stratospheric winter warmings (STRATWARMs) was observed by Fritz and Soules (1970) from Nimbus-3 satellite. They have shown that STRATWARMs are accompanied by stratospheric cooling over the tropics and sub-tropics of both the hemispheres.
Spectral analysis of long period oscillations over Gadanki
Time analysis of the experimentally observed temperature disturbances has been performed by harmonic analysis. To study the characteristics of the temperature perturbation, the difference between the daily temperature and the mean temperature has been considered. This mean temperature is obtained by applying a running average of 45 days. Such temperature deviations from the mean value are illustrated in Fig. 5 for the period of October 1998 to April 1999. From this representation it appears that a succession of cooling and warming is observed in both the stratosphere and the mesosphere.
Fig. 5: Time-height section of the temperature deviation from a 45 days running
average. Orange colour areas correspond to a warming. Blue colour areas represent a cooling from the average value. The large arrow indicates the
time of the strong minor stratospheric cooling events
Furthermore, each cooling is associated with a warming occurring about 10 km above or below. This corresponds to the 30 km vertical wavelength as already mentioned.
Such vertical structures are responsible for the anticorrelations observed in the temperature variation between the upper stratosphere and the lower mesosphere. The periodic variation of these structures does not appear to be due to the propagation of a single planetary wave. Further more from this figure one can observe deep cooling starting at 70 km during October and descending to the lower levels and cools entire mesosphere up to 60 km by the end of December. The same magnitude of cooling covers the stratosphere and mesosphere during the end of February and starting of March 1999.
A spectral Fourier analysis of the temperature data has been performed on the data from October 1998 to April 1999 to study possible periodicities. Fig. 6(a-b) present the height section of the amplitude and phase distribution of the temperature oscillations. In the stratosphere, two main periods are observed: 14-21 days and 32days, [Herein 16D and 32D respectively], with a maximum amplitude range 35 to 40 km for these two periods with a minimum of amplitude of the temperature variations at the stratopause level. The maximum amplitudes occur for the both periods in the stratosphere. The phase change of 16D and 32D indicates a downward propagation, shown in Fig. 6(b).
(a)
(b)
Fig. 6: (a) Amplitude of the temperature oscillations with 16 and32day periods, as a function of height, (b) Phase of the temperature oscillations as a function of height
Further, the wave amplitudes of 16D, 32D show a pronounced minimum in the range of 63-68 km, with high values below and above this level; Moreover phase changes are very considerable at and slightly above this level for both waves, which is attributed as ‘quiet atmospheric layer’ at about 65 km. The amplitude minima and the steep phase transitions found in the present data are interpreted as nodes of standing waves (Plumb, 1982). Similar mesospheric ‘quiet layers’ during the MAPWINE Campaign was reported by the Hauchecorne et al. (1983; 1987) and Offerman et al. (1987). Fourier analysis of that data
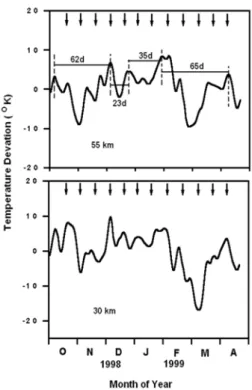
yielded oscillations with periods similar to those found here and they observed a much more gradual amplitude and phase variation with height than is shown in Fig. 7. This 16D wave is present in the stratosphere during the whole 6 months period from October 1998 to April 1999. At 30 km it is possible to observe each maximum of that wave, except at the end of February and beginning of March, when the strongest stratospheric cooling of the winter is noticed on. At 55 km, the 16D wave is observed for most of the time. On the other hand, the two longer periods are observed simultaneously, where they dominate with the temperature variations. The four successive maxima of temperature occurring from October 1998 to April 1999 are separated by 62, 23, 35 and 65 days respectively. Two of these periods are near 23 to 35 days, and other two near 62 to 65 days. The succession of these two periods broadens the temporal spectrum and explains the merging of the 32D and 66D in the mesosphere.
Fig. 7: Deviation from the mean temperature measured at 30 and 50 km. The arrows indicate the dates of the maximum of the 16D wave
CONCLUSION
In the present study, we have investigated the long period oscillations in the low latitude middle atmosphere over Gadanki by analyzing the quasi-continuous Rayleigh lidar
temperature data during the winter of 1998-1999. It clearly indicates that temperature perturbations are more by planetary waves as long as prevailing winds are westerlies, from October to March. The anticorrelation of upper stratospheric and mesospheric temperature perturbations indicates a vertical wavelength of 30 km and succession of warming and coolings reaching a large amplitude in January. A spectral analysis on the observed data reveals two main periods. The one 16 day wave is same as the 16-day traveling wave observed by Madden (1978, 1979). They demonstrated that westward traveling waves with zonal wavenumber 1 and a period of 12-20 days occur frequently in the northern hemisphere troposphere and lower stratosphere. This mode is known as the 16 day wave because of the predominant period. These waves resemble a free Rossby H14 mode and are assumed to be excited by heating due to the moist convection in the troposphere, and the vertical penetration into the middle atmosphere occurs (Garcia and Geisler, 1981). Numerical simulation of 16-day wave indicates the asymmetry of the amplitude of the 16-day wave becomes large in the winter hemispheric upper stratosphere and lower mesosphere (Miyoshi, 1991), which clearly observes in the amplitude profile of 16-day wave and it presents during the winter stratosphere. The other long period wave is 23-35days wave and it merges with 16-day wave in mesosphere.
The amplitude and phases of these two oscillations exhibits peculiar structure “quiet layers” in the middle atmosphere, where the wave amplitudes become very small and their phases change strongly with height. Offermann et al. (1987) ascribe it as the nodes of standing waves. They treated it as wave trapping, reflection and resonance. Further they explained as the panetary waves with wave number 1 and 2 are non evanescent up to at least stratospheric jet maximum, which is usually located at ~ 60-70 km and are generally trapped at and above that region, since the trapping of the wave is a prerequisite for resonance. These waves will have wave modes, one with two nodes in the vertical structure (one at turning point below 60 – 70 km and other at 40 km) and the other with one node. In our observations node is clearly located around 60-70km region. Further it is reported that the Quiet layers generally correspond to the region where the CIRA Quasi Stationary planetary wave no. 1 has zero T amplitude for type1 Quiet layer or has minimum or a maximum for type 2 Quite Layer (Bittner et al., 1994; Marenco et al., 1997). For Gadanki (70oE) the CIRA type 1 quite layer is located between 70 and 80km. The observed values of ~60-70km is in agreement with the CIRA model and with the attribution of prominence to planetary wave no 2.
Our analysis shows stratospheric warming event on Jan, 1999 over Gadanki appeared shortly after a major stratospheric warming event over the polar region at the end of Dec, 1998. The phenomenon of Stratospheric Sudden Warming at high latitudes is a
consequence of the upward propagating Planetary Waves from the troposphere and their interaction with the Polar Vortex (e.g. Matsuno, 1971; Limpasuvan et al., 2004). However, the amplitude of the upward propagating Planetary Waves has to be enhanced substantially to initiate the Sudden Stratospheric Warming. The momentum and energy transfer associated with the interactions of PW with Polar Vortex rapidly increases the polar (>60o latitude) stratospheric temperatures manifesting as the Stratospheric Sudden Warming during the winter months of some particular years. Associated with this poleward increase of temperature (> 25 K), a reversal of zonal-mean stratospheric winds from eastward to westward is also observed. Numerical simulations of Dunkerton et al. (1981) have also shown that there could be a connection between the Stratospheric Sudden Warmings and the dynamics over the tropical region (± 20o latitude) in the form of an appearance of a critical layer (or zero-wind line) in wind, first over the tropical stratosphere, and its subsequent movement towards Pole. In a recent study, Vineeth et al. (2010) presents for the first time the connection between the tropics during the Stratospheric Sudden Warming events and the pole, through the quasi 16-day wave. They used NCEP/NCAR reanalysis of stratospheric wind and temperatures by showing an enhanced Planetary Wave activity of quasi periodicity 16-days, almost simultaneously with the zero-wind line (appears over the tropics ~ 60 days prior to the major Stratospheric Sudden Warmings), propagates from equator to the Pole. On the other hand in consistent to our observations of stratospheric coolings over Gadanki in connection with warming over midlatitude, Fritz and Souless (1970) revealed, for the first time, that the stratospheric warmings in the high latitudes of winter hemisphere were accompanied by simultaneous cooling in the stratosphere of the tropics and of the summer hemisphere. Also, the atmosphere appears to act like a standing wave in which the amplitudes of the temperature changes are larger in the middle and high latitudes of the winter hemisphere than in the tropics and summer hemisphere. Our aim of paper is to delineate long period oscillations from quasi-continuous lidar data rather than to work on warming events. Further large set of winter data is required to study the internal variability and long term changes in planetary wave activity over Gadanki.
REFERENCES
1. M. Bittner, D. Offermann and I. V. Bugaeva, Long Period/Large Scale Oscillations of Temperature During DYANA Campaign, J. Atmos. Terr. Phys., 56, 1675-1700 (1994).
2. G. P. Brasseur and S. Solomon, Aeronomy of the Middle Atmosphere. Springer,
Netherlands, 644 (2005).
3. J. G. Charney and P. G. Drazin, Propagation of Planetary Scale Disturbances from the Lower into the Upper Atmosphere, J. Geophys. Res., 66, 83-109 (1961).
4. Di Donfrancesco, G. A. Adriani, G. P. Gobbi and F. Congoduti, Lidar Observations of Stratospheric Temperature Above McMurdo Station, Antarctica J. Atmos. Terr. Phys.,
13, 1391-1399 (1996).
5. T. J. Dunkerton, C. P. F. Hsu and M. E. McIntyre, Some Eulerian and Lagrangian
Diagnostics for a Model Stratospheric Warming, J. Atmos. Sci., 38, 819-843 (1981).
6. S. Fritz and S. D. Soules, Large Scale Temperature Changes in the Stratosphere
Observed from Nimbus-III, J. Atmos. Sci., 27, 1091-1097 (1970).
7. A. Hauchecorne and M. L. Chanin, Density and Temperature Profiles Obtained by
Lidar Between 35 and 70 Km, Geophys. Res. Lett., 7, 565-568 (1980).
8. A. Hauchecorne and M. L. Chanin, A Mid-Latitude Ground-Based Lidar Study of
Stratospheric Warmings and Planetary Wave Propagation, J. Atmos. Terr. Phys., 44, 577-583 (1982).
9. A. Hauchecorne and M. L. Chanin, Mid-Latitude Lidar Observations of Planetary
Waves in the Middle Atmosphere During the Winter of 1981-1872, J. Geophys. Res.,
88, 3843-3849 (1983).
10. A. Hauchecorne, T. Blix, R. Gerndt, G. W. Meyer and N. N. Shefov, Large Scale
Coherence of the Mesospheric and Upper Stratospheric Temperature Fluctuations, J. Atmos. Terr. Phys., 49, 649-654 (1987).
11. A. Hauchecorne, J. J. Bertaux, F. Dalaudier, J. M. Russel III, M. G. Mlynczak, E.
Kyrölä and D. Fussen, Large Increase of NO2 in the North Polar Mesosphere in
Janaury-February 2004: Evidence of a Dynamical Origin from GOMOS/ENVISAT and SABER/TIMED Data Geophys. Res. Lett., 34, L03810 (2007), doi:10.1029/2006GL027628.
12. J. R. Holton, An Introduction to Dynamic Meteorology, Elsevier Academic Press,
Massachusetts, 535 (2004).
13. U. Jaya Prakash Raju, M. Krishnaiah, Y. B. Kumar, D. Kothandan and P. Keckhut,
Tropical Stratopause Features - Rayleigh Lidar Observations Over Gadanki (13.5°N, 79.2°E), India Adv. Appl. Sci. Res., 2, 318-331 (2011).
14. D. B. Jenkins, D. P. Wareing, L. Thomas and G. Vaughan, Upper Stratospheric and
Mesospheric Temperatures Derived from Lidar Observations at Aberystwyth, J. Atmos. Terr. Phys., 49, 287-298 (1987).
15. P. Kishore, S. P. Namboothiri, K. Igarashi, V. Sivakumar, S. Thulasiraman, I. V. Subba Reddy, K. Mizutani, D. N. Rao, S. V. B. Rao, Y. B. Kumar, Rayleigh Lidar Observations of Planetary Waves in the Middle Atmosphere Over Gadanki (13.51oN, 79.21oE), J. Atmos. & Solar-Terr. Phys., 68, 901-910 (2006).
16. B. V. Krishna Murthy, S. R. Prabhakaran Nayar, K. Revathy, G. Mrudula, K. Satheesan, K. Parameswaran, M. N. Sasi, Geetha Ramkumar, Prabha R. Nair, V. Deepa, Y. B. kumar, V. Sivakumar, T. Rajendra Prasad and M. Krishnaiah, Preliminary Results of Equatorial Wave Experiment Conducted from January 18, 1999 to March 5, 1999 with Lidar at Gadanki. Ind. J. Rad. Space Phys., 29, 231-234 (2000).
17. R. Madden, Further Evidence of Travelling Planetary Waves, J. Atmos. Sci., 35,
1605-1618 (1978).
18. R. Madden, Observations of Large-Scale Travelling Rossby Waves, Rev. Geophy., 17, 1935-1949 (1979).
19. R. A. Madden and K. Labitzke, A free Rossby Wave in the Troposphere and
Stratosphere During Jan, 1979, J. Geophys. Res., 86, 1247-1254 (1981).
20. G. L. Manney, W. A. Lahoz, R. Swinbank, A. O’Neill, P. M. Connew and R. W.
Zurek, Simulation of the December 1998 Stratospheric Major Warming, Geophys. Res. Lett., 26, 2733-2736 (1999).
21. F. Marenco, A. di Sarra, M. Cacciani, G. Fiocco and D. Fua, Thermal Structure of the Winter Middle Atmosphere Observed by Lidar at Thule, Greenland, During 1993-1994, J. Atmos. Solar. Terr. Phys., 59, 151-158 (1997).
22. S. P. Namboothiri, N. Sugimoto, H. Nakane, I. Matsui and Y. Murayama, Rayleigh
Lidar Observations of Temperature Over Tsukuba: Winter Thermal Structure and Comparison Studies, Earth Planets Space, 51, 825-832 (1999).
23. D. Offerman, R. Gerndt, R. Kuchler, K. Baker, W. R. Pendleton, W. Meyer, U. Von
Zahn, C. R. Philbrick and F. J. Schmidlin, Mean State and Long-Term Variations of Temperature in Winter Middle Atmosphere Above Northern Scandinavia, J. Atmos. Terr. Phys., 49, 655-674 (1987).
24. K. Parameswaran, K. Rajeev, M. N. Sasi, G. Ramkumar and B. V. Krishna Murthy,
First Observational Evidence of the Modulation of Gravity Wave Activity in the Low Latitude Middle Atmosphere by Equatorial Waves, Geophys. Res. Lett., 29, 1077 (2002), doi: 10.1029/2001GL013625.
25. R. A. Plumb, Instability of the Distorted Polar Night Vortex: A Theory of
Stratospheric Warmings, J. Atmos. Sci., 38, 2514-253 (1982).
26. K. Rajeev, K. Parameswaran, M. N. Sasi, Geetha Ramkumar and B. V. Krishna
Murthy, Rayleigh Lidar Observations of Quasi-Sinusoidal Waves in the Tropical Middle Atmosphere, J. Geophys. Res., 108, D24, 4749 (2003), doi:10.1029 /2003 JD00 3682
27. R. J. Salby and P. Callaghan, Interannual Changes of the Stratospheric Circulation: Relationship to Ozone and Tropospheric Structure, J. Clim., 15, 3673-3685 (2002).
28. D. E. Siskind, S. D. Eckermann, L. Coy, J. P. McCormack and C. E. Randall, On
Recent Interannual Variability of the Arctic Winter Mesosphere: Implications for Tracer Decent. Geophys. Res. Lett., 34, L09806 (2007), doi: 10.1029/2007GL029293.
29. V. Sivakumar, P. B. Rao and M. Krishnaiah, Lidar Measurements of
Stratosphere-Mesosphere Thermal Structure Over a Low Latitude: Comparison with Satellite Data and Models, J. Geophys. Res., 108, D11, 4342 (2003), 10.1029/2002JD00 3029. 30. V. Sivakumar, B. Morel, H. Bencherif, J. L. Baray, S. Baldy, A. Hauchecorne and P.
B. Rao, Rayleigh Lidar Observation of a Warm Stratopause Over a Tropical Site, Gadanki (13.50 N; 79.20E), Atmos. Chem. Phys. Discuss., 4, 2973-2989 (2004).
31. C. Vineeth, T. K. Pant, K. K. Kumar and S. G. Sumod, Tropical Connection to the
Polar Stratospheric Sudden Warming Through Quasi 16-Day Planetary Wave, Ann. Geophys, 28, 2007-2013 (2010).