HAL Id: hal-00544727
https://hal.archives-ouvertes.fr/hal-00544727
Submitted on 8 Dec 2010
HAL is a multi-disciplinary open access
archive for the deposit and dissemination of
sci-entific research documents, whether they are
pub-lished or not. The documents may come from
teaching and research institutions in France or
abroad, or from public or private research centers.
L’archive ouverte pluridisciplinaire HAL, est
destinée au dépôt et à la diffusion de documents
scientifiques de niveau recherche, publiés ou non,
émanant des établissements d’enseignement et de
recherche français ou étrangers, des laboratoires
publics ou privés.
ABSOLUTE DISTANCE MEASUREMENTS USING
TWO-MODE LASER TELEMETRY
Michel Lintz, Clément Courde, Alain Brillet, Catherine Man
To cite this version:
Michel Lintz, Clément Courde, Alain Brillet, Catherine Man. ABSOLUTE DISTANCE
MEASURE-MENTS USING TWO-MODE LASER TELEMETRY. ICSO 2008, International Conference on Space
Optics, Oct 2008, Toulouse, France. �hal-00544727�
ABSOLUTE DISTANCE MEASUREMENTS
USING TWO-MODE LASER TELEMETRY
Michel. Lintz(1), C. Courde(1), A. Brillet(1), C.N. Man(1)(1)
ARTEMIS, Université de Nice Sophia-Antipolis, CNRS, Observatoire de la Côte d'Azur; Boulevard de l'Observatoire, 06304 Nice cedex 04, France. michel.lintz @ oca.eu
ABSTRACT
A novel laser ranging method is described that uses a two-mode laser source, and detection of the phase of the return beam. The design eliminates the cyclic error usually associated with phase measurements and provides unambiguous, absolute distance determination. Measurements of an ≈ 8m path are obtained at a beat frequency of 13 GHz. We analyse the ≈1 µm stability of the data obtained with this preliminary implementation, and expect that an improved version will allow accuracies well below 1 µm, for the kilometer-scale distances involved in satellite formation flight.
1. INTRODUCTION
Space missions that involve formation flight are more and more frequent, and the demand aims at higher sensitivity in the absolute measurement of increasingly long distances. Among the different approaches for laser ranging [1, 2], and leaving aside both interferometry, disfavoured when dealing with long distances, and triangulation, the most widespread approach relies on the propagation time of the laser beam.
Strict time of flight measurement is the most straightforward method: a short duration laser pulse is sent to the target, where the beam is back reflected. The time difference between the emission and reception is divided by
c
, the speed of light, to determine the distance unambiguously. This method relies on time measurements, whose precision has reached very high levels, thanks to increasingly stable and precise reference oscillators, with relative accuracy up to the 10-16 range for commercial H masers. This allows very long distances to be measured, such as the moon-to-earth distance. On the other hand the absolute accuracy of a single-shot measurement is limited to the picosecond (millimeter) scale by the rise time of the photodetectors. Averaging may require long measurement times, or specific strategies, not to spend most of the time waiting for the return of the echo from the target.The modulation technique relies on the same time-of-flight approach, except that the laser beam is
continuously modulated at a high frequency
F
, and the phaseΦ
of the return signal, compared with the emitted beam, is measured. Thenf
c
Φ
/
2
π
gives the distance. Detection is continuous, which allows higher resolution than with the strict time-of-flight method. If the distance to be measured exceeds one "synthetic wavelength"F
c /
=
Λ
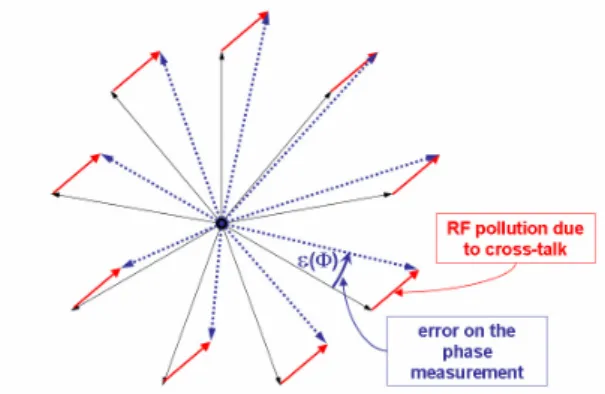
, some additional information is needed to determine the distance. The most serious drawback of the method is the cyclic error usually associated with phase measurements, when spurious contributions to the signals arise from RF crosstalk (see Fig. 1) or distortion in mixers orFig. 1. Amplitude-phase representation showing the cyclic error due to RF cross-talk in a phase
measurement.
amplifiers [1, 2]. The resulting error in the phase measurement is modulated with a period of
2
π
, hence the length measurement is modulated with a period equal to the synthetic wavelength. These "cyclic errors" [1] are difficult to assess and to prevent.The scheme proposed here uses the modulated beat-note of two single-mode lasers, and detection of the phase difference between a reference and a measurement beam. But, rather than measuring the phase difference of the two beams, we instead lock to zero the value of the phase difference by controlling the frequency
F
of the beat note. Then the length information is carried by the beat frequency, which can be measured with high accuracy. This scheme prevents from cyclic errors in the distance measurement, and nonlinearities in the phase reading.We present the principle of the measurement, then the implementation, and the results of the measurements of an ≈8 m path. Perspectives are finally given for improvements in this new ranging method.
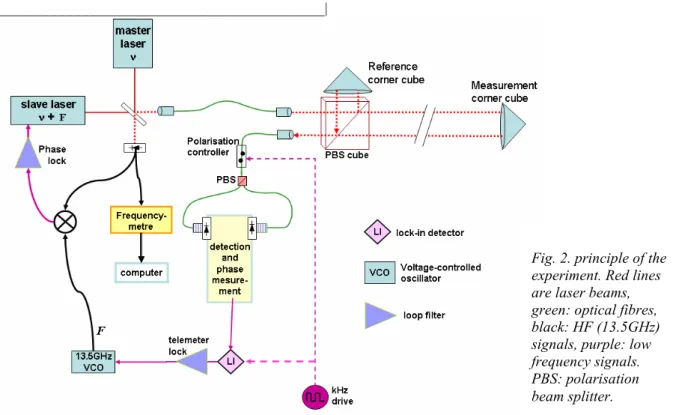
2. PRINCIPLE OF THE MEASUREMENT The two beams obtained from two single-frequency lasers (one, master, and the other, slave,
phase-locked with a frequency offset
F
) are combined using a single-mode optical fibre (Fig. 2.) to obtain a collimated beam with intensity modulated at frequencyF
. The linear polarisation is chosen so as to obtain, after a polarisation beam splitter (PBS) cube, two beams of equal intensity that travel, respectively, along a (short) reference path, and a (longer) measurement path. Back from the reference and measurement corner cubes, the two beams are superimposed at the PBS and sent, respectively, to photodiode 1 (PHD1) and photodiode 2 (PHD2) using a fibred PBS.____________________________________________|
If the phase difference of the PHD1 and 2 signals is kept to zero, then the length difference
∆
L
ref meas
L
L
−
≡
is an integer multiple of thesynthetic wavelength:
∆
L
=
K
Λ
≡
Kc
/
F
. (1)
where the integerK
is unknown, at the start of the measurements. MeasuringF
will give the value ofL
∆
only ifK
can be determined. For that purpose the frequencyF
'
of the next zero, corresponding toK
+
1
synthetic wavelengths, is also measured, which allows to determine K [3]. From
∆
L
=
(
K
+
1
)
c
/
F
'
(2)
and Eq. 1, the integer number
K
is found to beK
=
F
/(
F
'
−
F
)
(3) which leads to unambiguous determination of∆
L
. The switching fromK
zeroes toK
+
1
zeroes can be more or less time consuming, depending on the implementation, but this needs to be done once, at the very first measurement. OnceK
is known,)
(t
L
∆
and its variations can be monitored continuously by monitoringF
(t
)
, as long as)
(t
F
remains locked on the sameK-th zero, so
that∆
L
(
t
)
=
Kc
/
F
(
t
)
.
Now, considering that the phase measurement can be affected by an error, we should write, rather than Eqs. 1 and 2,
Fig. 2. principle of the experiment. Red lines are laser beams, green: optical fibres, black: HF (13.5GHz) signals, purple: low frequency signals. PBS: polarisation beam splitter.
F
c
K
K
L
=
(
+
(Φ=0))
Λ
=
(
+
(Φ=0))
/
∆
ε
ε
(4)
and'
/
)
1
(
K
( 0)c
F
L
=
+
+
Φ=∆
ε
. (5)
The small error
2
πε
(Φ=0) in the phase measurement does not affect the determination of K, since
K
=
F
/(
F
'
−
F
)
+
ε
(Φ=0), (6) whereε
(Φ=0) is assumed to be <<1 for reasonable RF implementation. In this scheme, the errorε
(Φ), even if cyclic, leads to a constant shift of the length measurement, since Eqs. 5 and 6 only involve) 0 (Φ=
ε
, at zero phase meter output.In order to eliminate this systematic shift, as well as possible drifts or ageing in the optical and electronic channels following the fibred PBS, the polarisation controller switches alternatively the reference and measurement beams between PHD1 and PHD2. The output of the phasemeter is
detected with a lock-in amplifier (see Fig. 2), and kept constant by a feedback to the VCO to control the beat frequency.
The switch+lock-in method both gives a higher loop gain and a true phase zero, provided the lock-in output offset is negligible.
3. IMPLEMENTATION
3.1 Experimental set-up
Details of the implementation are given in Fig. 3. The two single-frequency laser sources are 1.06µm non-planar ring oscillator Nd:YAG lasers. The beat note is detected by a 25 GHz bandwidth 1417 New Focus photodiode and converted from 13,5 GHz to 10 MHz signal to be phase-locked to the signal of a reference 10 MHz generator. The "long" (≈8 m) path is obtained using folding mirrors. The characteristics of the PBS cube are not critical since the non-ideal transmission or rejection give rise to beams that escape the detection system.
The polarisation switch is a General Photonics Polarite II polarisation controller followed by a fibred polarisation beam splitter. PHD1 and PHD2 are 2 GHz bandwidth fibred photodiodes. Since the beams are modulated at 13.5 GHz, PHD1 and 2
deliver rather weak signals that require amplification before downconversion to 10 MHz. The lengths of the cables to the 10MHz phase meter (based on the XOR logic circuit MC100EL07D) are chosen so that the phase meter output is around Fig. 3 Detailed implementation of the telemeter. Red lines: 1.06µm laser beams, green lines: optical fibres, black lines: HF (13.5GHz), blue lines: RF (10MHz), purple lines: DC (<100kHz) signals,
Φ
:XOR phase meter. L: lens in cat-eye position. PLL: AD 9901 circuit dedicated to phase lock loops. CC: hollow corner cube. OP: optionnal plate for the monitoring of the optical return from the detection
zero when the reference and probe beam are modulated with ≈0 phase difference.
Except for thermal drifts, the lock-in detection (Stanford SR830) has offsets with a DC part in the mV range. In the experimental conditions this corresponds to an error of ≈ 100 nm on the reference path length. This can be removed if taken into account in the data processing. Typical drifts of the lock-in output correspond to telemeter errors of of ≈5 nm. The offset drifts of the OP27
Fig. 4: noise spectrum of the closed loop error signal of the telemeter lock.
amplifier of the loop filter are far smaller. The gain of the loop filter is large enough to keep the closed loop error signal below the 20 µV (1nm) range, see Fig. 4.
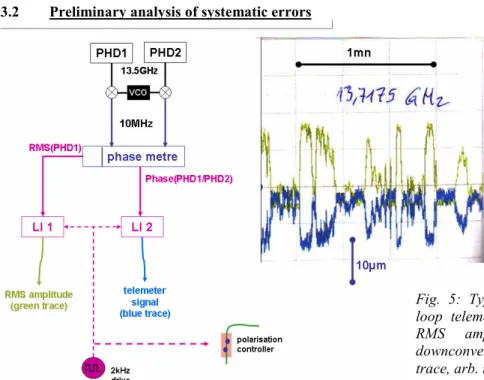
3.2 Preliminary analysis of systematic errors
A study of the signal at the output of the open-loop lock-in detection has been done, in the configuration displayed in Fig. 5, except for
- telemeter loop unlocked, and fixed frequency
F
- measurement path corner cube in a position symmetrical to the reference corner cube: in this way the measurement and reference paths are short (≈ 20 cm) and their possible thermal variations mainly cancel, so that variations of the signal should be attributed to the measurement system and not to
∆
L
.Observed spurious signal are of two kinds i) Amplitude-to-phase coupling
When translated into distance, the variation of the open loop lock-in output displays typical variations in the 10 µm range, as shown by the blue trace in Fig. 5. Indeed the variations are clearly correlated with the variations of the RMS amplitude of the signal of one of the two photodiodes (green trace on Fig. 5).
This correlation is due to a coupling of the phase meter output signal to an imbalance of the amplitudes of the RF signals. This coupling results in an error of 5 µm for a 10% PHD1/PHD2 imbalance. Such an imbalance appears, and varies with time, due to imperfect polarisation switching. When the polarisation is not perfect, the beam that reaches a given photodiode contains a small
____________________________________________________________________|
admixture (for instance 1% in power) of the unwanted path. Then the interference (in that case 10%) is modulated in sign and amplitude along
with the variations of the interferometric phase between the reference and measurement beam
paths. As shown in Fig. 6 this
Fig. 5: Typical recording of the open loop telemeter signal (blue trace) and
RMS amplitude of the
10MHz-downconverted PHD1 signal (green trace, arb. units)
Closed loop noise on the telemeter signal (µm)
1,E-05 1,E-04 1,E-03 1,E-02 1,E-01 1,E+00 0,01 0,1 1 10 100 Offset freq (Hz)
closed loop noise on the telemeter signal (µm/√√√√Hz)
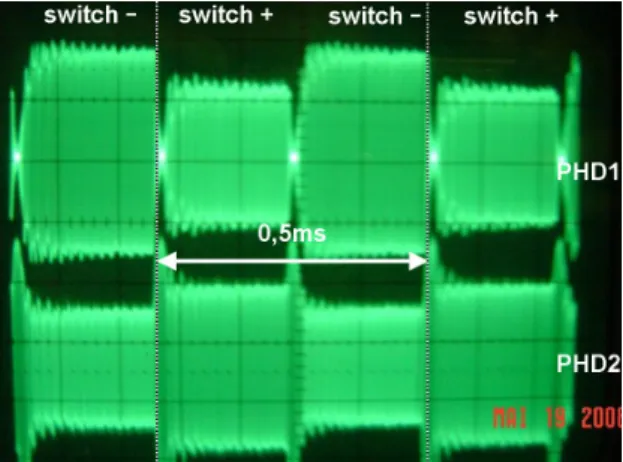
Fig. 6: Oscilloscope trace showing the amplitude of the two 10MHz signals to the phasemeter during ≈2 cycles of the 2kHz switch. The sharp peaks (<100µs) occur during the switching of the polarisation controller.
gives rise to an imbalance, between the amplitudes two detected signals, that reverses with the polarisation switch. This is transformed to a "phase signal" by the amplitude-to-phase coupling in the phase meter, with the same signature as a true telemetry signal. To some extent these variations can be corrected for by subtracting the RMS signal from the telemeter signal. This is shown on Fig. 7, and the corrected signal displays
a)- stability at the 2 µm level over long periods
b)- residual noise of ≈ 3 µm peak-to-peak in the 1s to 10 s period range.
The General Photonics polarisation controller relies on piezo actuators squeezing a single mode optical fibre1. As the piezo actuators slowly drift with time and ambiant temperature, and are not maintained in a servo loop in this version of the experiment, the imperfection of the polarisation switch degrades significantly over >1hour time scales.
ii) Optical back-reflection from the photodiodes
1
www.generalphotonics.com/PolariteIImanual.htm
PHD1 and 2 are fibred photodiodes at the FC/PC standard. They seem to give rise to significant return loss (-15dB, as measured using the optional thin plate on Fig. 3). Interference between the reflected beams at PHD1 or 2 and at the (AR coated) collimator have been identified as the source of the residual noise mentioned in 3.2.i)-b above. The corresponding interference is modulated in sign and amplitude as the optical length between PHD1 (or 2) and the collimator changes: this is obvious from the change in the noise spectrum when any of the optical fibres involved is heated, or when the optical frequency of the master laser is scanned in the GHz range in about 50s. Lowering this interference is required before improving the precision below the µm range. On the other hand, the fibred PBS has return loss of -50dB and should not lead to a significant return at this stage.
4. DISTANCE MEASUREMENTS
An 8 m path has been implemented (see Fig. 3) for characterisation of the telemeter.
4.1 Coherence of the frequency measurements As explained in Sect. 2, the distance measurement starts by measuring the HF frequency
F
at two zeroes,K
andK
+
1
, so as to extract the value of the integer numberK
. More generally one can measure the HF frequency at zeroK
,K
+
1
,...N
K +
whereN
is an integer2. The different HF frequency measurements should lead to the sameK
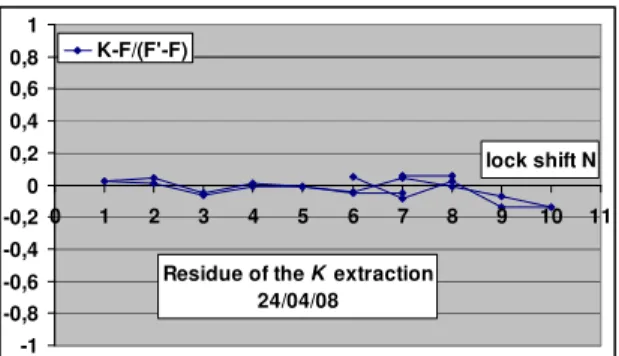
value, and to the same value of the distance measurement.First, a wrong value of
K
would give an error ofmm
12
2
/
=
Λ
. Indeed the extraction ofK
shows no error, and the residues are much smaller than 1 (Fig. 8).
2
The case
N
=
half-integer also leads to a zero of the lock-in output (telemeter) signal. However more thorough investigation shows that, on half-integer zeroes, the telemeter signal has different characteristics as regards HF couplings and contributions from optical interference. In particular, any cross-talk from a HF signal at frequencyF
leads to noise and systematic errors. The "true" (integer) zeroes are essentially immune to this kind of errors.Fig. 7: Stability of the corrected telemeter signal over ≈ 1H
Residue of the K extraction 24/04/08 -1 -0,8 -0,6 -0,4 -0,2 0 0,2 0,4 0,6 0,8 1 0 1 2 3 4 5 6 7 8 9 10 11 lock shift N K-F/(F'-F)
Fig. 8 residual error in the determination of the zero lock index K.
Then, the different length measurements should coincide. This is shown in Fig. 9.
The data are obtained by locking to zero the "corrected" demodulated phase signal. The subtraction of the contribution due to amplitude-to-phase coupling has been chosen for the very first lock point, but the coefficient of the subtraction is not appropriate for all lock points: some point have significant dispersion. We do not know why the coefficient for subtraction of the amplitude effect differs from a lock point to another one.
Fig. 9 displays the data at the lock points where efficient subtraction could be obtained. The data agree within a few microns, with a trend to a measured distance that increases with time. This may reflect thermal expansion of the optical table or/and a drift of polarisation controller during the ≈1hour data taking.
∆ ∆ ∆
∆L(mm), selection of the
data points with low dispersion
7654,844 7654,846 7654,848 7654,850 7654,852 7654,854 7654,856 0 2 4 6 8 10 time series
Fig. 9: The values of the distance measurement The two red envelopes display the statistical dispersion on each measurement, after averaging over ≈10 frequency measurements. The frequency data the same as in Fig. 8 above, except that the values with large statistical dispersion have been
discarded.
4.2 Stability of the distance measurements
The time evolution of the distance measured at a given lock point is shown in Fig. 10.
time record of the length measurement 7.74267 7.74268 7.74269 7.74270 0 1000 2000 3000 4000 5000 6000 time (s) length (m) Stability of the length measurement 0 1 10 0 1 10 100 1000 10000 sample duration (s) Allan deviation (µm)
Fig. 10: Stability of the measured path length. Upper curve: Time record of the measurement. Lower curve: Allan deviation of the corresponding
distance measurement in µm.
In the Allan deviation data (lower curve in Fig. 10) one notices the ≈1 µm, short term (1s - 10s) noise already mentioned in 3.2.i).b. The long term variations are likely to involve thermal changes of the 2.5 m long optical table.
5. CONCLUSION AND PERSPECTIVES In this paper we demonstrate a new telemetry that uses a two-mode laser source and exploits the phase of the modulated beam on its way back from the target. Cyclic errors, the usual limitation of this kind of telemetry, are here absent, as
- the phase is not measured but locked to zero by controlling the frequency of the beat note,
- the roles of the two photodiodes, with respect to the reference and measurement paths, is switched at a kHz frequency.
This approach is potentially capable of high accuracies, as the distance determination entirely relies on a frequency measurement, with no need to know, or even stabilise, the optical frequency of the laser source.
The first tests of the telemeter used 1.06µm single mode YAG lasers, and an 8 m air path on the optical table. They provide upper limits for the measurement: 0.5 to 2µm depending on the time scale.
2µm
.1
Two different sources of instability of the measurement have been identified. One is due to the amplitude-to-phase coupling in the phase-meter. The second one is due to interference between the beam reflected at the fibred collimator and the beams reflected at the fibred detection photodiodes. To improve the amplitude-to-phase coupling problem, better polarisation switch of the beams is necessary. The polarisation controller used so far has long-term drifts that are difficult to prevent: the usual solution (closed loop operation) is here not applicable. Another fibre-integrated polarisation management module exists, more directly dedicated to switching a polarisation by 90 degree3, and inherently more stable on long time scales. This should reduce the imperfections of the switching of the polarisation, and hence the interference that gives rise to the imbalance of the detected signals. Finally the residual imbalance could be locked to zero by control of the polarisation of the beam entering the PBS cube. This seems necessary, since anyway the reference/measurement beam intensity ratio will change in actual long distance ranging due to variable link budget when measuring variable distances.
As to the back reflection from the photodiodes, a factor of about -20dB should be obtainable with FC/APC fibred photodiodes. Another factor (between -10 and -20dB) can be obtained using an optical isolator before each of the two photodiodes, not to mention a collimator with a specific, high quality antireflection coating.
For these reasons we expect that this simple telemeter design will reach accuracies significantly below the micron range. By comparison, the superheterodyne interferometry method [4] has recently reached an accuracy of 160nm, but at the expense of a considerably more complex set-up [5].
We thank Emeric Faraud for contributing to the lock loop electronics and to the experiments. This work is supported by CNES (Centre National d'Etudes Spatiales). C. C. acknowledges a doctoral grant from Thales Alenia Space and Région PACA.
REFERENCES
1. J. M. Rüeger, Electronic distance measurement, Springer Verlag, Berlin (1990).
3
www.generalphotonics.com/pdf/PolaSwitch.pdf
2. Amann M.-C. et al, "Laser ranging, a critical review of usual techniques for distance measurement", Opt. Eng. 42, 10-19 (2001). 3. Ye J., Opt. Lett. 29 , 1153-1155 (2004)
4. Dändliker R., Thalmann R., Prongué D.
"Two-wavelength laser interferometry using
superheterodyne detection", Opt. Lett. 13, 339-341 (1988).
5. Schuhler N., Salvadé Y., Lévêque S., Dändliker R., Holzwarth R. "Frequency-comb-referenced two-wavelength source for absolute distance measurement" Opt. Lett. 31, 3101-3103 (2006)