THE DISTRIBUTION OF HEAVY PRECIPITATION ASSOCIATED WITH EXTRATROPICAL CYCLONES
IN NEW ENGLAND by
DAVID LAWRENCE TWEEDY B. A., Northeastern University
(1963)
SUBMITTED IN PARTIAL FULFILUYENT OF THE REQUIREf4NTS FOR THE
DEGREE OF MA"STER OF SCIENCE
at the
MASSACHUSETTS INSTITUTE OF TECHNOLOGY May, 1965
LINDGREN
Signature of Author ... . .... . .. * o . . .
.-Department of Meteorology, nly 21, 1965
Certified by . . . . . . . . . . ... . Thesis Supervisor
Accepted by ... . .0.... . . . 1. . .-..-%. . . . . Chairman, De tmen Committee on Graduate Students
THE DISTRIBTION OF HEAVY PRECIPITATION
ASSOCIATED WITH EXTRATROPICAL CYCLONES
IN NEW ENGIAND
by
DAVID LAWRENCE TWEEDY
Subitted to the Department of Meteorology on 21 May 1965 in Partial Fulfillment of the Requirements for
the Degree of Master of Science
ABSTRACT
Nineteen extratropical cyclones chosen on the basis of having
deposited at least 1.5 inches of rain in southern New England were exanined. In fifteen, the outstanding feature of the distributions
of total precipitation were heavy bands elongated in the direction
of the 50mb winds. Of the four not displaying such bands, three were slow-noving occluded cyclones and data was incomplete for the fourth. Better defined bands accompanied fastenoving, intensifying surface lows and/or intense short waves or deep, unstable troughs at 50Cnb. Less organized distributions accompanied slower-moving, filling surface lows and generally weaker flow aloft. The heavy
band occurred approximately coincident to, or west of the
sur-face low path in 10 cases and east in 5 cases.
A detailed analysis of selected storms with especially
well-ordered distributions showed that the maximum rain coincided with
the axis of an intense low-level southerly jet which attained
velocities of 50 rn/sec in one storm, as deduced from radar echo velo-cities. The bands were explained by the presence of the jet and its movement, which was parallel to its axis and also parallel to the
500mb winds. The preferred region for convection along the axis was qualitatively explained by assuming the maintainance of
relative-ly constant instability by intense low-level moisture and
tempera-ture advection and by large vertical shear beneath the axis, the
combined effect tending to creat turbulent growth according to the Richardson number. The assunption of such a convection mechanism is consistent with the observed differences in the distribution of precipitation deposited by squall lines and cyclonic storms.
Thesis Supervisor: Dr. Pauline M. Austin
ACKNOWLEDGEMENTS
I am indebted to Dr. Pauline M. Austin for the invaluable
suggestions, guidance, and encouragement she has given me during
the writing of this thesis.
Appreciation is expressed to Professor Frederick Sanders for
his sound coments which helped clarify certain observations.
Special thanks go to Mr. Steven A. Ricci for his aid in
pre-paration of figures and to several fellow students for coments and
help in the presentation of data.
I express my utmost gratitude to Miss Peggy Brown who, not only masterfully typed the manuscript, but offered suggestions and corrections which have given continuity to the overall presentation.
Finally, appreciation is expressed to Mrs. Jane McNabb and Miss Penny Freeman for producing copies of the text.
TABLE OF CONTENTS
ABSTRACT i1
ACKNOWLEDGMENTS 111
TABLE OF CONTENTS iv
LIST OF FIGURES v-vii
LIST OF TABLES viii
INTRODUCTION 1
SELECTION AND PRESENTATION OF DATA 6 A . Criteria for Storn Selection 6
B. Data Sources 7
C. Data Presentation 10
DISCUSSION OF RESULTS 52
A. Accuracy of Data 52
B. Cbaracteristics of Storms in Group I 56
C. Charcteristics of Storms in Group II 63
D. Characteristics of Storns in Group III 65
FURTHER ANALYSIS OF INTENSE GROUP I STORMS
68
A. 17-18 September, 1962 68
B. 29-30 November, 1963 71
C. 6-7 January, 1962 83
D. 24 October, 1959 89
E. Significance of the Low-Level Jet 89
CONCUJSIONS 94
Fig. la. Fig. lb. Fig. 2. Fig. 3. Fig. 4. Fig. 5. Fig.
6.
Fig. 7. Fig. 8. Fig. 9. Fig. 10. Fig. l1. Fig. 1b. Fig. 12a. LIST OF FIGURESTotal precipitation during 14-15 April, 1964.
Example of the consistency of distribution dur-ing 14-15 April, 1964.
Total precipitation during 20-21 Janury, 1964.
Total precipitation
1963.
during 29-30 November,
Total precipitation during 29 September, 1963.
Total precipitation 1962. Total precipitation 1962. during 10-11 November, during 17-18 September,
12 hours AM precipitation, 1 April, 1962.
Total precipitation during 6-7 January, 1962.
Total precipitation during 16 April, 1961.
Total precipitation during 1-2 November, 1960.
24 hour precipitation during 31 March, 1960.
Total precipitation during 30-31-1 March-April, 1960.
24 hour precipitation during 24 October, 1959.
Fig. 12b. Fig. 13. Fig. 14. Fig. 15. Fig. 16. Fig. 17. Fig. 18. Fig. 19. Fig. 20. Fig. 21. Fig. 22. Fig. 23. Fig. 24a. Fig. 24b.
Total precipitation during 23-26 October, 1959.
Total precipitation during 30 November, 1957.
Total precipitation during 23 October, 1956.
Total precipitation during 26 November, 1956.
24 hour precipitation, 7 November, 1963.
Total precipitation during 5-6 December, 1962.
Total precipitation during 27-28 September,
1962.
Total precipitation during 26-27 May, 1961.
Hourly and daily raingage stations in eastern Connecticut.
An example of cell motion on the SCR 615-B
(
A= 10 cm) radar PPI.Smoothed topography of New England showing north-south oriented ridges and valleys.
Hourly surface maps for the September 17, 1962.
Cross section perpendicular to the warm and
cold fronts through Nantucket.
Cross section perpendicular to winds using radar derived precipitation velocities to estimate the maximum winds.
Fig. 25a-k. Fig. 26. Fig. 27. Fig. 28. Fig. 29-b. Page 8.
Radar echoes and equivalent rainfall rates using AN CPS-9 and SCR 615-B radars at the Massachusetts Institute of Technology.
Centers of areas with respect to hourly rain-gages, chosen to represent spatial and time
variability of hourly precipitation.
Hourly area-averaged rainfall corresponding to positions given in Fig. 26.
The total distribution of rainfall over eastern United Stated during January 5-7, 1962.
Cross-section showing isotachs in r/sec at
the time of heaviest rain. The maxinun values of the low-level jet are supported by geostro-phic wind calculations.
Locations of hourly and daily raingage stations.
vii 74-79 81 82
85
87LIST OF TABLES Table Ia . Table Ib. Table II. Table III. Table IV. Table V.
Comparisons of yearly precipitation recorded
at Moodus Reservoir and five nearest daily stations for the years 1959-1963.
Comparisons of yearly precipitation recorded
at Moodus Reservoir and four nearest hourly stations for the years 1959-1963.
Averages and standard deviations for Group
I storms.
Averages and standard deviations of the dif-ference between the band axis orientation and the directions of the winds, the motions of
cell echoes, and surface lows.
Cell velocities and winds at Portland.
Maxinum southerly low-level winds and surface winds between the 5th and 7th of January,
1962.
I INTRODUCTION
The purpose of this study is to describe and explain the distri-bution of heavy precipitation associated with extratropical synoptic cyclones in New England. Here, the distributions of rainfall for a
number of typical cyclones are discussed and compared. In the past, most studies of mesoscale precipitation distributions have been
re-stricted to single storms exhibiting excessive rainfall (Bergeron
1960; Newton 1957; Huff and Chagnon 1964).
A typical or representative pattern of rainfall is important
to the hydrologist who is interested in making short range flood forecasts for specific watersheds. To the meteorologist it is a
manifestation of dynamical interactions between the mesoscale and synoptic scale events. To maximize the possibility of observing interactions, situations were chosen for study which were charac-terized by both intense mid-tropospheric cyclonic circulation and
heavy precipitation at the surface.
It is important to discern to what extent a given distribution
of rainfall is characteristic of the synoptic event which produced
it. For a squall line, the distributions have been well documented.
Newton and Newton (1958), for example, found that a series of nearly parallel elongated bands marked the passage of what appeared to be
a typical squall line moving across the United States. The bands were oriented from southwest to northeast, but to the right of the direction of the 70Cmb winds at the time of occurrence. The observed
-2-pattern was a result of the structure and motion of the squall line.
A line is composed of groups of cells separated by areas of very
light rain. The bands found by Newton and Newton represent the paths
of these cell groups. Cochran (1961) examined both the motion and
structure by tracking cell groups, using a moving grid superimposed upon range-corrected signal intensity contours from the SCR 615-B
( A= 10 cm) radar at the Massachusetts Institute of Technology. For
nine lines, the average velocity of cell groups was 9 m/sec at 261 de-grees, so that the velocity component of the line perpendicular to itself was about 4.5 m/sec. The average 700mb and 500mb winds were
17 m/sec at 248 degrees and 24 m/sec at 248 degrees respectively.
The motion of some of the individual cells within the cell group
for these same nine squall lines were examined independently by Austin
(1961) who found that they moved essentially with the same velocity
as the 700mb winds. It is evident that as the cells dissipate, new ones tend to form on the right rear edges of the groups, and the
re-sultant group velocity is to the right of the wind direction.
In contrast to squall lines which have well defined structure, warm frontal rain associated with cyclones appears to be characterized by diverse sizes and types of precipitation areas which are not organized in any apparent way. Ligda (1953), using radar data and pilot observa-tions, noticed four distinct echo patterns as a warm front advanced from the south. These may be referred to as stratiform areas, cumuliform
groups, convective cell lines, and bands of large convective cells, listed in the order in which they appeared, although Ligda does not
-3-precipitation areas with the 700mb geostrophic winds. The speed
corre-lation was 0.81 and the correcorre-lation of the variation in direction was
0.96 for a sample of 90 areas under various synoptic conditions. A
smaller sample of warmfront echoes produced similar correlation
coefficients. Austin (1960), using the Massachusetts Institute of Technology radar, also traced the movement of cell groups over New England for a synoptic situation similar to many studied here. A
surface low was located in the Great Lakes-Hudson Bay region with a north-south cold front west of New England and a warm front to the south. Individual convective showers were located in a broad band of
lighter rain. These showers were about 2-5 miles in diameter and 15,000-20,000 feet in height, and moved rather consistently from southwest
to northeast with a velocity which, according to radiosonde observa-tions, was in good agreement with the middle tropospheric wind
(5,000 feet to 18,000 feet). The larger band of light rain had a more
easterly component and moved more slowly than the smaller showers. The total distributions of precipitation for these storms were not investi-gated.
The convective rainfall associated with the deep, occluded cy-clone of November 18, 1948 over the southern United States has been studied by C. W. Newton (1957). A plot of the 24-hour rainfall on November 18, 1948, showed the isohyets to be arranged in a relatively narrow band about 1300 km in length. Using the Hydrologic Raingage Network, Newton was able to plot hourly amounts of rainfall and follow
the progress of the individual rainstorms. Also, the hourly rates of precipitation under respective storms were found by calculating the
velocity and diameter of the storms and ascertaining how long each
spent over a particular gage.
Three striking characteristics of this storm are the intensity of rain and total amounts, the similarity between successive cell trajectories, and the long life of individual rainstorms as traced
by the hourly raingage network. A large area from Louisiana to
Ten-nessee received 6 inches or more of rain and many stations measured more than 8 inches in 24 hours. The cell paths were surprisingly close together, some nearly coincident. One storm was visible on the
raingage network for 20 hours.
Unfortunately, Newton did not have weather radar pictures of this event. A precise tracking of cells rather than rain areas would have
provided even more information on the development and movement of the
storms. Newton could not find any identifiable feature of the flow
pattern, either at lower or upper levels which remained fixed during
the period in which the rainfall formed in one locality. He suggested
that this distribution was due to pure chance, or to some particular condition set up by the rainstorms themselves, perhaps in combination with some geographical features, and concluded that such behavior cannot be explained by stationary features o.f the large-scale flow. However, the movement of the general area of rain (0.2 in/hr or more) coincided with the movement of the 500mb low, each being displaced about 100 km eastward. The width of the 2 inch isohyet or total rain
was about 100 km also. It would appear, therefore, that the position
of the small area where most cells were observed to form was more
-5-would indicate. This case is a well developed squall line which
showed little movement as a line, but whose individual cells moved
similarly to those of more conventional squall lines. The mesoscale
distributions of precipitation associated with a number of
extratro-pical cyclones will be investigated here utilizing methods of analysis
-6-II SELECTION AND PRESENTATION OF DATA
A. Criteria for Storm Selection
Four criteria were used in choosing a storm for study.
1. Fall, winter, and spring storms which displayed a warm front
south of New England were chosen. Summer and late spring squall lines
were specifically excluded.
2. The total precipitation for the storm should exceed one and one
half inches at least at one station in the southern New England area,
where orographic effects are expected to play a lesser role in deter-mining the total rainfall than in the more hilly regions to the north.
The minimum limit of 1.5 inches was established in order to reduce the percentage variation between raingages caused by temporary wind condi-tions at the gage site and variacondi-tions resulting from performance and exposure differences.
3.
The third criterion is that the rainfall as measured by the hourly raingages must exceed 0.30 in/br at one or more stations in New Eng-land. This is the rate which is defined as "heavy" in the Manual of Surface Observations (WBAN), (November, 1961, p. 27).4. Storms should be preceeded and followed by 24 hours of no
signi-ficant rainfall in order that both hourly and daily observations can be utilized to plot the precipitation from a single storm. The fourth
-7-over southern New England against a background of steady, but light precipitation of long duration in western and northern sections.
B. Data Sources
Hourly Precipitation Data (p. 8). Data are published monthly throughout the year going back to 1950. The density of the hourly
network is about one station per 30 mile square in Vermont, New Hamp-shire, and upper New York state. In Maine, there is about one every
60 mile square and in southern New England, Long Island, and eastern
New Jersey, the density is about one station per 15 mile square. The amounts of precipitation measured in the preceding hour as well as
daily and monthly totals are given.
For each storm, the total hours of rain, maximum hourly rain at any station, and percentage of the total rain contributed by hours of
"heavy" rain are obtained. Two or three stations in the region of
heaviest rainfall are used to compute these quantities. It is usually
found that several rainfall "peaks" occur during the course of the
storm. The number of these distinct maxima is included.
Climatological Data. This publication contains daily precipita-tion amounts collected by cooperative observers located throughout each state. The daily raingage network has a density of one gage per
5-15 mile square in southern New England and one per 30 mile square
in northern New York and Maine. The density using both networks is
quite sufficient to measure the variations encountered in the storms
-8-Caribou to 0 0! 0* oo OOW* 0 - o 0 .1 0 0o / .01 0 . o .o0 .0 -/'. ' -' o0-*0 -0~ . ' lo. -/ o . I . ' . . ... , . .0 -0-o- o . ' o-oPortland 0 0 0 *0 o* * ) o * 0 %.o 0 0 * * . o. ' o. o -- .P-.t.lo.d o.
1
0*.0
.
4
i
ly 0 .0 .1o 0 0 o'.: 0.1 0 0 S* . 40 miles 0 100 *0 0 . A.bIantuck tA..ay0 . - 01.---g R AiN GA GE NETWOR K
0 I0 .'- . . o Hourly .b o . . - . Daily ..o o. -*.o --.- ..-- 0 . - o - .0o - | 0 . 0. . 9* o0 'o | - .'1 0 1 0. . . - 'O.u-o .., - * 0 ,. % . . ' - 0 Nantucket "14 o . . o ewild
-9-Radar Data. Both the AN/CPS-9 and SCR 615-B radars which are operated by the Weather Radar Project at the Massachusetts Institute of Technology were used in this study. The PPI and RHI displays are in the form of integrated, range corrected, iso-echo contours, as des-cribed by Kodaira (1957). The echo direction and speed was measured
by successive PPI photographs, while the maximum heights and the
level of the bright bands were taken from RHI photographs. Echoes larger than five miles in any dimension are classified as "areas", while all others are referred to as cells. Sometimes, the tops of
cells were sheared by the winds at that particular level and mention
is made of this whenever it was found. The iso-echo contouring
de-vice is particularly useful for studying cell movements against a
background of steady light rain. Contours were always chosen which best classified echo movement. Cell velocities given here for radar echoes, as well as surface lows, and winds are in meters per second.
Synoptic Data. For each storm, the 850, 700, and 500mb winds are presented for the five radiosonde stations in the New England
area. The winds were chosen at a time preceding or coincident with
heavy rain in southern New England. In order to allow wind
compari-sons with echo velocities, radar data was also chosen at this time whenever possible. The 700mb temperature and 700 and 500mb relative
humidities are given for the time nearest to or preceding heavy
rain-fall in the vicinity of a particular station. Surface synoptic maps
transmitted by teletype and daily maps are utilized in the discussion of synoptic events accompanying the rainfall, and in the computation
-10-of the velocity -10-of the surface lov. Finally, the Showalter stability
index was computed for the station nearest the region of heaviest rain
at observation time. Any category of data which is missing is simply
omitted.
C. Da ta Presentation
The data as just described are presented for nineteen storms
selected by the above criteria. The storms are divided into three
groups according to their precipitation distribution and are listed in reverse chronological order.
The first group consists of fifteen storms characterized by a
precipitation distribution in which heavy areas of rain are elongated
in a direction sirailar to that of the winds at either the 500mb or 7rab level. In the second group are two storms in which the heaviest
total rainfall lies along ridges in New England. The two storms in
the third group did not appear to fit into either of the other two
groups.
The maps of total rainfall are based on both hourly and daily
networks unless an hourly total is specified in which case only the
hourly network was used. Heavy lines are one inch isohyets and lighter
lines are one-half inch isohyets unless otherwise indicated. Areas
where a certain depth of rainfall was exceeded are shaded to emphasize
the features of the distribution. The direction of the long axis of each shaded area is given for the storms in Group I.
/
.op
'I ~ *1o~
O
40mi
.. o..0
14-15 April
1964
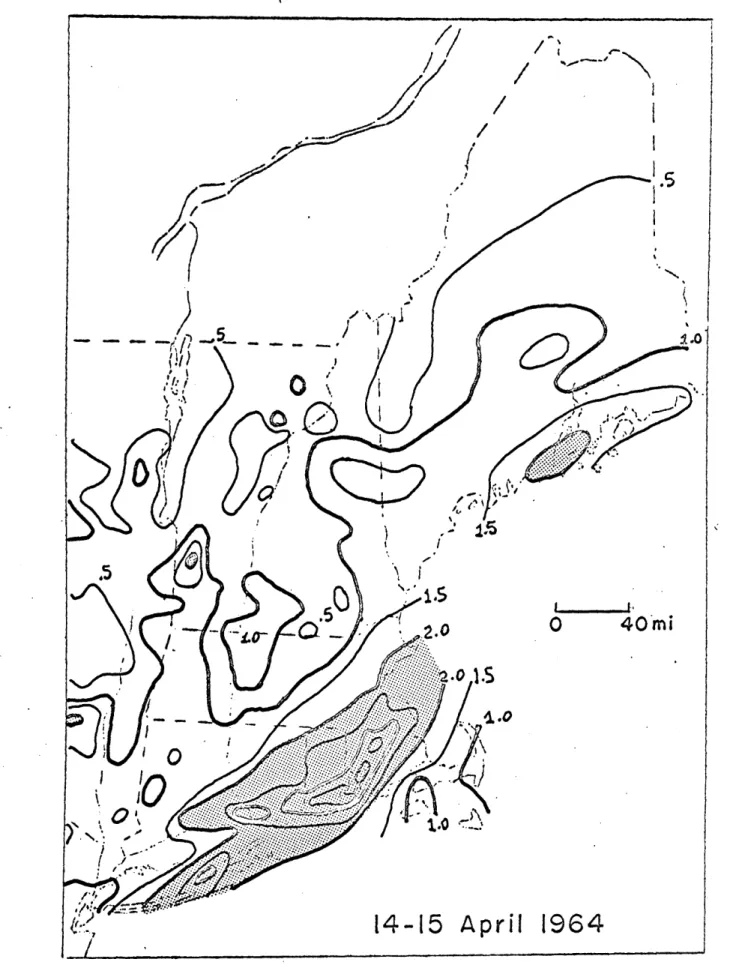
Figure la: Group I. Total Precipitation: 2.0 incbes.
-13-GROUP I
1. 14-15 April 1964
Synoptic:
An occluded cyclone moved from Lake Superior to eastern Hudson
Bay during the period of heavy rain in New England. Showers occurred far in advance of the trailing cold front on the afternoon of the
fourteenth. The showers during the early morning hours of the
fif-teenth coincided with passage of an intense 500mb short wave. The new surface low did not become organized, however, until some 12 hours
after precipitation ended.
Surface Low Velocity (Great Lakes): 215 13 n/sec
Radiosonde: T7 0 0 r 7 0 0 Albany 0
65
Idlewild 1 90 Nantucket 0 95 Portland 0 80 Caribou -2 85 Static Stability: r50 0 255 85 7855
82 Idlewild Cell velocity: Area velocity: Bright Band:Maximum cell height:
Raingage: Winds at 1900 EST, 850 700 230 14 240 19 230 14 230 23 200 18 220 13 210 24 220 20 220 26 220 23 at 1900, April 14: April 14 500 230 33 210 24 230 15 220 32 220 28 5 210
C6
220 19 8,000 feet 20,000 feetMaximum hourly rainfall: 0.4 in/hr
Percent of total due to hours of heavy rain: 750
Total duration of rain: 30 hours
Number of peaks of rain: 3 - 4
Band Axis: 230
20-21 Jan. 1964
2. 20-21 January 1964
Synoptic:
A surface low moved from Virginia to Nantucket in twelve hours. It then occluded and drifted slowly eastward. The heaviest rain fell
whil the cyclone was on a northeast track during the first twelve
hours. As occlusion began, the precipitation became light and steady. Surface Low Velocity: 235 14 m/sec
Radiosonde: T700 r 700 Albany -4 806 Idlewild 0 93 Nantucket -2 87 Portland -3 80 Caribou Static Stability: r5 0 0 5055 75 67 53 Idlewild Winds at 1900 EST, 850 700 130 21 160 21 24 11 253 13 177 21 213 23 195 23 207 20 229 20 at 1900, January 20: January 14 500 241 22 235 24 232 24 235 17 4
Maximum hourly rainfall: Percent of total due to hours
Total duration of rain:
Number of peaks of rain:
Band Axis (Portland vicinity):
0.6 in/hr of heavy rain: 505 18 hours 3 - 4 200 Rai ngage:
7
1/
2-'
/jx
.5,-1.5.5
29-30
Nov. 1963
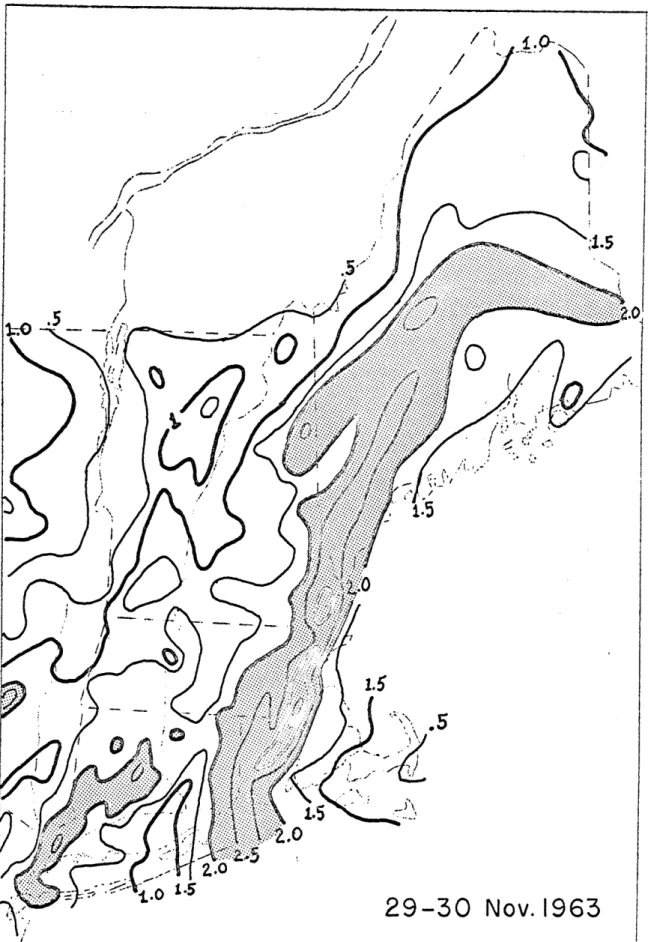
Shaded areas greater than 2.0 inches.
L.
3. 29-30 November 1963
Synoptic:
A very intense low moved from southern Virginia to New York City in twelve hours and to Quebec City in the next twelve hours.
About 90M of New England's precipitation was recorded by the time the surface low reached New York City.
Surface Low Velocity: 190 15 m/sec
Radiosonde:
Winds at 1900 EST, November 29
T700 r 700 Albany Idlewild Nantucket Portland Caribou 2.9 0 2.13 1.1 0 58 5 80 86 92 89 Static Stability: 850 43 71 71 74 180 32 199 24 188 32 181 24 188 19 700 500 216 32 180 31 188 28 198 27 195 28 206 38 214 28 Idlewild at 1900 November 29: Nantucket: Portland: Cell velocity: Area velocity: Brisht Band:
Maximum cell height: Shear:
190 45
203 42
11,000 feet
35,000 feet
moderate, tope north
Maximum hourly rainfall:
Percent of total due to hours of heavy rain: Total duration of rain:
Number of peaks of rain:
Band Axis (Portland, Nantucket vicinity):
0.95 in/br 75; 16 hours 3 200 Radar: Rainga go:
/l
(()
i :1 f: I /1.5
. 529 Sept. 1963
Shaded areas greater than 2.0 inches.
/P %
-19- ;
4. 29 September 1963
Synoptic:
A low moved from North Carolina to New Brunswick in 24 hours.
The heavy rain preceded and accompanied warm front passage.
Surface Low Velocity: 225 16 m/sec
Radiosonde:
Winds at 0700 EST, September 29
T700 r 700 r50 0
850
700 500 Albany Idlewild Nantucket *Portland ,Caribou *winds -1.6 2.9 2.8 -0.7 -1.2 taken Static Stability: Raingage: 91 715196
66
13 80 57 8183
48
at 1900 EST 181 16 145 16 185 13 185 10 163 10 177 13 204 25 197 18 206 14 195 28 227 219 237 226 214 Idlewild at 0700, September 29:Maximum hourly rainfall:
Percent of total due to hours of heavy rain:
Total duration of rain:
Number of peaks of rain:
Band Axis: 30
34
37
28 28 10 0.5 in/br 12 hours 1 - 3 230
-20-(5
-rn~
10-11
Nov.1962
Total Precipitation: Shaded areas greater than 2.0 inches.
5. 10-11 November 1962
Synoptic:
On November 9, a low had begun to occlude over West Virginia, and rain had not yet spread into New England. During the next 24 hours, the storm moved to New Hampshire while filling slightly. Low level easterly winds accompanied the heavy rain. Precipitation ended with the passage of the occluded warm front.
Surface Low Velocity: 230 11 m/sec
Radiosonde: T700 r 700 Albany -0.6 96% Idlewild 2.5 94 Nantucket -0.5 93 Portland -3.7 69 Caribou -3.1 83 Static Stability: r 500 82% 78 75 83 53 Idlewild Winds at 850 135 35 156 4o 157 24 170 24 212 10 at 0700, 0700 ESTI 700 163 28 167 35 162 27 168 21 224 13 November , November 10 500 185 41 212 34 214 23 10: 1 Cell velocity: Area velocity: Bright Band:
Maximum cell height: Shear:
145 37
165 26
7,000 - 8,000 feet
25,000 feet
strong, tops northeast
Maximurm hourly rainfall:
Percent of total due to hours of heavy rain: Total duration of rain:
Number of peaks of rain:
Band Axis (Idlewild vicinity):
0.77 in/hr 75% 8 hours 1 - 2 207 Radar: Rainga ge:
-22-N
17-18 Sept. 1962
Shaded areas greater than 1.0 inches.
,-
-23-6. 17-18 September 1962
Synoptic:
Heavy showers occurred ahead of a weak, but intensifying low
which moved rapidly through New England. The 500nb trough showed
considerable amplification during the previous 12 hours.
Surface Low Velocity: 225 18 m/sec
Radiosonde:
Winds at 1900 EST, September 17
T700 r 700 Albany Idlewild Nantucket 2.3
4.3
4.2 Portland -0.2 Caribou 0.5 83 8096
34
83 Static Stability: Raingage: r5 0 0666
35
7168
850
700 203 19 231 17 241 11 253 13 177 21 213 23 195 23 207 20 229 20 500 237 235 235 232 235 Idlewild at 1900, September 17: -2 Portland: 1:Maximum hourly rainfall:
Percent of total due to hours of heavy rain: Total duration of rain:
Number of peaks of rain: Band Axis: 0.5 in/hr
80p,
8
hours 1 - 2 233-24-'1~ _j -. -.-. 1 . /.5
1&
I April 1962
12hrs.
AM)
12 Hours Precipitation: Shaded areas greater than 1.57. 1 April 1962
Synoptic:
The precipitation occurred ahead of the surface low which moved
from central Virginia to N-w Jersey in 12 hours. A stationary surface
front extended fron Pennsylvania to Massachusetts, parallel and
coin-ciding with the area of heaviest rainfall.
Surface Low Velocity: 215 10 m/sec
Radiosonde: T700 r7 0 0 Albany -1.0 95% Idlewild 1.5 81 Nantucket
.3
69 Portland .6 76 Caribou -4.9 94 Static Stability: r5 0 0 89% 7279
87
Idlewild Winds a850
196 11 227 21 128 05 at 0700 t 0700 EST, 700 233 22 218 28 241 14 EST, AprilMaximum hourly rainfall:
Percent of total due to hours Number of peaks of rain: Band Axis: of heavy rain: 0.97 in/hr 705) 2 - 3
246
The rainfall distribution was found using only the hourly network for the 12 hours of the morning of April 1.April 1 500 213 35 214 37 213
1:
Raingage:/
I
I / I
/
.s
I
~-io
Figure 8: Total Precipitation: Shaded areas greater than 3.0 inches.
-27-8. 6-7 January 1962
Synoptic:
An intense wave at 500mb accompanied a fast moving cyclone. The surface low moved from Memphis, Tennessee to western New York in 24 hours. Heavy precipitation fell only in the vicinity of the warm front which did not reach northern New England.
Surface Low Velocity: 225 15 m/sec
Radiosonde: T700 r700 Albany 1.0 1002 Idlewild 1.1 87 Nantucket .9 82 Portland .3 84 Caribou -5.1 93 Static Stability: r50 0 89z 55 45 52 64 Idlewild Winds at 1900 EST, 850 700 184 21 226 23 210 21 221 21 227 20 234 27 132 10 222 25 53 03 270 16 at 1900, January 6: January 6 500 246 19 223 27 246 22 213 35 268 30 7
Maximum hourly rainfall:
Percent of total due to hours of heavy rain: Total duration of rain:
Number of peaks of rain: Band Axis: 0.6 in/br 70% 28 hours 3 - 4 237 Raingage:
-28-t .5
, \
I;
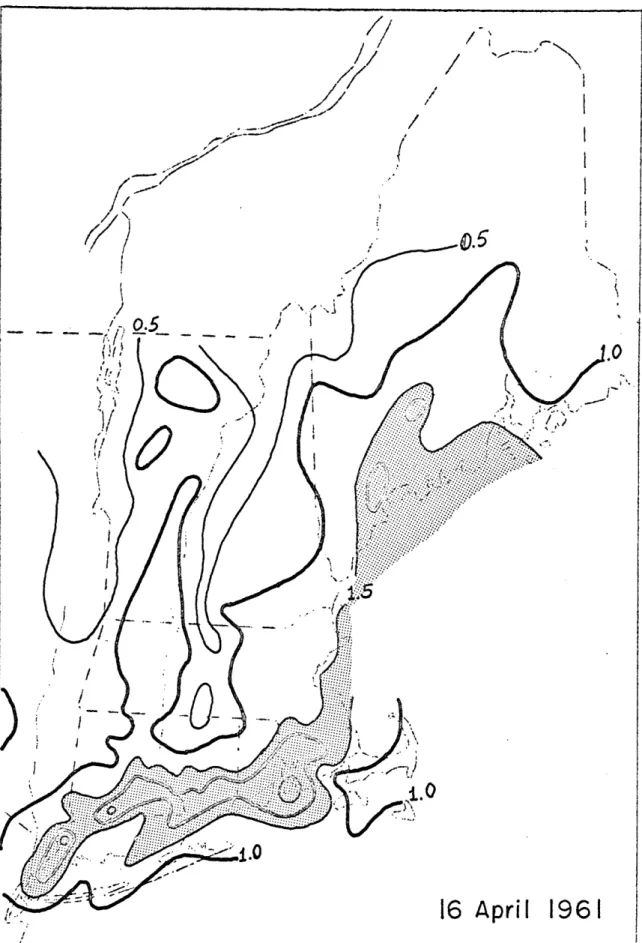
16 April 1961
Sbaded areas greater than 1.5 inches. /
-29-9. 16 April 1961
Synoptic:
A low moved from Cape Hatteras to Cape Cod in 24 hours on April 16. Heavy showers fell in southern New England ahead of the warm
front. The storm turned more easterly as it neared New England. Surface Low Velocity: 220 09 m/sec
Radiosonde:
Winds at 1900 EST, April 16 T700 r 700 Albany Idlewild Nantucket Portland Caribou -7.7
0
2.2 -0.1 -5.0 42 j97
8183
65
r50 0 17574
54
44
48
850 154 14 246 13 213 20 142 22 127 10 700 198 24 211 25 217 19 178 26 223 4 500180
207 215 214 240 Static Stability: Radar:Idlewild at 1900 EST, April 16: Nantucket:
Portland:
Cell velocity:
Area velocity: Bright Band:
Maximum cell height:
Raingage:
200 26 200 23
8,000 - 9,000 45,000 feet
Maximum hourly rainfall: 0.5 in/hr
Percent of total due to hours of heavy rain: 655
Total duration of rain: 11 hours
Number of peaks of rain: 1 - 2
-30-11/'
('1
, \ .-. 'I ~2.0
11.0
~-7)
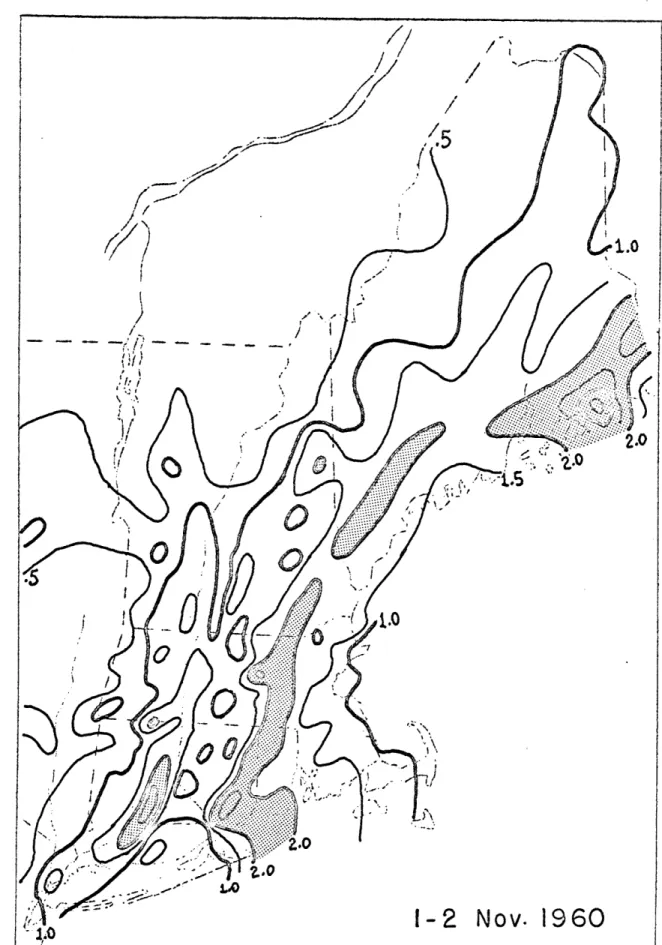
1-2 Nov. 1960
10. 1-2 November 1960
Synoptic:
A weak secondary moved from South Carolina to Massachusetts in
the 24 hours in which heavy rain fell in New England. Rain ended upon passage of the warmn front.
Surface Low Velocity: 220 13 m/sec
Radiosonde:
Winds at 0700 EST, November 1
T700 r700 Albany 0.3 999 Idlewild 3.0 83 Nantucket 4.0 43 Portland 2.9 90 *Caribou 0.8 88 *winds at 1900 17e, 30 16 17 52 850 174 16 204 16 185 14 168 08 185 17 700 205 14 220 17 194 11 205 18 188 14 500 223 27 228 22 251 21 235 17 193 14
Static Stability: Idlewild at 0700, November 1:
Cell velocity: 180 17 Area velocity: 210 13
Maximum cell height: 14,000 feet
Shear: moderate, tops northeast
Maximum hourly rainfall: 0.3 in/hr
Percent of total due to hours of heavy rain: 505
Total duration of rain: 24 hours
Number of peaks of rain: 2 - 3
Band Axis: 205
Radar:
-32-/7
-, \ / 'I I j I, ,'j,.j
0
/ 26/1'
.1' / 4. -I\
7>:
31
Mar. 1960
(
24 hrs.)
Figure lla: 24 Hour Precipitation: Shaded areas greater than 1.5 inches.
-33-/
/1.0
/
.ZQ 1~-'I(/)
\ (--~ \30-31 -1 Mar.
April
1960
-34..
11. 31 March 1960
Synoptic:
A weak low moved from Lake Erie to southern New Hampshire in the
24 hours in which the map applies. The center was filling during this tine. Precipitation fell ahead of the cold front in the warm air. About 955 was recorded in the 12 hours of the morning.
Surface Low Velocity: 260 08 m/sec
Radiosonde: T700 r 700 Albany -1.0 88ep Idlewild -1.7 75 Nantucket 1.5 72 Portland 0 90 Caribou 0 92 Static Stability: Winds at 0700 EST, r500 850 700 6 5r 217 11 216 17 51 211 13 210 17 42 211 22 202 20 63 218 21 206 32 65 235 16 229 21 Idlewild at 0700, March 31: Cell velocity: 208 26 Area velocity: 230 22
Maximum hourly rainfall: 0.41 in/hr
Percent of total due to hours of heavy rain: 855a
Total duration of rain: 11 hours
Number of peaks of rain: 2 - 3
Band Axis: 214
The total distribution for the three day period is included in order to show the effect of the band on the total distribution.
March 31 500 194 21 224 23 200 21 216 23 234 28 2 Radar: Raingage:
-35-//
/
1/
1.0
__ I-'I.. p/
1=24 Oct. 1959
(24
hrs.)
Figure 12a: 24 Hour Precipitation:
greater than 3.0 inches.
1 inch isohyets: Shaded areas
-36-7
I
7 'XI /(,)
I'
/'go
:
.0
-< I'l I ,~.1 -. tf V \23-26 Oct. 1959
Figure 12b: Total Precipitation: 2 incb isobyets, 1959.
-37-32. 24 October 1959
Synoptic:
Heavy rain fell ahead of the warm front beginning in the morning
of the 24th, while an intense low began to occlude over the Great Lakes. The warm front moved from North Carolina to Pennsylvania in
12 hours.
Velocity of warm front: 18 m/sec
Radiosonde:
Winds at 0700 EST, October 24
T700 r 700 Albany 4.8 77% Idlewild 4.2 90 Nantucket 2.8 81 *Portland 2.5 84 **.Caribou 2.0 85 *winds at 1300 EST **winds at 1900 EST (Mount Washington Static Stability: Radar: 850 43 33 79 52 37 168 22 167 25 162 39 185 25 700 166 20 172 27 160 37 211 17 500 179 24 173 23 173 23 236 17 (800rab) wind at 0700: 135 28) Idlewild at 0700: 2 Portland at 0700: 1 Caribou at 0700: 10 Cell velocity: 170 33 Area velocity: 180 30
Maximum cell height: 44,o00 feet
Shear: moderate, tops northeast
Maximum hourly rainfall:
Percent of total due to hours of heavy rain:
Total duration of rain:
Number of peaks of rain:
Band Axis (Idlewild, Albany vicinity):
1.70 in/hr
9051 15 hours
3 - 4
-38-/ /
(
7$A
Jf- 1 / IL)-G
i0~-I 6)
Total Precipitation: Shaded areas
/ I-.
K;)
30 Nov.
1957
7inch.-13. 30 November 1957
Synoptic:
An intensifying cyclone moved from South Carolina to eastern Maine in 24 hours. Heavy rain preceded the warm front and ended
after its passage.
Surface Low Velocity: 230 19 m/sec
Radiosonde:
Winds at 1300 EST, November 30
T700 r 700
850
700 500 Albany -9.8 Idlewild -2.7 Nantucket 1.4 *Portland -0.8 *Caribou -8.0 *winds at 150067ep
8598
9095
EST 17r16
82 54 80 251 07 210 25 220 36 222 22 221 24 230 35 294 28 179 05 256 18 217 18 254 20 221 41Static Stability: Nantucket Portland:
at 1900, November 30:
Maximum hourly rainfall:
Percent of total due to hours of heavy rain: Total duration of rain:
Number of peaks of rain: Band Axis: 0.56 in/hr
80%
9
hours 2 - 3 230 Raingage: r500-y /
(
(
.~f I~ If I \ ..'. 1~ '~1 TI' I. .023 Oct. 1956
Shaded areas greater than 2.0 inches.
VI
4
ii ~
/
/ / / /(
i4.. 23October 1956
Synoptic:
A weak low moved from Cape Hatteras to New Brunswick in 24 hours.
During the heavy rain, the surface low was about 200 lam south of Cape
Cod.
Surface Low Velocity: 210 14 m/sec
Radiosonde:
Winds at 1000 EST, October 23
Tyg T700 r700ry Albany -0.2 931 Idlewild 4.0 86 Nantucket 6.3 63 Portland 5.0 85 Static Stability: Rainage: 850 r 500 649 86 54 38 Nantucket Portland:
Maximum hourly rainfall:
92 13 700 118 10 229 03 20 04 276 09 188 12 215 13 115 17 111 14 237 13 202 17 185 08 at 1000 EST, October 23: -1 7
Percent of total due to hours of heavy rain: 85e Total duration of rain:
Number of peaks of rain: Band Axis: 500 0.8 in/br 10 hours 3 215
-42-E
/
/
I
(/)
/
I'
7/.. /I
r-'I //
N ,2/
\ I .5 .25-I
x
I>
* ~L)
-7-it
6
NOv.
19 5 6
Figure 15: Total Precipitation: Shaded areas greater than 1.0 inches.
J f
N
15. 26 November 1956
Synoptic:
A weah low moved from southern New Jersey to Eastport Maine in
the 12 hours in which most of the rain fell in New England. Heavy
precipitation preceded and accompanied the warm: front.
Surface Low Velocity: 200 09 n/sec
Radiosonde:
Winds at 1000 EST, November 26
Ty70 r 70 r 500 850 700 500 Albany -8.1 65 Idlewild -5.7 58 Nantucket -2.4 88 0 Portland -4.6 62 Caribou -5.0 95 Static Stability: 70,
73
44 40 70 155 19 198 21 198 38 218 12 213 31 201 40 204 19 193 20 140 20 186 26 154 13 215 10 234 25 Nantucket at 1000 Portland: EST, November 26: 1 12 Cell velocity: 190 30 Area velocity: 197 25Maximum hourly rainfall: 0.43 in/hr
Percent of total due to hours of heavy rain: 80;
Total duration of rain: 9 hours
Radar:
-4L,3-206
.2 // /.5
(~)
.5;
I" ~ ~~1..,s;
/~)0
Figure 16: Group II. 24 Hour Precipitation: than 2.0 inches.
7 Nov. 1963
(24 hrs.)
_45-.
GROUP II
16.
7
November 1963Synoptic:
An intense low moved to a position northeast of Norfolk, Virginia
during the 7th, where it occluded. Strong low-level easterly winds
prevailed in New England. Heaviest showers accompanied passage of the
occluded warm front in soutiiern Now Engl-and.
Surface Low Velocity: 250 04 m/sec
Radiosonde: T7 0 0 r 7 0 0 Albany 1.1 96; Idlewild 2.0 99 Nantucket 0.1 95 Portland 0.2 72 Caribou Static 3tability: Winds at 1900 EST, r500 850 700 429 126 19 139 14 78 106 10 138 13 75 154 12 157 11 33 135 31 128 18 109 16 136 20 Idlewild at 0700, November 7 Portland at 1900, November 7 November 7 500 132 15 150 13 155 17 158 23 146 11 4 6 Cell velocity: Area velocity:
Maximum cell height: Bright Band:
135 25
140 22
33,000 feet 10,000 feet
Maximum hourly rainfall: 0.92 in/hr
Percent of total due to hours of heavy rain: 555
Number of peaks of rc-tn: 2 - 3
Radar:
-46-/
5-6 Dec. 1962
Shaded areas greater than 2.5 inches.
17. 5-6 December 1962
Synoptic:
There were two surface lows associated with this distribution. On the morning. of the
6t
1, one was located over western New Yorkwhile the other was 300 kmn southeast of Nantucket. Both were occluded and movin5 very slowly. A.gain, low-level easterly winds were
predo-minant during the heavy rain.
Surface Low Velocity (December 6th): Oceanic low: 190 04 n/sec Lake Ontario low: stationary
Radiosonde: T7 0 0 r 7 0 0 Albany -12.7 375 Idlewild -1.6 23 Portland -1.8 63 Nantucket -5.3 89 Caribou -0.2 96 Static Stability: r 5 0 0 180
66
2977
74 Idlewild Portland: Winds at850
141 18 150 12 129 25 152 14 130 24 at 1900, 0700 EST, 700 154 20 166 21 160 17 157 09 143 20 December 6: December 6 500 169 22 176 27 149 21 194 11 160 17 8 3 Cell velocity: 145 23 Bright B.nd:6,000
feetMaximum cell height: 27,000 feet
Shear: strong, tops northeast
Maximum hourly rainfall:
Percent of total due to hours of heavy rain:
Total duration of raia:
Number of peaks of rain:
0.48 in/hr
40;
34 hours 4 Radar: Raingage:
-48-0
2.0
27-28 Sept. 1962
Figure 18: Group III. Total Precipitation: Shaded areas greater
-49-GROUP III
18. 27-28 September 1962
Synoptic:
A weak low moved from South Carolina to New Jersey in 24 hours.
It then occluded and drifted slowly westward. Only three stations
measured heavy rain in New England.
Surface Low Velocity (until 0100 EST September 28): 190 11
Radiosonde:
Winds at 1900 EST, September 27
T7 0 0 r70 0 r 50 0 Albany Idlewild Nantucket Portland Caribou 0.4 3.2 0.5 2.5 -4.2 28 83 79 95 33') 72 71 14 28 850 291 02 280 04 240 13 286 04 246 05 700 245 07 222 10 236 18 241 13 242 10 500 232 15 238 27 240 29 237 21 252 21 Static Stability: Rainafe: Idlewild at 1900, September 27: Portland:
Maximum hourly rainfall: 0.4 in/br Percent of total due to hours of heavy rain: 10,
Total duration of rain: 38 hours
I
26-27 May 1961
Shaded areas greater than 3.0 inches. Fi gure 19: Total Precipitation:
-51-19. 26-27 May 1961
Synoptic:
A weak low accompanied by an intense 500mb short wave moved
from Lake Erie to a position 200 In east of New Jersey on the 26th, and from there to eastern Maine on the 27th. During the 27th, the
low deepened considerably. On the 26th, a squall line moved through
Massachusetts but only localized, light showers were noted. The large amounts of rain received in eastern Maine occurred on the 27th as the low approached this area.
Surface Low Velocity (May 27): 210 09 m/sec Radiosonde: T700 r 700 Albany 0.2 83 Idlewild 1.3 93 Nantucket 2.2 24 *Portland 0.7 71 *Caribou 1.7 85 *winds at 1900 EST, Static Stability: r 500 86ep 16 16 16 57 May 27 Nantucket Winds at 850 274 05 265 08 289 10 18 15 174 08 1900 EST, 700 225 15 230 14 238 21 197 12 193 21 at 1900, May 26:
Radar (afternoon of May 26): Cell velocity: 225 28
Area velocity: 245 10
Maximum cell height: 25,000 feet
Maximum hourly rainfall: 0.76 in/hr Percent of total due to hours of heavy rain: 60%
Total duration of rain: 44 hours
Number of peaks of rain: 3 - 4
M,-y 26 500 205 34 206 30 214 36 182 17 195 29 1 Raingage:
-52-III DISCUSSION OF RETLTS
A. Accuracy of Data
Precipitation Distributions. Several factors affect the collectic
efficiency of raingages and consequently the reliability of the total distribution maps. Koschmieder (1934) found that the Jevons effect
may produce signihficant loss in rainfall collection. An unshielded gae that he tested received 5051 less rain than a wind-shielded one at the same location when the ambient wind was only 12 m/sec. Proper exposure reduces the necessity of wind-shielded ga,,es and a subjective classification of exposure can explain some of the observed differences in collection (Brown and Peck 1962). Even with the elimination of vind and exposure differences, gages which appear to be similar some-times differ systematically (Watkins 1955, 1956; Andersson 1963).
In the analyses of the total distributions, only the Moodus Reservoir gage in east-central Connecticut showed a large, consistent
deviation from surrounding stations which could not be explained by
orography. Investigation showed that it had an average collection 225
lower than the five nearest daily stations and 7p lower than the four nearest hourly stations for the five years from 1959 to 1963 (Table Tle, b and figure 20). Climtatologically, the collection at Moodus
is expected to be about 10j more than the average of the four hourly stations (Knox and Nordenson, 1951). Therefore, the actual deficit
coipared to the hourly gages is nearer to 179, which agrees better
differ-TABLE I u
Comparisons of yearly precipitation recorded at Moodus Reservoir and five nearest daily stations for the years 1959-1963.
Moodus Cocka- Col- Middle-Year Reservoir ponset chester town
1959 45.86 1960 40.47 1961 E37.34 1962 E32.47 1963 32.06 Ave. 37.64 49.25 54.07 49.89 47.14 45.70 43.07 41.62 42.42 45.45 45.24 45-45 45.24 51.62 51.06 47.07 41.11 46.61 46.61
Average of Five Surrounding Daily Gages:
Norwich Pub. U. 52.85 47.20 E49.89 E39-56
47.06
47.06 45.83 Lake Konomoc E50.93 44.11 46.78 39.04 45.11 4.5.11Percent Reduction of Moodus Gage: 221
TABLE I b
Comparisons of yearly precipitation recorded at Moodus Reservoir and four nearest hourly stations for the years 1959-1963.
Moodus Hart. * Mansfield Jewett Year Reservoir Br. Fld. 1959 45.86 40.47 E37.34 E32.47 32.06 Ave. 37.64 45.14 44.43 38.97 34.57 33.29 39.28 Hollow D. City 48.62 E44.98 37.89 34.31 33.02 39.76 49.22 E44.48 E44. o 40.17 34.77 New Haven 43.08 41.65 41.28
36.64
38.20 42.53 40.17Average of Four Surrounding Hourly Gages:
Percent Reduction of Moodus Gage: 7%
E -.mount is wholly or partly estimated
* Gage equipped with windshield
1960 1961 1962 1963
.54....
Stafford Springs
Eartford W3 Airport Putnam
Burlington QBIo,=f Leld Coventry i tryu N hauZ anger Sta
INtcau
k -6'- -C-- Storrs
'I i artford Manchester 0 Broo 1yn
arav Irn ore l s d H
os Dnraordrtford eiton Drainard ).dr
ngton \
-avoir Shuttle roadow Zcavr "JCett Cit
Co jcester
Volcbtt Rosorvoir . Baltic
-j ry Radio WBRY voodu Roservoir Panchau Forect
epectO Middletown 4 W t Norwich Pub Util Pl
O
Lount Carmel QCectponzet Ranor Sta
Da zon LajeO 0 North Guilfo d Lake tonomoc
O a e North Branfor
j
L,,.Now Haven U AirPort go lford
WB AP
Greenport Power House, N. y
STATUTbE "ILES 10 0 10 20 30 4 75TH Isr,-IDIAIT T In M..Zo0U
I'
I Bloc'Figure 20: Hourly and daily raingage stations in eastern Connec-ticut. Solid circles are hourly stations. Open circles
are daily stations.
-55-ences in collection efficiency may exist between the daily and hourly
gages, but these were not examined. Although the deficits were not particularly large considering the possible sources of error, features of the distribution were sometimes amplified when only the hourly network was used (figures 12 and 16). However, the greater density of the combined networks justified some smoothing during analysis and a systematic error of 20% is usually less than one isohyet for
the storms studied here. Unless several adjacent stations have large
consistent systematic errors greater than 20f,, the mesoscale features
of the distributions will not be seriously altered.
There were several stations where consistently larger collections were probably due to orographic effects. The best examples are Slide
Mountain, New York, Pinkham Notch, and Mount Washington, New Hamp-shire. During strong convective activity, the Pinkham Notch gage collected about 105 more than the Mount Washington gage and both
collected more than stations immediately north, west, and south of the White Mountains . The very strong irinds at the summit should reduce
the collection there even when a windshield is used. It is also quite possible that the extra 4,000 feet of moist atmosphere above the notch allows a more efficient release of moisture by increased
coalescence. A simultaneous measurement of drop size distributions
at both the summit and notch might indicate whether coalescence plays a significant role there. The Slide Mountain gage also accumulates
particularly heavy amounts of precipitation when the 850 - 700mb winds have a strong easterly or northeasterly component. On November
-56-Whenever mountain stations measured amounts greatly in excess of
neighboring stations, isohyets were smoothed. When the data was consistent, a linear interpolation was used in constructing the maps.
Echo Velocities. Each storm has been assigned one cell velocity
and one area velocity, derived from motion of radar echoes on the
PPI. Since the echo motion was variable in time and space, a single
cell or area was chosen for each storm to represent echo velocities rather than computing averages, just as a radiosonde is a single
probe used to represent the wind and pressure. This method allowed
more equal weighting to each storm since data was sparse in some cases. When data was plentiful, echoes were chosen which had typical rather than extreme motion. Usually area movement was slightly slower and
to the right of cell movement, but the opposite sometimes occurred. Whenever possible, a feature on the edge of the area was tracked.
Largest deviation between area and cell motion occurred when the shape
of the area changed rapidly in time. This indicated a variable growth or dissipation rate within the area and a corresponding velocity com-ponent in the direction of growth. Another problem arose when band-shaped echoes with no prominent features rotated. In this case,
mid-points were used to track the successive positions. An example of
cell tracking is shown in figure (21). The equivalent maximum
rainfall rate and times corresponding to each trace are given. The
velocity in this case was 31 n/sec at 173 degrees.
B. Characteristics of Storms in Group I
0 0
Mi-Figure 21: An example of cell motion on the SCR 615-B (N=10 cm)
-58-areas of heavy total precipitation elongated in the direction of the mean winds, seven were accompanied by intense southerly flow ahead
of the 50CMb trough. Many of the 500mb troughs in the flow pattern
were lagged by troughs in the temperature pattern which indicated
baroclinic intensification of the cyclonic flow. The storms which can be referred to as "intense" with respect to both the amplitude
of the trough and speed of the flow are numbers 3, 6, 7, 8, 12, 13,
and 15. The precipitation band is generally better defined and
deeper in these storms. Numbers 4, 11, and 14 were characterized by weak 500mb circulation and their rainfall patterns showed somewhat
less organization. The remainder of the storms (numbers 1, 2, 5, 9,
and 10) were associated with moderate 500mb flow and their
distribu-tions varied from well-organized (number 1) to poorly organized (number
5).
Surface features were not as consistent as those at 500mb. The band of heavy rain was east of the path of the surface low in numbers
1, 3, 7, 8, and 12 and west or coincident to it in numbers 2, 4, 5,
6, 9, 10, 11, 13, and 15. It was not determined whether or not bands
occurred coincident with the paths of surface lows which passed west
of New England (numbers 1, 3, 7, 8, and 12).
A warm front was common to all storms, but varied greatly in
detectability on the surface maps. It was not necessary that a warm front move inland for heavy precipitation to be measured, and the passagre of the fronts which did move inland did not necessarily mark the end of the heavy showers. Table II gives the average values of
humi-
-59-TABLE II
Averages and standard deviations for Group I storms .*
Synoptic:
Average surface velocity: 221 13 m/sec
16 03 Radiosonde: T700 r7 00 r500 Albany -1.5 80 4 17 Idleild 1.0 85 2 9 Nantucket 1.6 76 2 22 Portland -0.5 80 2 10 Caribou -2.1 87
3
7
5f75>
2656
2163
18 52 17 62 14850
17639
19556
192 18 176 31 17345
700 197 19 33 06 219 21 28 07 204 20 20 05 193 23 22 06 220 19 20 06 500 212 27 22 09 216 27 19 08 226 24 17 07 217 24 20 07 226 24 17 08 Radar:AveraGe winds for eight storms for which radar observations were available, using only Port-land, Idlewild, and Nantucket radiosondes: Cell velocity: 186 30 21 08 185 23 194 24 19 07 19 06 Area velocity: Raingage:
Maximum hourly rainfall: 0.66 in/hr* .35 Percent of total due to hours of heavy rain: 73t115;
Total duration of rain: 14t 7 hours Number of peaks of rain:
Band Axis: 2 - 3215t17 degrees
*Standard deviations are written beneath the average to which they apply.
206 29
19 08
200 25