HAL Id: hal-00463538
https://hal.archives-ouvertes.fr/hal-00463538
Submitted on 15 Mar 2021
HAL is a multi-disciplinary open access
archive for the deposit and dissemination of
sci-entific research documents, whether they are
pub-lished or not. The documents may come from
teaching and research institutions in France or
abroad, or from public or private research centers.
L’archive ouverte pluridisciplinaire HAL, est
destinée au dépôt et à la diffusion de documents
scientifiques de niveau recherche, publiés ou non,
émanant des établissements d’enseignement et de
recherche français ou étrangers, des laboratoires
publics ou privés.
glass plate in view of sonochemical reactor design
optimisation
R. Viennet J-Y. Hihn M. Jeannot R. Berriet
To cite this version:
R. Viennet J-Y. Hihn M. Jeannot R. Berriet. Study of ultrasound transmission through an immersed
glass plate in view of sonochemical reactor design optimisation. Advances in Acoustics and Vibration,
Hindawi Publishing Corporation, 2009, ID 512839, pp.9. �10.1155/2009/512839�. �hal-00463538�
Hindawi Publishing Corporation Advances in Acoustics and Vibration
Volume 2009, Article ID 512839,9pages
doi:10.1155/2009/512839
Research Article
Study of Ultrasound Transmission through an Immersed Glass
Plate in view of Sonochemical Reactor Design Optimisation
R. Viennet,
1J.-Y. Hihn,
1M. Jeannot,
1, 2and R. Berriet
21Institut UTINAM-SRS, Universit´e de Franche-Comt´e, UMR CNRS 6213, 30 avenue de l’Observatoire, 25009 Besanc¸on Cedex, France
2IMASONIC SAS, Z.A. rue des Savourots, 70190 Voray sur l’Ognon, France
Correspondence should be addressed to R. Viennet,remy.viennet@univ-fcomte.fr
Received 17 February 2009; Accepted 6 April 2009 Recommended by KM Liew
The purpose of this paper is to improve the design of an ultrasonic reactor for industrial applications in liquids, which consists of a double-structured tank. This paper presents an experimental approach for studying ultrasonic transmission through an immersed
glass plate. Several inclination angles, between 0 and 40◦, and several thicknesses have been investigated. Acoustic efficiency was
determined using hydrophone measurements in different places in the reactor. A first reactor prototype was built and the optimised configuration defined was experimentally partially characterized and validated.
Copyright © 2009 R. Viennet et al. This is an open access article distributed under the Creative Commons Attribution License, which permits unrestricted use, distribution, and reproduction in any medium, provided the original work is properly cited.
1. Introduction
Several works have been carried out with ultrasound applied to various chemical and electrochemical processes, with great effects of ultrasound irradiation [1,2]. In the particular case of electrochemistry, modifications alter many heterogeneous system mechanisms, for example, accelerated corrosion tests which have been developed using power ultrasound at 20 and 40 kHz [3, 4]. High frequency power ultrasounds are used to improve recovery of silver from photographic processing solutions [5], electroless deposition of copper [6], or electrosynthesis [2]. As these various power ultrasound applications are often carried out in aggressive environments, they are limited to a small scale and require the use of a protective material stuck on a piezoelectric ceramic [7]. This protective plate, made of stainless steel or glass, allows wave transmission to the medium. To make this transmission possible, protective plate thickness has to be a fractional part of wavelength and depend on sound velocity in the protective material. Handling of this protective plate is often tricky, which leads to major problems in wave transmission to the medium. The protective plate material is also an important choice criterion. Use of steel for protective material requires an electric contact with the piezoelectric element that makes electromechanical reaction impossible. Consequently, use of Pyrex glass offers many advantages. This type of high
frequency transducer was developed by the Laboratory of Molecular and Environmental Chemistry (University of Savoie, Chamb´ery, France). This material exhibits good insulating and noncorrosive properties. However, Pyrex glass is not resistant to shock or thermal expansion and has low thermal conductivity that is a major drawback for transducer cooling. Moreover, poor cooling results in a decrease of transmitted ultrasonic powers and irradiation times.
The final goal of this work is to produce a reactor for which this protective glass sheet would not be stuck on the ceramic, but hang a little distance away, in the form of a double-structured tank. The inner compartment contains the reactional medium, and the transducer is attached to the bottom of the outer cell. In the space between these two cells, a noncorrosive cooling fluid can be used, making use of protective material unnecessary for the transducer. Two previous works have shown that use of an optimised slanted bottom could improve transmission characteristics of double-structured ultrasonic high frequency reactors [8,9]. Moreover, it is a well-known fact that sound transmittivity through an immersed plate is a function of incidence angle and plate thickness [10–12].
The first step in designing a reliable reactor consisted in extending the previous study to more numerous config-urations, investigating ultrasound transmission throughout a glass plate for an extensive number of inclination angles
and plate thicknesses. To conduct this study, our first aim was to simulate the ultrasound fields generated in the reactor by a 500 kHz transducer in order to define an optimal configuration. A calculation code using finite elements was used to conduct a temporal analysis of our problem. The configuration shown in Figure 1 was simulated and three angles (20, 30 and 40◦) of inclination were retained with different glass thicknesses of the slanted bottom. These values were close to the optimal ones found in the two previous works. For these simulations, the transmission coefficient is defined by W(α,e)/W0 where W(α,e) is the integral of the acoustic of the intensities in one plane reactor, for an inclination angleα and a thickness e, and W0is the integral of the acoustic intensities in one plane reactor corresponding to the available power leaving the transducer.Figure 2shows the transmission coefficient as a function of the inclination angles for 3 standard glass thicknesses. We can observe that the global shape of the curve obtained with a 3.3 mm thickness is fairly close to results of the previous experimental works [9]. A better glass plate inclination angle for wave transmission is obtained in this case at about 30◦ for a 3 mm plate thickness, where an optimal inclination angle of 30◦ has been found for a 3 mm glass plate [9]. Whereas the global behaviour of the curve obtained by simulation is always correct for a 5 mm thickness, this is not completely the case for the 2 mm thickness. Allowance must also be made for differences in calculation mode of the transmission coefficient between the various works. The simulations take into account the average of the ultrasound energy on a wide surface, while the previous works were limited to the central zone. This can account for some discrepancies in the range of magnitude of the values, and justify the choice of an experimental validation in new operating conditions to check the relevance of the code of calculation used for the simulations before pursuing the theoretical approach.
2. Experimental Study of Ultrasound
Transmission through a Glass Plate Welded in
an Oblong or a Cylindrical Reactor
This series of experiments was carried out using appropriate equipment with an ultrasonic source and a hydrophone on both sides of a plate with known thickness and inclination. The operating conditions were chosen to allow validation of the simulations, that is, they were conducted in complete reactors to take into account wall reflections. Two different geometries of reactors (Figure 3) were used: oblong (close to the simulated configuration) and cylindrical (as used in most sonoelectrochemical applications).
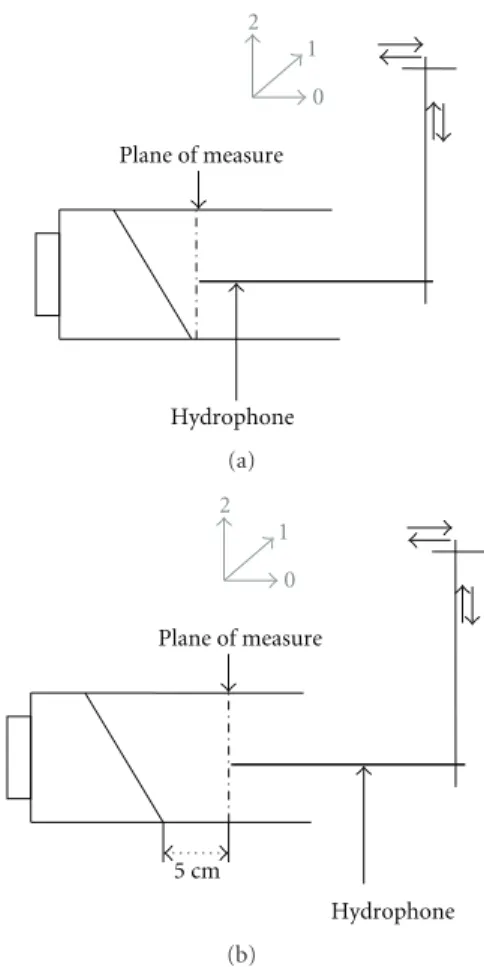
The acoustic field in the reactor was mapped using hydrophone measurements. The acoustic intensities and their distribution in the reactor were obtained by recording the peak to peak voltage in different planes inside the reactor. The hydrophone motions are described inFigure 4(mapping zones) and Figure 5 (measurement planes). In order to determine the transmission coefficient, the integral of the acoustic intensities measured in a plane for a slant plate angle
α on the integral of the acoustic intensities measured without
Absorption Reactional medium Cooling fluid Absorption Reflexion 50 mm 110 mm Thickness
Incident plan waves generated by the
transducer α
Figure 1: Simulated configuration.
0 0.05 0.1 0.15 0.2 0.25 0.3 0.35 0.4 0.45 0.5 T ransmission co effi cient 20 22 24 26 28 30 32 34 36 38 40 Inclination angle (◦) 2 mm 3.3 mm 5 mm
Figure 2: Transmission coefficient for 3 different plate thicknesses: 2.2, 3.3 and 5 mm.
plate at the same distance (corresponding to the available power leaving the transducer) has been calculated.
2.1. Oblong Reactor. Results obtained for the three
inclina-tion angles are shown inFigure 6in terms of curves at iso-intensity, graduated in dB. The greater the angle is, the more the influence of reflections on edges can be observed. This induces a deformation of the focal spot, which becomes irregular when the angle increases. The same observations were made in different measurement planes.Table 1includes the maximal values of Vpp and the transmission coefficient for three angles and two measurements planes: the first near the plate and the second at 5 cm (corresponding to Figures
5(a)and5(b)). The results presented here are more suitable to the range of magnitude of the simulated ones, due to the fact that the transmission coefficients are calculated over a larger zone (ratio of average acoustic intensity with or
Advances in Acoustics and Vibration 3 Patch of aluminium 20°, 30°, 40° 60 mm 300 mm 110 mm 200 mm Transducer (a) 60 mm 200 mm Transducer (b)
Figure 3: (a) Oblong reactor, (b) cylindrical reactor.
8.7 cm Hydrophone (a) Hydrophone 5 cm (b)
Figure 4: Hydrophone motions (a) in oblong reactor (b) in cylindrical reactor.
without plate). If we examine the focal spot, the transmission coefficient restricted to this limited area reaches a value of 80% and was obtained for an inclination of 20◦. This will be of particular interest for the electrochemical reaction which takes place at an electrode, mainly centred in the reactor.
2.2. Cylindrical Reactor. For this geometry, the hydrophone
was moved in a square (with 5 cm diagonal—Figure 4(b))
Hydrophone Plane of measure 2 1 0 (a) 5 cm Hydrophone Plane of measure 2 1 0 (b)
Figure 5: (a) First plane of measurement near the slant plate, (b) second plane 5 cm from the slant plate.
Table 1: Main results obtained in oblong reactor. Angles Hydrophone position Vpp max Transmission coefficient
20 Near the plate 2.72 0.45
5 cm from the plate 2.62 0.40
30◦ Near the plate 2.06 0.37
5 cm from the plate 1.75 0.34
40◦ Near the plate 0.66 0.11
5 cm from the plate 0.66 0.10
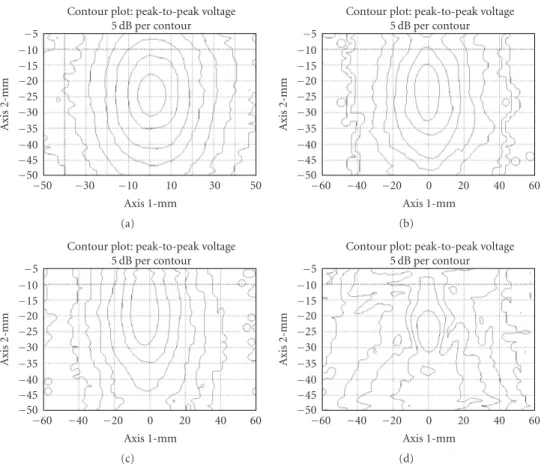
included in the cylinder diameter, and for several distances from the inclined glass plate (8, 12 and 16 cm). Results are shown for the various distances for each inclination angle. The peak-to-peak voltages (Vpp) were measured and the iso-acoustic intensity curves were drawn. For a 20◦ inclination angle, we can observe one focal spot clearly drawn in the centre of the scanned zone. Ultrasound propagates through the plate without being affected by serious deformation in distribution of the acoustic intensity that it entails. This distribution persists when we move away from the oblique plate (Figure 7). For an inclination angle of 30, the focal spot becomes irregular when we move away from the plate (Figure 8), and in the same way as the oblong reactor at maximum inclination angles, acoustic ultrasonic intensity distribution is seriously disturbed by plate presence
−50 −45 −40 −35 −30 −25 −20 −15 −10 −5 Ax is 2 -m m −50 −30 −10 10 30 50 Axis 1-mm
Contour plot: peak-to-peak voltage 5 dB per contour (a) −50 −45 −40 −35 −30 −25 −20 −15 −10 −5 Ax is 2 -m m −60 −40 −20 0 20 40 60 Axis 1-mm
Contour plot: peak-to-peak voltage 5 dB per contour (b) −50 −45 −40 −35 −30 −25 −20 −15 −10 −5 Ax is 2 -m m −60 −40 −20 0 20 40 60 Axis 1-mm
Contour plot: peak-to-peak voltage 5 dB per contour (c) −50 −45 −40 −35 −30 −25 −20 −15 −10 −5 Ax is 2 -m m −60 −40 −20 0 20 40 60 Axis 1-mm
Contour plot: peak-to-peak voltage 5 dB per contour
(d)
Figure 6: Maps of peak-to-peak voltages observed in the system without oblique plate (a), with a plate tilted at 20◦(b), at 30◦(c ) and at 40◦
(d) for an excitation burst signal of four periods with 10 Vpp amplitude.
−20 −15 −10 −5 0 5 10 15 20 Ax is 2 -m m −20−15−10 −5 0 5 10 15 20 Axis 1-mm
Contour plot: peak-to-peak voltage 5 dB per contour (a) −20 −15 −10 −5 0 5 10 15 20 Ax is 2 -m m −20−15−10 −5 0 5 10 15 20 Axis 1-mm
Contour plot: peak-to-peak voltage 5 dB per contour (b) −20 −15 −10 −5 0 5 10 15 20 Ax is 2 -m m −20−15−10 −5 0 5 10 15 20 Axis 1-mm
Contour plot: peak-to-peak voltage 5 dB per contour
(c)
Figure 7: Maps of peak-to-peak voltages observed in the system with a plate tilted at 20◦: (a) at 8 cm, (b) at 12 cm, and (c) at 16 cm from the
plate for an excitation burst signal of four periods with 10 Vpp amplitude.
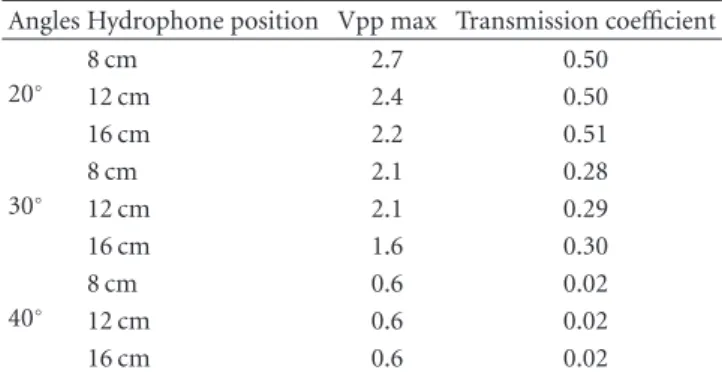
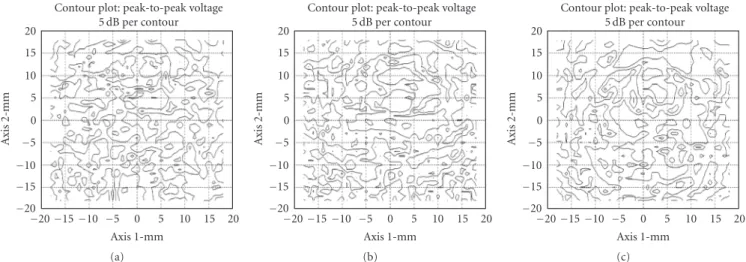
(Figure 9).Table 2includes the maximal values of Vpp and the transmission coefficient for three angles and the three positions of the hydrophone. The values obtained are even better than for the oblong reactor for a 20◦inclination angle. On the other hand, for 40◦, a marked decrease is observed with extremely weak values of the transmission coefficients.
Nevertheless, it is impossible to validate the simulation correctly in this way. The software for our arrangement uses a temporal analysis and it would have been preferable to use a harmonics analysis. 3 inclination angle values are not sufficient for complete matching of the adjustable parameters of the calculation code, and some discrepancies
Advances in Acoustics and Vibration 5 −20 −15 −10 −5 0 5 10 15 20 Ax is 2 -m m −15−10 −5 0 5 10 15 20 25 Axis 1-mm
Contour plot: peak-to-peak voltage 5 dB per contour (a) −20 −15 −10 −5 0 5 10 15 20 Ax is 2 -m m −15−10 −5 0 5 10 15 20 25 Axis 1-mm
Contour plot: peak-to-peak voltage 5 dB per contour (b) −20 −15 −10 −5 0 5 10 15 20 Ax is 2 -m m −15−10 −5 0 5 10 15 20 25 Axis 1-mm
Contour plot: peak-to-peak voltage 5 dB per contour
(c)
Figure 8: Maps of peak-to-peak voltages observed in the system with a plate tilted at 30◦: (a) at 8 cm, (b) at 12 cm, and (c) at 16 cm from the
plate for an excitation burst signal of four periods with 10 Vpp amplitude.
Table 2: Main results obtained in cylindrical reactor. Angles Hydrophone position Vpp max Transmission coefficient
20◦ 8 cm 2.7 0.50 12 cm 2.4 0.50 16 cm 2.2 0.51 30◦ 8 cm 2.1 0.28 12 cm 2.1 0.29 16 cm 1.6 0.30 40◦ 8 cm 0.6 0.02 12 cm 0.6 0.02 16 cm 0.6 0.02
persist. To obtain values as well as sufficient and reliable information to help develop a new reactor, we then decided to conduct a study with more systematic characteristics of plate thicknesses and angles of inclination.
3. Systematic Study of Ultrasonic Intensity
Transmission throughout a Glass Plate for
Various Plate Thicknesses and Inclination
Angles
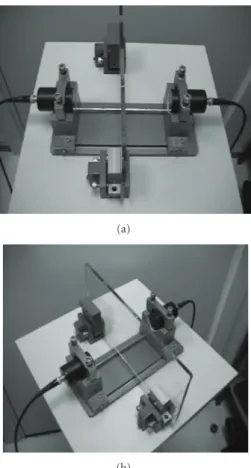
For these experiments, we used another experimental device which consists of a glass plate fixed to an axis, positioned between a transducer used in emission and another in recep-tion. The entire system is immersed in water (Figure 10). The advantages of this system are that it allows easy and continuous variation of the angle of inclination, and that the studied thickness is modifiable quickly by changing the glass plate. However, on the other hand, the reflections against walls are not taken into account and we are thus less close to the real behaviour of a reactor. Peak to peak maximal voltages were measured for inclination angles varying between 0 and 40◦, and for the following glass plate thicknesses: 2.2, 3, 4,
5, 6 and 10 mm. Transmission coefficients correspond to the ratio of the maximal peak to peak voltage with and without plate between hydrophone and the transducer. These peak-to-peak voltages were determined by calculating the integral of acoustic intensities in the measurement plane. If we examine the results grouped inFigure 11, we note that the behaviour of the curves corresponding to the 2.2, 3 and 4 mm thicknesses is very close to what we observed in the previous work [8, 9], namely, a coefficient of fairly weak transmission for the majority of inclination angles, and a very net optimum for a given angle. This also applies to the 6 mm thick plate, with a surprisingly excellent coefficient of transmission for a horizontal position (angle of inclination of 0◦), while curves are less well defined for the 5 mm and 10 mm plates.
Therefore, we arrange several (thickness/inclination angle) pairs which appear of interest for the design of prototypes of complete reactors, for example 35◦of angle of inclination for a glass thickness of 2.2 mm. At first, our choice concerned the solution which corresponds to the angle of inclination 0◦for a thickness of roughly 6 mm. This solution had the merit of finding a simple theoretical explanation (application of Rayleigh’s law) and of being easier to build.
4. Optimal Configuration Determination
The major drawback of the chosen configuration is the possibility of reflections on the plate, which can lead to a damage to the transducer. Therefore, we decided to check reflection and transmission for different plate thicknesses. Two transducers located in front of one another were used for evaluation purposes (Figure 12). The first one, used in emission/reception was supplied with a 10 Vpp sinusoidal long burst signal, whereas the second was used only in reception. A glass plate was placed between these two transducers. The emitted signal of the first transducer and the reflected signal from the glass plate were recorded on an
−20 −15 −10 −5 0 5 10 15 20 Ax is 2 -m m −20−15−10 −5 0 5 10 15 20 Axis 1-mm
Contour plot: peak-to-peak voltage 5 dB per contour (a) −20 −15 −10 −5 0 5 10 15 20 Ax is 2 -m m −20−15−10 −5 0 5 10 15 20 Axis 1-mm
Contour plot: peak-to-peak voltage 5 dB per contour (b) −20 −15 −10 −5 0 5 10 15 20 Ax is 2 -m m −20−15−10 −5 0 5 10 15 20 Axis 1-mm
Contour plot: peak-to-peak voltage 5 dB per contour
(c)
Figure 9: Maps of peak-to-peak voltages observed in the system with a plate tilted at 40◦: (a) at 8 cm, (b) at 12 cm, and (c) at 16 cm from the
plate for an excitation burst signal of four periods with 10 Vpp amplitude.
Inclined plate Transducer
160 mm
140 mm 60 mm
Figure 10: Experimental setup configuration.
oscilloscope together with the signal received by the second transducer. A transmission coefficient, T, and a reflection coefficient, R, were calculated by
R=Reflected voltage
Emitted voltage, T=
Transmitted voltage Emitted voltage .
(1) Results are shown in Figure 13. The reflection coefficient does not exceed 6% and the transmission coefficient is maximal for a 6 mm thickness. The sound velocity in the plate was measured as 5514.2 m/s, thus the optimal working frequency was determined as 475 kHz for a glass thickness of 6 mm. We notice here that the system is in very narrow busy band with a glass thicknessλ, and that variations, even small,
around its nominal frequency will be impossible. A solution will then be a glass blade of thicknessλ/2 for 500 kHz, and
excitation of the system with frequencies of 250 and 750 kHz corresponding to wavelengths ofλ and 3λ/2.
To determine optimal design (thickness of the ceramic, thickness of matching layer, etc.), the complete reactor was simulated by means of a software (Piezo-Cad) based on the KLM model [13], that is, one-dimensional model of
the transducer and surrounding media considered as an equivalent electrical circuit.
With the KLM model, we defined the following configu-ration for the system.
(1) Matching layer thickness: 0.5 mm. (2) Glass plate thickness: 11.03 mm.
(3) Space between transducer and glass plate: about 10 mm, this value does not need to be very precise. However, it must be sufficient to assure correct cooling of the transducer.
(4) Liquid height in the reactor is not an important parameter.
5. Transducer Manufacturing and Initial
Characterization
The first step consisted of adjusting the thickness of a 40 mm diameter ceramic P1 89 A4 micron and producing an electroless copper deposit on both faces. The matching layer was created by a resin polymerisation moulded by means of a 54 mm diameter ring. The moulding process was optimized to reduce the constraints imposed by polymerisation on the ceramic. The acoustic adaptation of the system “transducer, matching layer” was created with an adapter made up of a transformer, six condensers (three of 330 pf, one of 1000 pF, one of 2200 pF and one 4700 pF), a switch and two resistances.
The transducer is inserted into a Teflon circular plate embedded in the reactor. The glass reactor (Figure 14) was produced by Dijon Verre Labo (Dijon France). The 11.03 mm thickness glass plate is in Pyrex Corning.
The radiation force balance method has been chosen for initial characterization of the prototype [14] as it was easy to carry out. A target is placed in front of the transducer to obtain only the axial constituent of the weight which is
Advances in Acoustics and Vibration 7 0 5 10 15 20 25 30 35 0 10 20 30 40 50 Angle (◦)
Transmission coefficient (2.2 mm)
(a) 0 5 10 15 20 25 30 0 10 20 30 40 50 Angle (◦)
Transmission coefficient (3.3 mm)
(b) 0 10 20 30 40 50 60 0 10 20 30 40 50 Angle (◦)
Transmission coefficient (4 mm)
(c) 0 10 20 30 40 50 60 0 10 20 30 40 50 Angle (◦)
Transmission coefficient (5 mm)
(d) 0 20 40 60 80 100 0 10 20 30 40 50 Angle (◦)
Transmission coefficient (6 mm)
(e) 0 5 10 15 20 25 30 35 0 10 20 30 40 50 Angle (◦)
Transmission coefficient (10 mm)
(f)
Figure 11: Transmission coefficient versus angle inclination for different glass plate thicknesses.
recorded by means of a balance. Values with and without inner reactor were compared with an emitter running at 750 kHz. A yield equal to 40% was obtained in the inner reactor, compared to 53% in its absence. This first result is encouraging because it indicates a correct yield with this configuration.
6. Concluding Remarks
The results of ultrasound transmission through a plate, in the case of cylindrical and oblong reactors, always in simplified configuration, constitute a first step for future reactor design works. These results confirm partially the
(a)
(b)
Figure 12: Experimental set-up used for determination of reflec-tions. 0 20 40 60 80 100 0 2 4 6 8 10 Thickness (mm)
Reflection coefficient (%)
Transmission coefficient (%)
Figure 13: Transmission and reflection coefficients versus glass plate thickness.
results of the previous works and provide possible solutions through exploitable pairs (angle of inclination, thickness of glass plate). However, the need for calculation codes adapted to these complex geometries persists, because the behaviour of the tested systems is as yet far from being completely accounted for. The major problem is to take into account the fact that the longitudinal wave in the liquid becomes
Transducer 100 mm 11.03 mm 60 mm 30 mm 93 mm
Figure 14: Glass reactor.
a two-component one (shear and compression) after the liquid/solid interface. Moreover, the most valuable results are obtained over the critical angle of reflection, which complicates modelling and simulation whenever the basic relationship is clearly determined (Reissner theory [10]). The creation of a prototype using some of the results of the systematic study shows through its success that change is possible, and the first results obtained for 750 kHz confirm our belief that the double-structured tank is a good design solution.
Some work has still to be carried out to characterize this reactor completely. Other possible frequencies, 500 kHz and 750 kHz, must be tested in the same conditions. The presence of the cavitation phenomenon in the inner reactor should also be confirmed by appropriate chemical or electrochemical techniques.
Finally, practical problems persist. The tests carried out on the prototype revealed very low tolerance in variations of thickness or showed drift in exiting frequency applied to the transducer. This is annoying as it decreases the robustness of the reactor and makes it nearly as hard to produce as a classic reactor with a stuck glass plate. This problem could be solved by use of a dissimilar transducer, which has a wider busy band, and boosts the interest of the slanted bottom which has a wider tolerance.
References
[1] T. J. Mason and J. P. Lorimer, Sonochemistry: The Applications
and Uses of Ultrasound in Chemistry, John Willey & Sons, New
York, NY, USA, 1988.
[2] D. J. Walton and S. S. Phull, “Sonoelectrochemistry,” in
Advances in Sonochemistry. Vol. 4, pp. 205–284, JAI Press,
London, UK, 1996.
[3] M.-L. Doche, J.-Y. Hihn, F. Touyeras, J. P. Lorimer, T. J. Mason, and M. Plattes, “Electrochemical behaviour of zinc in 20 kHz sonicated NaOH electrolytes,” Ultrasonics Sonochemistry, vol. 8, no. 3, pp. 291–298, 2001.
Advances in Acoustics and Vibration 9
[4] V. Ligier, J. Y. Hihn, M. W´ery, and M. Tachez, “Effects of 20 kHz and 500 kHz ultrasound on the corrosion of zinc
precoated steels in [Cl−] [SO2−
4 ] [HCO−3] [H2O2] electrolytes,”
Journal of Applied Electrochemistry, vol. 31, no. 2, pp. 213–222,
2001.
[5] B. Pollet, J. P. Lorimer, S. S. Phull, and J. Y. Hihn, “Sonoelec-trochemical recovery of silver from photographic processing solutions,” Ultrasonics Sonochemistry, vol. 7, no. 2, pp. 69–76, 2000.
[6] F. Touyeras, J.-Y. Hihn, M.-L. Doche, and X. Roizard, “Elec-troless copper coating of epoxide plates in an ultrasonic field,”
Ultrasonics Sonochemistry, vol. 8, no. 3, pp. 285–290.
[7] A. Francony, Ph.D. thesis,Universit´e de Savoie, Chamb´ery, France, 1995.
[8] H. Hatano and S. Kanai, “High-frequency ultrasonic cleaning tank utilizing oblique incidence,” IEEE Transactions on
Ultra-sonics, Ferroelectrics, and Frequency Control, vol. 43, no. 4, pp.
531–535, 1996.
[9] J.-Y. Hihn, D. B´er´eziat, M.-L. Doche, et al., “Double-structured ultrasonic high frequency reactor using an opti-mised slant bottom,” Ultrasonics Sonochemistry, vol. 7, no. 4, pp. 201–205, 2000.
[10] H. Reissner, “Der senkrechte und schr¨age Durchtritt einer in einem fl¨ussigen Medium erzeugten ebenen Dilatations- Welle durch eine in diesem Medium befindliche planparallele feste Platte,” Helvetica Physica Acta, vol. 11, pp. 140–155, 1938. [11] F. H. Sanders, “Transmission of sound through thin plates,”
Canadian Journal of Research, vol. 17, no. 9, pp. 179–193, 1939.
[12] R. D. Fay and O. V. Fortier, “Transmission of sound through steel plates immersed in water,” Journal of the Acoustical Society
of America, vol. 23, no. 3, pp. 339–346, 1951.
[13] R. Krimholtz, D. A. Leedom, and G. L. Matthaei, “New equivalent circuits for elementary piezoelectric transducers,”
Electronics Letters, vol. 6, no. 12, pp. 398–399, 1970.
International Journal of
Aerospace
Engineering
Hindawi Publishing Corporationhttp://www.hindawi.com Volume 2010
Robotics
Journal ofHindawi Publishing Corporation
http://www.hindawi.com Volume 2014
Hindawi Publishing Corporation
http://www.hindawi.com Volume 2014 Active and Passive Electronic Components
Control Science and Engineering
Journal of
Hindawi Publishing Corporation
http://www.hindawi.com Volume 2014 Machinery
Hindawi Publishing Corporation
http://www.hindawi.com Volume 2014
Hindawi Publishing Corporation http://www.hindawi.com
Journal of
Engineering
Volume 2014Submit your manuscripts at
http://www.hindawi.com
VLSI Design
Hindawi Publishing Corporation
http://www.hindawi.com Volume 2014
Hindawi Publishing Corporation
http://www.hindawi.com Volume 2014
Shock and Vibration
Hindawi Publishing Corporation
http://www.hindawi.com Volume 2014
Civil Engineering
Advances inAcoustics and VibrationAdvances in
Hindawi Publishing Corporation
http://www.hindawi.com Volume 2014 Hindawi Publishing Corporation
http://www.hindawi.com Volume 2014 Electrical and Computer Engineering
Journal of
Advances in OptoElectronics
Hindawi Publishing Corporation
http://www.hindawi.com Volume 2014
The Scientific
World Journal
Hindawi Publishing Corporationhttp://www.hindawi.com Volume 2014
Sensors
Journal of Hindawi Publishing Corporationhttp://www.hindawi.com Volume 2014
Modelling & Simulation in Engineering
Hindawi Publishing Corporation
http://www.hindawi.com Volume 2014
Hindawi Publishing Corporation
http://www.hindawi.com Volume 2014 Chemical Engineering
International Journal of Antennas and Propagation International Journal of
Hindawi Publishing Corporation
http://www.hindawi.com Volume 2014
Hindawi Publishing Corporation
http://www.hindawi.com Volume 2014 Navigation and Observation International Journal of
Hindawi Publishing Corporation
http://www.hindawi.com Volume 2014