on the Electrochemical Impedance Spectra
for Positive Electrode in Li-Ion Battery
The MIT Faculty has made this article openly available.
Please share
how this access benefits you. Your story matters.
Citation
Tatara, Ryoichi, Pinar Karayaylali, Yang Yu, Yirui Zhang, Livia
Giordano, Filippo Maglia, Roland Jung, Jan Philipp Schmidt, Isaac
Lund, and Yang Shao-Horn. “The Effect of Electrode-Electrolyte
Interface on the Electrochemical Impedance Spectra for Positive
Electrode in Li-Ion Battery.” Journal of The Electrochemical Society
166, no. 3 (November 27, 2018): A5090–A5098.
As Published
http://dx.doi.org/10.1149/2.0121903jes
Publisher
Electrochemical Society
Version
Final published version
Citable link
http://hdl.handle.net/1721.1/121032
Terms of Use
Creative Commons Attribution-NonCommercial-NoDerivs License
JES F
OCUSI
SSUE OFS
ELECTEDP
APERS FROMIMLB 2018
The Effect of Electrode-Electrolyte Interface on the
Electrochemical Impedance Spectra for Positive Electrode
in Li-Ion Battery
Ryoichi Tatara, 1,∗,zPinar Karayaylali,2Yang Yu,3Yirui Zhang,2Livia Giordano,1,2,4
Filippo Maglia,5Roland Jung,5Jan Philipp Schmidt,5Isaac Lund,6
and Yang Shao-Horn 1,2,3,∗∗,z
1Research Laboratory of Electronics, Massachusetts Institute of Technology, Cambridge, Massachusetts 02139, USA 2Department of Mechanical Engineering, Massachusetts Institute of Technology, Cambridge, Massachusetts 02139,
USA
3Department of Material Science and Engineering, Massachusetts Institute of Technology, Cambridge, Massachusetts
02139, USA
4Department of Material Science, Universit`a di Milano-Bicocca, 20136 Milan, Italy 5BMW Group, 80788 M¨unchen, Germany
6BMW Group Technology Office USA, Mountain View, California 94043, USA
Understanding the effect of electrode-electrolyte interface (EEI) on the kinetics of electrode reaction is critical to design high-energy Li-ion batteries. While electrochemical impedance spectroscopy (EIS) is used widely to examine the kinetics of electrode reaction in Li-ion batteries, ambiguities exist in the physical origin of EIS responses for composite electrodes. In this study, we performed EIS measurement by using a three-electrode cell with a mesh-reference electrode, to avoid the effect of counter electrode impedance and artefactual responses due to asymmetric cell configuration, and composite or oxide-only working electrodes. Here we discuss the detailed assignment of impedance spectra for LiCoO2as a function of voltage. The high-frequency semicircle was assigned to the
impedance associated with ion adsorption and desorption at the electrified interface while the low-frequency semicircle was related to the charge transfer impedance associated with desolvation/solvation of lithium ions, and lithium ion intercalation/de-intercalation into/from LixCoO2. Exposure to higher charging voltages and greater hold time at high voltages led to no significant change for
the high-frequency component but greater resistance and greater activation energy for the low-frequency circle. The greater charge transfer impedance was attributed to the growth of EEI layers on the charged LixCoO2surface associated with electrolyte oxidation
promoted by ethylene carbonate dehydrogenation.
© The Author(s) 2018. Published by ECS. This is an open access article distributed under the terms of the Creative Commons Attribution Non-Commercial No Derivatives 4.0 License (CC BY-NC-ND, http://creativecommons.org/licenses/by-nc-nd/4.0/), which permits non-commercial reuse, distribution, and reproduction in any medium, provided the original work is not changed in any way and is properly cited. For permission for commercial reuse, please email:oa@electrochem.org. [DOI:10.1149/2.0121903jes]
Manuscript submitted October 1, 2018; revised manuscript received November 7, 2018. Published November 27, 2018.This paper is part of the JES Focus Issue of Selected Papers from IMLB 2018.
Improving kinetics of electrochemical reaction is the key to de-sign high-performance battery systems for electrical vehicles and other applications. Electrochemical reactions proceed at the interface of electrode and electrolyte, yet there is still limited understanding on how different components of electrode-electrolyte interface (EEI) affects the kinetics of the charge transfer reactions.1 For instance,
carbonate-based electrolytes, which are most commonly used for Li-ion batteries, are well known to be reduced at the negative electrode surface to form the solid-electrolyte-interphase (SEI).2On the other
hand, these carbonate-based electrolytes can also be oxidized at the oxide surface in the positive electrode to form EEI layer even at ∼4.1 VLi, within operating potentials of Li-ion batteries.3,4 In
ad-dition, introducing late transition metals such as Ni in the layered oxides materials (e.g. LiNixMnyCo1-x-yO2) enhances electrolyte
ox-idation as reported recently.5–7Such electrolyte oxidation generates
reaction products formed on the electrode surface, which can increase cell resistance and decrease cycle life.1However, the formation
mech-anism and chemical composition of EEI layer that governs the lithium ion transport and/or kinetics of lithium intercalation/de-intercalation at the electrode surface are not well-understood.
Recent density functional theory (DFT) work shows that the ther-modynamic driving force for the dissociative adsorption of ethylene carbonate (EC) on the oxide surface such as LixMO2increases with
lowering the Fermi level into the O 2p band,4induced by lithium
de-intercalation and the use of late transition metal in LixMO2. The disso-∗Electrochemical Society Member.
∗∗Electrochemical Society Fellow.
zE-mail:shaohorn@mit.edu;tatara@mit.edu
ciative adsorption of EC (dehydrogenation of EC) produces acidic OH group on the oxide surface, which can further react with electrolyte salt such as LiPF6. Recent XPS studies3on carbon-free, binder-free
LixCoO2show a marked growth of oxygenated and carbonated species
along with the increase of LiF and LixPFyOzspecies upon charging
of LiCoO2. In addition, the correlation between the interface
compo-sition and the thermodynamic driving force of dissociative adsorption of EC on LiCoO2 surface has been also discussed via DFT
calcula-tion: preferential reaction of surface OH group, being energetically more favorable with increasing state-of-charge, with LiPF6 to form
LiF and LixPFyOz species probed through XPS, as well as HF and
PF2O2− solution species probed by NMR. However, the impact of
EEI grown on the LixCoO2surface on the kinetics of intercalation and
de-intercalation and electrode impedance is not well understood. While electrochemical impedance spectroscopy (EIS) has been used to study the kinetics of positive electrode in Li-ion batteries since 1985,8ambiguities still exist in the physical origin and the
as-signments of EIS features, especially for composite electrodes. Gen-erally speaking, two of the semicircles appeared in the Nyquist plots for lithium intercalation/deintercalation reaction into composite elec-trodes such as LiCoO2 in 1 mol/L LiBF4 in propylene carbonate,8
LiMn2O4/LiNiO2/LiCoO2 in 1 mol/L LiAsF6 in ethylene
carbon-ate (EC) -dimethyl carboncarbon-ate (DMC) (1:3),9 LiNi
1/3Mn1/3Co1/3O2
in 1 mol/L LiPF6 in ethylene carbonate: diethyl carbonate (DEC)
(1:1 vol),10 graphite in 1 mol/L LiAsF
6 in EC-DMC (1:3),11 and
graphite in ionic liquids,12 etc.13–21 Previous studies have proposed
that the high-frequency components correspond to surface or EEI layer resistance.8,9,11,15,18 For example, Goodenough et al.,8 and
positive electrodes was assigned for surface film formation accord-ing to modelaccord-ing results and insensitivity against electrode potential. In contrast, Choi et al.,13 have reported that high-frequency
semi-circle can be assigned to particle/particle contact resistance in the composite electrodes of LiNiO2/LiCoO2 in 1 mol/L LiClO4 in PC
while Lindbergh et al.,14 have reported that it corresponds to the
contact resistance between electrode and current collector (reported with LiMn2O4 in LiClO4/LiBF4 in carbonate solutions). The
dis-crepancies may arise from overlapped responses from negative and positive electrodes in two-electrode cells22–24used for EIS
measure-ments or artefactual EIS response from three-electrode cells with asymmetric cell configurations due to equipotential line distortion during frequency sweep.25–27 In addition, the low-frequency
com-ponent has been attributed to charge transfer resistance associated with lithium intercalation/de-intercalation,8,11,18 which has
voltage-dependent impedance.9,15On the other hand, Uchimoto et al.,28and
Dokko et al.,29have reported only one voltage-dependent semicircle
appeared on thin film and single particle LixCoO2 electrodes
(with-out binder and carbon), which could originate from charge transfer impedance at the LixCoO2/electrolyte. As EEI films can form on thin
film or single particle LixCoO2electrodes with increasing voltage,3
the formation of EEI films on LixCoO2might not generate a separate
EIS semicircle from the semicircle from charge transfer impedance in contrast to previous studies,8,9,11,15,18which requires further
clarifica-tion.
In this study, we fabricated three-electrode cells customized for EIS measurements with a symmetric configuration to avoid arte-facts in the EIS response. High-frequency and low-frequency EIS features of LiCoO2composite electrodes were examined as a function
of charging voltage and aging time. The high-frequency semicircle is assigned to the impedance at the electrified interface, involving ion adsorption/desorption on the particle surface coupled with elec-tron transfer to the surface of LixCoO2 in the composite electrode,
which is supported by decreasing resistance with increasing compress pressure and electrolyte ionic conductivity. On the other hand, the low-frequency semicircle corresponds to the kinetics of charge trans-fer associated with de-solvating/solvating lithium ions and lithium intercalation/de-intercalation into/from LixCoO2. Increasing charging
voltages above 4.4 VLiand aging time at 4.4 VLiand higher leads to
greater resistance for high-frequency and low-frequency components as well as its activation energy, which can be attributed to EEI layer growth.
Experimental
Electrode preparation.—The positive electrode was composed of LiCoO2(85 wt%, synthesized according to the previously published
procedure)3 as an active material, carbon black (5 wt% KS6 and
2 wt% Super P, both from Timcal) as an electrically conductive addi-tive, and poly(vinylidene fluoride) (8 wt%, PVDF, Kynar) as a binder polymer. The mesh reference electrode was also composed of 80 wt% of Li4Ti5O12 (Itasco, >99.5%), 10 wt% of acetylene black (C-55,
Chevron) and 10 wt% of PVDF. These materials were mixed together and thoroughly agitated in N-methylpyrrolidone (NMP, Aldrich). The obtained slurry was applied with a blade applicator onto aluminum foil (for LiCoO2, 16μm thickness) or 316 stainless-steel mesh (for
Li4Ti5O12, 325 × 325 mesh, opening size 0.0017”), and resulting
sheet/mesh were dried at 70◦C. Next, each electrode was punched with a 1/2 inch diameter (1.27 cmφ) for LiCoO2and 18 mm diameter
for Li4Ti5O12mesh reference. Carbon-free, binder-free LiCoO2
elec-trodes were prepared by mixing LiCoO2with NMP in a 1:100 mass
ratio. After ultrasonication for 5 minutes, the ink was deposited on 1/2 inchφ (1.27 cmφ) aluminum discs and dried at 100◦C. The LiCoO2
composite and carbon-free, binder-free electrodes were compressed at 6.3 T/cm2(unless otherwise noted) using a hydraulic press to improve
electrical conductivity. All of the electrodes were further dried in vac-uum at 80◦C prior to cell assembling. The active material loading was∼2.4 mg/cm2(∼8 μm thickness) for LiCoO
2and∼1.0 mg/cm2
for Li4Ti5O12respectively unless otherwise noted. After compression
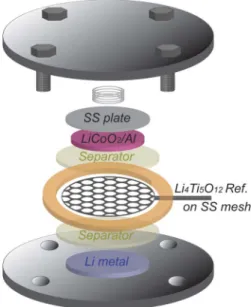
Figure 1. Schematic of three electrode EIS cell, where a mesh Li4Ti5O12
reference electrode is placed between positive and negative electrode with two separators.
at 6.3 T/cm2, packing density of LiCoO
2composite electrode is ca.
3.0 gLCO-C-PVDF/cm3and porosity is∼28% (without compression: ca.
2.0 gLCO-C-PVDF/cm3and∼52%). Particle size of synthesized LiCoO2
was examined with a scanning electron microscope (JEOL 5910, with secondary electron detector at accelerating voltage of 15 kV) and shown in Figure S1 (d∼ 1 μm).
Electrochemical impedance spectroscopy (EIS).—Three-electrode cell was assembled in an argon-filled glove box ([H2O],
[O2]< 0.5 ppm, MBraun) with a Li metal foil (15 mmφ), 2 pieces
of Celgard 2325 (19 mmφ, MTI) as the separators, Li4Ti5O12
mesh reference electrode (18 mmφ), 2 pieces of Celgard 2325 (19 mmφ) again, and LiCoO2 electrode (1/2 inchφ) from bottom
to top, where a mesh Li4Ti5O12 reference electrode was placed
between positive and negative electrode with two separators (Figure1). Mesh reference electrode was used to avoid inhomoge-neous electric field during EIS measurement, which is known to cause artifactual EIS response (e.g. “spiral” behavior on Nyquist plots with Li rod reference electrode).25,26,30,31 Mesh reference electrode also
enables us to avoid blocking ion-flow/migration between positive and negative electrodes. In addition, loading density of Li4Ti5O12
on mesh reference electrode is kept relatively low (∼1.0 mg/cm2)
to avoid impedance contribution from reference electrode.25,26 It
is known that the mesh reference impedance may be observed as additional processes in the measurement due to partially blocking ion-flow/migration in the electrolyte if loading density is too high impeding rigorous analysis.25200μL of 1 mol/L LiPF
6in a 3:7 wt:wt
ethylene carbonate (EC): ethyl methyl carbonate (EMC) electrolyte (LP57, BASF) was used as electrolyte. For preparing 0.1 mol/L and 0.01 mol/L LiPF6in EC-EMC (3:7 wt/wt) solutions, LP57 was
simply diluted by pure EC (BASF) and EMC (BASF). Galvanostatic and potentiostatic charge and EIS tests were performed using VMP3 (potentiostat with frequency response analyzer, Biologic) with thermally equilibrated by thermostat chamber (SU-241, Espec) at 25◦C. After cell assembly, Li4Ti5O12 mesh reference electrode
was electrochemically lithiated (negatively polarized at constant current of 500 μA against Li metal counter electrode with cutoff voltage of 1.3 VLi) and got stable reference electrode potential
at 1.56 VLi.26 Then LiCoO2 working electrode was charged with
different end-of-charge potential (3.9–4.6 VLi) at 27.2 mA/g (0.1C
rate based on theoretical capacity of 272 mAh/g, which corresponds to full lithium deintercalation: LiCoO2 → Li+ + e− + CoO2.
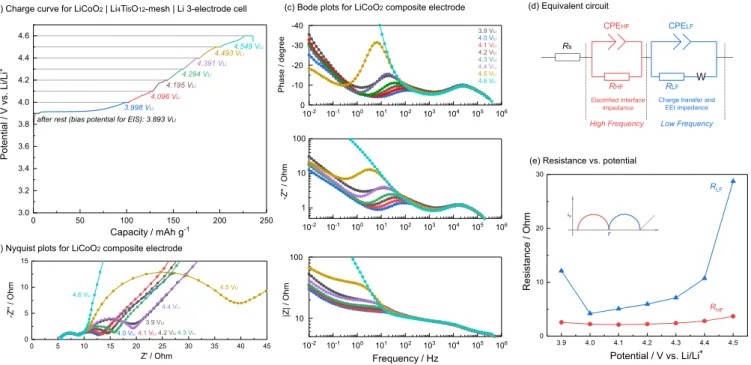
Figure 2. EIS measurement on LiCoO2 composite electrode in LiCoO2|Li4Ti5O12-mesh|Li three electrode cell with 1 mol/L LiPF6/EC-EMC (3:7 wt/wt)
as electrolyte at different potential at 25◦C; (a) charge curve, (b) Nyquist plots, (c) Bode plots, (d) equivalent circuit used to model obtained impedance spectra and (e) resistance vs. potential plots (detail fitting results are available in Figure S2). Cell was galvanostatically charged at 27.2 mA/g (0.1C) and hold potential for 1 hour at each potential, then relax 1 hour before EIS sequence. The LiCoO2 loading is 2.4 mg/cm2 and LiCoO2 electrode was compressed
at 6.3 T/cm2.
27.2 mA/g corresponds to∼65 μA/cm2for average loading density
of∼2.4 mg/cm2), hold end-of-charge potential for 1 hour, and relax
for 1 hour. After relax, EIS measurements were carried out at open circuit potential with 10 mV amplitude and frequency range from ∼10−2 to 106 Hz. For temperature dependence experiment, first
the cell was charged with each end-of-charge potential at 25◦C, then the cell was kept at each temperature (10–50◦C) for 1 hour before EIS measurement. Obtained EIS data (excluded very high frequency region> 100 kHz if needed) were analyzed using ZView2 (Scribner). Ionic conductivity of electrolyte solution was measured using Traceable 23226-505 conductivity meter with thermostat chamber (SU-241, Espec).
X-ray photoelectron spectroscopy (XPS).—Cells after charging tests were disassembled in the glove box and the electrodes were gen-tly rinsed with 100μL of EMC and dried at room temperature under vacuum in the glove box antechamber for 3 h. Pristine and charged samples were transferred from the glove box to the XPS chamber of the spectrometer using a sample transfer vessel (ULVAC-PHI, INC.) avoiding exposure of the sample to air. All the XPS spectra were col-lected using a PHI 5000 Versa Probe II (ULVAC-PHI, INC.) using a monochromatized Al Kα source and a charge neutralizer. All spectra were recorded with a pass energy of 23.5 eV and calibrated with the C1s photoemission peak of adventitious carbon at 285 eV. After sub-traction of a Shirley-type background, photoemission lines were fitted using combined Gaussian-Lorentzian functions. To facilitate compar-ison between samples, all the spectra were normalized by fixing the C1s photoemission peak of adventitious carbon (285 eV) to the same value. It is worth noted that, XPS collected from composite electrode generally have limited information due to the presence of conductive carbon and PVDF.1,3,32Conductive carbon, which has higher surface
area than active material, might interact/react with electrolyte during charging reaction.32Furthermore, both conducting carbon and PVDF
have strong band appeared in core spectra such as C1s, O1s and F1s, causing severe overlap with those from EEI layer. To avoid those ambiguities, XPS for carbon-free, binder-free electrodes or thin film
electrodes would be the strong solutions,3 however, to simply study
the effect of EEI layer growth to EIS response here, we conducted XPS analysis for LiCoO2composite electrodes.
Results and Discussion
Assignment of EIS features of LixCoO2composite electrodes.— Figure2ashows charge curves obtained for the LiCoO2 composite
electrode in 1 mol/L LiPF6in a 3:7 (wt:wt) EC: EMC solution with
mesh Li4Ti5O12reference electrode and Li metal counter electrode.
The main lithium deintercalation plateau (LiCoO2→ xLi++ xe−+
Li1-xCoO2) appeared from 3.9 VLi, and potential gradually increases
up to 4.6 VLi, with showing charge capacity of 236 mAh/g. Both of
plateau potential and charge capacity are consistent with previously reported results.3,33,34The depression of plateau around 4.15 V
Lican
result from a phase transition between ordered and disordered Li+ion arrangements in the LixCoO2framework.29After potential holding at
3.9–4.5 VLifor 1 hour and open circuit relaxation for one hour,
ob-served voltage drop upon relaxation was within 10 mV, indicating that charged electrodes after potential holding is close to equilibrium. At 4.6 VLi, voltage drop was larger than other voltages, implying larger
voltage relaxation due to higher overpotential (slower kinetics) or the onset of self-discharge associated with electrolyte decomposition.35
Figures2band2cshows Nyquist and Bode plots for different poten-tials, where high-frequency (left on Nyquist plots) semicircle, frequency (right) semicircle and Warburg impedance at very low-frequency were observed consistent with previous work.8,9,21The size
of low-frequency semicircle decreases with potential increasing from 3.9 to 4.0 VLi, and increases again from 4.0 VLito 4.5 VLi, while the
size of high-frequency semicircle keeps almost constant among entire potential range.
Measured EIS spectra were analyzed quantitatively using an equiv-alent circuit shown in Figure2d, which was made as physically sim-ple as possible by considering numerous equivalent circuits reported previously.8–11,30,36–38In the equivalent circuit, R
sis the resistance of
Figure 3. Schematic illustration for proposed assignment of EIS spectra.
High-frequency (left) semicircle can be assigned to electrified interface impedance in the composite structure, which is combination of electron con-duction in the composite electrode and Li+ion adsorption/desorption on the surface of composite electrode pore structure. Low-frequency (right) semi-circle corresponds to combination of charge transfer resistance of LixCoO2
and surface EEI layer resistance. As EEI layer grows, low-frequency (right) semicircle gets larger due to increase of EEI resistance, as well as increase of its activation energy.
constant phase element at high- and low-frequency range, and W is finite space (open) Warburg impedance, which reflects diffusion of Li+in the solid.10The fitted parameters of interest are summarized in
Figure2eand detailed fitting results are available in Figure S2. High-frequency (left) semicircle (RHF) was found not to change so much
through entire potential range, consistent with previous reports.9 On
the other hand, RLF was found to first decrease from 3.9 to 4.0 VLi,
showing minimum at 4.0 VLi, and then increases with increasing
volt-age up to 4.5 VLi. The changes in the low-frequency semicircle
re-sistance can be assigned to charge transfer kinetics.9,39–42Decreasing
trend from 3.9 to 4.0 VLican be correlated with electrical conductivity
enhancing through lithium deintercalation of LiCoO2,29,41 while
in-creasing trend through further potential increase from 4.0 to 4.5 VLi,
especially sudden increase at 4.5 VLi, might be simply come from
end-of-charge, or surface film formation (at EEI layer) at high voltage (further discuss later). This assignment is further supported by pre-vious work of thin-film electrode or single particle electrode, which exhibits one potential-dependent semicircle with comparable frequen-cies with those of low-frequency semicircles (100∼102Hz as shown in
peak top frequency of imaginary impedance -Z’’ in Figure2c),28,29,43,44
The size of semicircle observed in thin film and single particle elec-trode increases with potential holding or cycling even measured at the same potential as LixCoO2electrodes of this study.29,43Therefore, it is
reasonable to assign low-frequency semicircle observed in LixCoO2
composite electrodes, to combination of charge transfer and EEI layer resistance. As for high-frequency semicircle in composite electrode, here we assign it to the impedance of electrified interface between the composite electrode structure and the electrolyte, involving lithium ion adsorption/desorption on the surface of composite electrode cou-pled with electron transfer and migration in the composite electrode, as shown in Figure3.
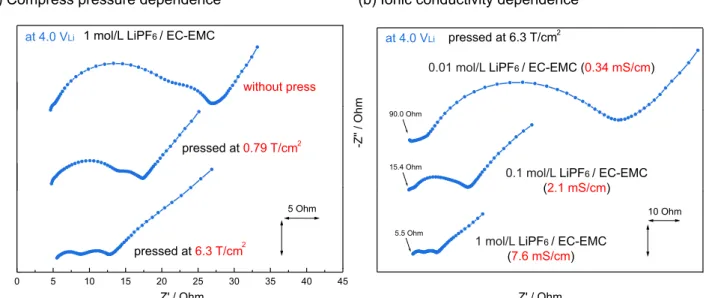
Further support to the EIS assignments came from EIS measure-ments with different compression pressures and electrolyte ionic con-ductivity. Figure 4ashows Nyquist plot obtained at 4.0 VLi with
the electrodes (with a fixed loading ∼2.4 mg/cm2) compressed at
6.3 T/cm2, 0.79 T/cm2 and without pressing. The size of
high-frequency (left) semicircle was shown to decrease with increasing compression pressure, which is in good agreement with reduced com-posite electrode electronic resistance as expected at high compressing pressures. It is also reported that reducing active material particle size increases RHF,10which increases the number of particle/particle,
par-ticle/current collector and particle/electrolyte boundary. On the other hand, Figure3b shows Nyquist plots with different LiPF6
concen-trations in the electrolyte solution, where the ionic conductivity of 1 mol/L, 0.1 mol/L and 0.01 mol/L solution corresponds to 7.6 mS/cm, 2.1 mS/cm and 0.34 mS/cm at 25◦C, respectively. With decreasing
10 Ohm -Z '' / O h m Z' / Ohm 0 5 10 15 20 25 30 35 40 45 -Z '' / O h m 5 Ohm Z' / Ohm 5.5 Ohm 90.0 Ohm
(b) Ionic conductivity dependence (a) Compress pressure dependence
pressed at0.79 T/cm
1 mol/L LiPF6 / EC-EMC
(7.6 mS/cm)
at 4.0 VLi at 4.0 VLi
0.01 mol/L LiPF6 / EC-EMC (0.34 mS/cm)
pressed at6.3 T/cm without press pressed at 6.3 T/cm 2 2 2
1 mol/L LiPF6 / EC-EMC
15.4 Ohm
0.1 mol/L LiPF6 / EC-EMC
(2.1 mS/cm)
Figure 4. Nyquist plots for a LiCoO2composite electrode at 4.0 VLiin LiCoO2|Li4Ti5O12-mesh|Li three electrode cell at 25◦C; (a) electrode compress pressure
dependence and (b) electrolytes ionic conductivity dependence. Cell was galvanostatically charged at 27.2 mA/g (0.1C) and hold potential for 1 hour at each potential, then relax 1 hour before EIS sequence. Ionic conductivity of electrolytes was measured at 25◦C.
0 5 10 15 20 25 30 0 5 10 -Z '' / O h m Z' / Ohm 0 10 15 20 25 30 0 5 10 -Z '' / O h m Z' / Ohm 0 5 10 15 20 25 30 35 40 45 0 5 10 15 -Z '' / O hm Z' / Ohm at 4.0 VLi at 4.2 VLi at 4.4 VLi 1 hour x 5 times 1 hour x 5 times 1 hour x 5 times
Figure 5. Time dependence of Nyquist plots for a LiCoO2composite
elec-trode with potential holding at 4.0, 4.2 and 4.4 VLiin LiCoO2|Li4Ti5O12
-mesh|Li three electrode cell at 25◦C. EIS measurement was conducted every one hour for five times (black to red line).
ionic conductivity, both RHFand RLFwas increased and almost
over-lapped at 0.01 mol/L solution. Increase of RHF at lower ionic
con-ductivity can be explained by higher resistance to migrate Li+ in electrode pore structures. Small bumps in most high-frequency (left) region would come from reference electrode impedance contribution (see experimental section). On the other hand, RLF, which was
as-signed to charge transfer resistance, should also be increased with decreasing reaction species (Li+), because charge transfer kinetics can be generally described as 1/Rct ∝ cLi1/2 from Butler-Volmer’s
equation with assuming transference coefficient to be 0.5.45,46
Although there are some reports which assign high frequency semi-circle to electronic contact resistance of composite electrode (active material particle/particle or particle/current collector, particle/current collector effect is reported to be dominant),10,13,14,19,47however, ionic
conductivity trends shown in Figure4bcannot be explained only by electronic contact resistance contribution (contact resistance should not change largely with different electrolytes). Since electrified inter-face impedance is the combination of electron migration in the com-posite electrode, Li+migration in composite pore structure and Li+ion desorption and adsorption on the composite electrode surface, which is in agreement with having RHFof composite electrodes decreasing
with increasing both electronic conductance and ionic conductance, and having only one semicircle appeared on EIS at thin film28/ single
particle.29 Activation energy of each step (high/low frequency) will
be discussed in latter part.
EIS measurements with potential holding were conducted at dif-ferent voltages. Figure5shows the time dependence of Nyquist plots for a LiCoO2 composite electrode with potential holding at 4.0, 4.2
and 4.4 VLi. The size of low-frequency (right) semicircle keeps almost
constant for 5 hours at 4.0 VLiwhile it was increased slightly at 4.2 VLi,
and significantly at 4.4 VLi. This trend for low-frequency semicircle of
0 10 20 30 40 50 60 70 80 90 0 10 20 30 -Z '' / O hm Z' / Ohm 3.9 VLi 4.0 VLi 4.1 VLi4.2 VLi4.3 VLi
4.4 VLi
4.5 VLi Carbon-free, binder-free
LiCoO2 powder electrode
10-2 10-1 100 101 102 103 104 105 106 1 10 100 -Z '' / O h m Frequency / Hz
(a) Nyquist plots for carbon-free, binder-free LiCoO2 powder electrode
(b) Imaginary impedance for carbon-free, binder-free LiCoO2 powder electrode 3.9 VLi 4.0 VLi 4.1 VLi 4.2 VLi 4.3 VLi 4.4 VLi 4.5 VLi
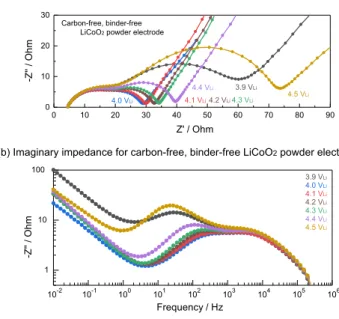
Figure 6. (a) Nyquist plots and (b) frequency dependence of
imagi-nary impedance for carbon-free, binder-free LiCoO2 powder electrode in
LiCoO2|Li4Ti5O12-mesh|Li three electrode cell with 1 mol /L LiPF6 /
EC-EMC (3:7 wt/wt) as electrolyte at different potential at 25◦C. Cell was gal-vanostatically charged at 27.2 mA/g (0.1C) and hold potential for 1 hour at each potential, then relax 1 hour before EIS sequence. The LiCoO2loading is
2.2 mg/cm2and LiCoO
2electrode was compressed at 6.3 T/cm2.
LixCoO2 composite electrodes is consistent with comparable results
reported for the one semicircle of thin-film28,44 and single-particle
electrodes29 with potential holding or cycling at similar potentials.
We propose that potential holding would increase EEI layer thick-ness by decomposing more electrolyte (especially above 4.4 VLion
the layered oxide materials such as LiNi0.33Mn0.33Co0.33O2)7with time
during holding and increase the RLF. Increase of RLFat higher potential
implies restricted electrode kinetics due to further electrolyte decom-position occurred on the LiCoO2surface and forming EEI layer.3The
increased reactivity of LiCoO2surface with higher degree of
delithi-ation induces accumuldelithi-ation of decomposition products on the EEI layer and it would suppress charge transfer kinetics (further discus-sion in later section).4Therefore, this increasing trend upon exposure
for high potential further supports that low-frequency semicircle in composite electrode can be affected by both charge transfer and EEI layer resistance. In contrast, high-frequency (left) semicircle does not change during potential holding even at 4.4 VLi, suggesting RHF
can-not be assigned to EEI layer (so-called surface film) resistance, but to the electrified interface resistance, because it should be reasonably assumed that electrified interface impedance does not change with holding potential.
EIS measurements on carbon-free, binder-free LiCoO2 electrode
were also carried out to see the effect of conductive carbon on the behavior (Figure6). As well as EIS response on composite electrodes (Figure 2), two semicircles can be observed on Nyquist plots for carbon-free, binder-free electrode and each response shows almost the same imaginary impedance peak top frequency (high frequency ∼ 104Hz, low frequency∼ 101–102Hz) as composite electrode
re-sults. High-frequency semicircles do not change with varying potential while low-frequency semicircles show the same trend as the one with composite electrodes (showing minimum resistance at 4.0 VLi).
Con-sistent with the results from potential holding experiment as discussed above (Figure5), this observation indicates high-frequency semicir-cle does not necessarily originate from high-surface area conductive carbon or binder polymer in composite electrode structure. However, both electronic (electron migration via particle) and ionic (Li+ migra-tion in pore) resistance in composite electrode structure (electrified
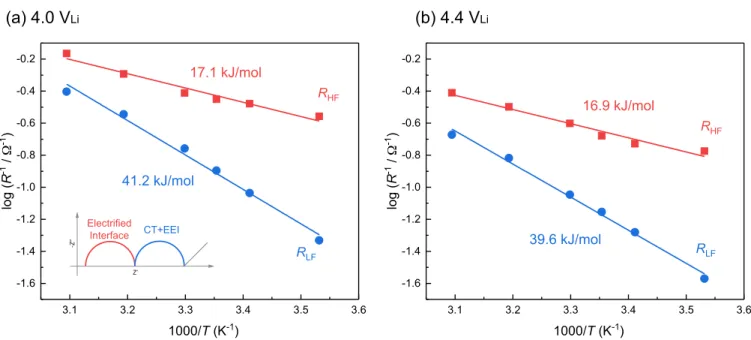
Figure 7. Arrhenius plots of interfacial resistances for a LiCoO2composite electrode (compressed at 6.3 T/cm2) at (a) 4.0 and (b) 4.4 VLiin LiCoO2|Li4Ti5O12
-mesh|Li three electrode cell. Original temperature dependent Nyquist plots are shown in Figure S3. Cell was galvanostatically charged at 27.2 mA/g (0.1C) and hold potential for 1 hour at 25◦C, then EIS was carried out at open circuit potential at each temperature. Activation energy of electrolyte ionic conduction (ion migration in bulk) are measured as 12.2 kJ/mol (Figure S4). Arrhenius plots with less compressed electrode (0.79 T/cm2) are available in Figure S5.
interface impedance) affect RHF, because thin film and single
parti-cle electrodes, which also do not have conductive carbon and binder polymer, show only one semicircle.28,29,43,44
Due to much higher surface roughness of carbon-free, binder-free electrodes (the electrode was prepared by just drop casting of LiCoO2/NMP dispersion, see experimental section), the observed two
semicircles cannot be separated so well especially around 4.0–4.3 VLi.
In addition, larger impedance compared with the one from compos-ite electrodes might come from lower electric conductivity in the carbon-free, binder-free electrode structure due to lack of conductive carbon, however, it would be challenging to quantitatively compare resistance since the preparation method as well as the surface morphol-ogy/smoothness are far different between composite and carbon-free, binder-free electrodes. Therefore, here we simply used composite electrode for following discussion.
The effect of EEI formation to charge transfer kinetics.—To further connect the effect of EEI layer formation to energetics and ki-netics for electrode reaction, activation energy was calculated. Figure 7shows Arrhenius plots of both RLFand RHFat 4.0 and 4.4 VLi
(Orig-inal temperature dependent Nyquist plots are available in Figure S3). The activation energies (Ea) were evaluated from the slopes of the
Ar-rhenius plots with the ArAr-rhenius equation, RHF/LF−1= Aexp(-Ea/RT),
where A denotes frequency factor, R denotes ideal gas constant and
T denotes absolute temperature. As shown in Figure7a, activation energy for RLFat 4.0 VLiwas calculated to be 41.2 kJ/mol. This value
is comparable with the activation energy of 30–60 kJ/mol for charge transfer reactions, where the desolvation/solvation of Li+ion is the rate-determining step.48 Although the desolvation/solvation energy
(i.e. interaction energy) of lithium ions can vary depending on solvent and anion,49–51the value in this work is in good agreement with
pre-vious work39(e.g. 48±6 kJ/mol at LiCoO
2in 1 mol/L LiCF3SO3in
propylene carbonate), where higher value can be attributed to higher Lewis basicity of LiCF3SO3than LiPF6.51Activation energy of RLF
at 4.4 VLiwas also calculated as 39.6 kJ/mol, which can be regarded
as the same as the one at 4.0 VLi(41.2 kJ/mol) within typical
exper-imental error for activation energy measurement (± 2–6 kJ/mol).39,52
Generally speaking, the activation energy of Li+ ion conduction in inorganic solid state electrolytes is around 40–50 kJ/mol,53,54which
also shows a good agreement with the value for RLFbut not for RHF
in this study.
The activation energy of RHF, which was assigned to the impedance
for the electrified interface, was calculated to be 17.1 kJ/mol and 16.9 kJ/mol, at 4.0 and 4.4 VLi, respectively. These values are consistent
with those reported for RHFby Xu et al.,55which are close to the
acti-vation energy for ionic conduction in bulk electrolyte solutions such as LP57 (1 mol/L LiPF6 in EC-EMC) in Figure S4 (12.2 kJ/mol).
This value is in good agreement with that from Ogihara et al., having the activation energy of ion migration in composite pore structure being 16 kJ/mol.56On the other hand, the activation energy of
elec-tronic conduction within the composite structure is much lower (nearly temperature independent) than that for ion conduction,56,57the
high-frequency impedance was attributed to Li+ion adsorption onto and desorption from pore surfaces and Li+ion migration in the compos-ite electrodes. This hypothesis is further supported by temperature-dependent measurements with less compressed electrode (0.79 T/cm2,
shown in Figure S5), which had a lower activation energy of RHF
being 9.8 kJ/mol than that for well-compressed (6.3 T/cm2)
elec-trodes, reflecting a higher contribution of electronic migration. There-fore, well-compressed electrodes had electrified interface impedance that was mainly governed by Li+ ion adsorption onto and desorp-tion from pore surfaces and Li+ ion migration in the composite electrodes.
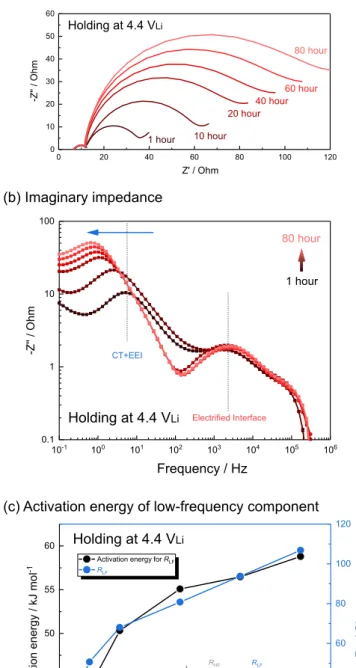
Activation energy of RHF and RLF was examined with different
potential holding time at 4.4 VLi(Figure8a), where RLFwas shown to
increase considerably with holding time while RHFremained largely
constant for 80 hours. In addition, imaginary impedance plotted against frequency are shown in Figure8b, where peak frequency in the imaginary impedance describes the time scale of specific processes. Peak top frequency for higher frequency region is almost constant at
fmax= ∼2000 Hz (time constant: τ = 1/(2π fmax)= ∼8.0 × 10⁻⁵s)
for 80 hours, suggesting time scale of electrified interface impedance keeps constant with holding potential over time. However, peak fre-quency for low-frefre-quency semicircle was shifted to lower frefre-quency from fmax = ∼5 Hz (τ = ∼3.2 × 10⁻² s) at after 1 hour holding,
and to fmax = ∼0.6 Hz (τ = ∼2.7 × 10⁻¹s) at after 80 hours. This
one order of magnitude increase of time constant clearly suggests that the process became slower with holding, which can be attributed to
Figure 8. Time dependence of EIS measurement on LiCoO2composite
elec-trode with holding potential at 4.4 VLiin LiCoO2|Li4Ti5O12-mesh|Li three
electrode cell at 25◦C; (a) Nyquist plots, (b) frequency dependence of imagi-nary impedance and (c) activation energy of low-frequency component.
increased resistance associated with growing EEI layer. Moreover, calculated activation energy of RLFwith holding time at 4.4 VLi
in-creased with holding time for 80 hours by a factor of 1.5, from 40 kJ/mol to 60 kJ/mol, not reaching steady-state, as shown in Figure8c (some Nyquist plots which do not show Warburg tail due to very high
RLFwere simply fitted by only RQ-element). This observation implies that EEI layer formed at 4.4 VLimight not be fully passivated after 80
hours, however growing rate is slowed down after 20 hours.
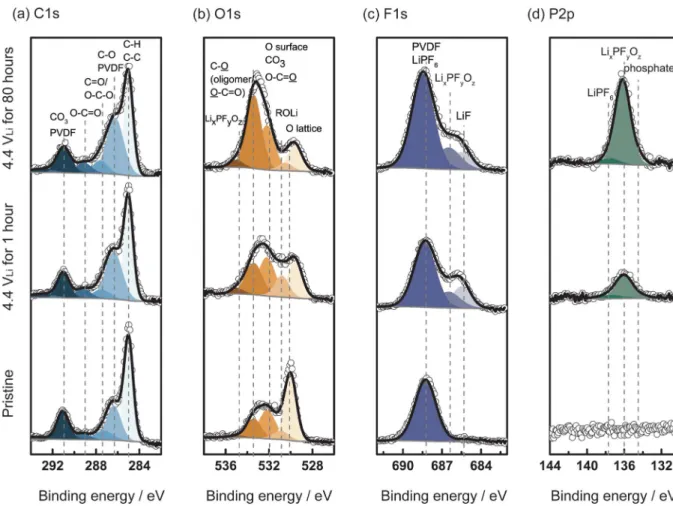
In order to verify the EEI layer growth on the electrode surface during potential holding at 4.4 VLi, XPS analysis of C1s, O1s, F1s
and P2p was conducted for LixCoO2 composite electrodes before
and after holding potential at 4.4 VLifor 1 hour and 80 hours
(Fig-ure9). Figure9ashows the C1s spectra, which were fitted to com-ponent adventitious C-H/C-C (Eb = 285 eV), C-O (and/or PVDF)
(Eb∼286.3 eV), C=O/O-C-O (Eb∼287.6 eV), O=C-O (Eb∼288.8
eV) and CO3 (and/or PVDF) (Eb∼290.3 eV). As shown in Figure
9b, the low binding energy component of O1s, which corresponding to the oxygen lattice (∼529 eV) of LiCoO2,58became smaller with
holding potential (bottom to top), indicative of surface film growth on the LiCoO2surface with hold time3. As the penetration depth of
laboratory XPS is around 5 nm,59the presence of oxygen lattice at
529 eV indicates that formed EEI layer is thinner than∼5nm even after potential holding for 80 hours. In addition, C-O bond observed in C1s (∼286.3 eV) in Figure9aand O1s (∼533.4 eV) in Figure 9bwas found to increase with potential holding. This C-O compo-nent indicates the presence of oligomers (such as polyethylene ox-ide) due to electrolyte oxidation/decomposition at high potential.60,61
C-O band was previously observed in XPS on carbon-free, binder-free electrodes,3however, XPS on composite electrode obtained here
shows much higher intensity for C-O component, suggesting not only electrolyte but also conductive carbon was oxidized at higher poten-tials. Moreover, LiF (∼685.1 eV in F1s) and lithiated fluorophosphates (LixPFyOz,∼686.6 eV in F1s and 136 eV in P2p), which are known as
major components of EEI layer on the LiCoO2surface,3,62were found
after 1 hour potential holding at 4.4 VLi, as shown in the F 1s spectra in
Figure9cand P2p in Figure9d. Furthermore, after 80 hours of poten-tial holding, lithiated fluorophosphates (LixPFyOz) in P2p, drastically
increased from 1 hour to 80 hours. These observations support that the EEI layer (LiF, LixPFyOz, oligomers) grew and became
increas-ingly resistive to lithium ion conduction with holding potential, which is in agreement with activation energy increase in Figure8. There-fore, the increased reactivity of LiCoO2surface with higher degree of
delithiation (i.e. 4.4 VLi) and holding potential there can accumulate
decomposition products on the EEI layer (the increase of oligomer and salt related species such as LixPFyOz) and suppress charge transfer
kinetics.3,4
Conclusions
We have proposed here the assignment of electrochemical impedance spectra for composite positive electrode in Li-ion battery. The spectra have been modeled following rigorous criteria via exper-imental approach (schematically shown in Figure3). High-frequency semicircle can be assigned to impedance at the electrified interface, where lithium ion adsorption/desorption on the surface of composite pore structure coupled with lithium ion migration in the pore. Low-frequency semicircle should correspond to the combination of charge transfer resistance of lithium de-solvation/solvation and lithium inter-calation/deintercalation to/from the active particle surface, and lithium migration through the EEI layer resistance during charge transfer. Composite electrode showed two semicircles, on the other hand, only one semicircle appeared on the EIS for thin film electrode due to the absence of particle/pore structure. More importantly, with increas-ing EEI layer thickness, the resistance for low-frequency components was increased as well as its activation energy. These observations in-dicate energetic barrier to proceed charge transfer through EEI layer increased with EEI layer growth, suppressing the kinetics of the en-tire process. The insights obtained here should enable new strategies for probing the effect of EEI layer on kinetics of electrochemical interfacial reactions.
Acknowledgments
This work was financially supported by BMW Group. This work made use of the MRSEC Shared Experimental Facilities at MIT (XPS and SEM), supported by the National Science Foundation under award
Figure 9. XPS spectra of the (a) C1s, (b) O1s, (c) F1s and (d) P2p photoemission lines collected from composite LixCoO2electrodes. The electrodes were charged
to 4.4 VLiat 27.2 mA/g (0.1C) and hold at 4.4 VLifor 1 hour and 80 hours using 1 mol/L LiPF6in EC: EMC (3:7 wt:wt) and compared with pristine electrode.
All spectra were calibrated with the C1s photoemission peak of adventitious carbon at 285 eV. After subtraction of a Shirley-type background, all the spectra were normalized by fixing the C1s photoemission peak of adventitious carbon (285 eV) to the same value to facilitate comparison between samples. The spectra were assigned with the following contributions.3C1s: C-H/C-C (E
b=285 eV), C-O (and/or PVDF) (Eb∼286.3 eV), C=O/O-C-O (Eb∼287.6 eV), O=C-O (Eb∼288.8
eV) and CO3(and/or PVDF) (Eb∼290.3 eV). O1s: O lattice (Eb∼529.3 eV), ROLi (Eb∼531 eV), surface O/CO3/O-C=O (Eb∼532 eV), C-O/O-C=O (Eb∼533.4
eV) and LixPFyOz(Eb∼534.8 eV). F1s: LiF (Eb∼685.1 eV), LixPFyOz(Eb∼686.6 eV) and LiPF6(and/or PVDF) (Eb∼688.3 eV). P2p: phosphates (Eb∼134 eV),
LixPFyOz(Eb∼136 eV) and LiPF6(Eb∼137.7 eV).
number DMR-1419807. RT thanks Dr. Dino Klotz for his helpful EIS workshop and technical assistance to design the EIS cell.
ORCID
Ryoichi Tatara https://orcid.org/0000-0002-8148-5294 Yang Shao-Horn https://orcid.org/0000-0001-8714-2121
References
1. M. Gauthier, T. J. Carney, A. Grimaud, L. Giordano, N. Pour, H. H. Chang, D. P. Fenning, S. F. Lux, O. Paschos, C. Bauer, F. Maglia, S. Lupart, P. Lamp, and Y. Shao-Horn,J. Phys. Chem. Lett., 6(22), 4653 (2015).
2. R. Fong, U. V. Sacken, and J. R. Dahn,J. Electrochem. Soc., 137(7), 2009 (1990). 3. M. Gauthier, P. Karayaylali, L. Giordano, S. Feng, S. F. Lux, F. Maglia, P. Lamp, and
Y. Shao-Horn,J. Electrochem. Soc., 165(7), A1377 (2018).
4. L. Giordano, P. Karayaylali, Y. Yu, Y. Katayama, F. Maglia, S. Lux, and Y. Shao-Horn,
J. Phys. Chem. Lett., 8(16), 3881 (2017).
5. R. Jung, M. Metzger, F. Maglia, C. Stinner, and H. A. Gasteiger,J. Electrochem. Soc., 164(7), A1361 (2017).
6. R. Jung, R. Morasch, P. Karayaylali, K. Phillips, F. Maglia, C. Stinner, Y. Shao-Horn, and H. A. Gasteiger,J. Electrochem. Soc., 165(2), A132 (2018).
7. Y. Yu, P. Karayaylali, Y. Katayama, L. Giordano, M. Gauthier, F. Maglia, R. Jung, I. Lund, and Y. Shao-Horn,J. Phys. Chem. C, in press, (2018).
8. M. G. S. R. Thomas, P. G. Bruce, and J. B. Goodenough,J. Electrochem. Soc., 132(7), 1521 (1985).
9. D. Aurbach, M. D. Levi, Levi Elena, H. Teller, B. Markovsky, G. Salitra, U. Heider, and L. Herder,J. Electrochem. Soc., 145(9), 3024 (1998).
10. H. Nara, K. Morita, D. Mukoyama, T. Yokoshima, T. Momma, and T. Osaka, Elec-trochim. Acta, 241, 323 (2017).
11. M. D. Levi and D. Aurbach,J. Phys. Chem. B, 101(23), 4630 (1997). 12. H. Zheng, K. Jiang, T. Abe, and Z. Ogumi,Carbon, 44(2), 203 (2006).
13. Y.-M. Choi, S.-I. Pyun, J.-S. Bae, and S.-I. Moon,J. Power Sources, 56(1), 25 (1995). 14. A.-K. Hjelm and G. Lindbergh,Electrochim. Acta, 47(11), 1747 (2002). 15. Y. Yamada, Y. Iriyama, T. Abe, and Z. Ogumi,J. Electrochem. Soc., 157(1), A26
(2010).
16. T. Abe, F. Sagane, M. Ohtsuka, Y. Iriyama, and Z. Ogumi,J. Electrochem. Soc., 152(11), A2151 (2005).
17. M. D. Levi and D. Aurbach,J. Phys. Chem. B, 101(23), 4641 (1997).
18. D. Aurbach, M. D. Levi, E. Levi, and A. Schechter,J. Phys. Chem. B, 101(12), 2195 (1997).
19. M. Gaberscek, J. Moskon, B. Erjavec, R. Dominko, and J. Jamnik,Electrochem. Solid-State Lett., 11(10), A170 (2008).
20. S. J. An, J. Li, Y. Sheng, C. Daniel, and D. L. Wood,J. Electrochem. Soc., 163(14), A2866 (2016).
21. H. Zheng, H. Zhang, Y. Fu, T. Abe, and Z. Ogumi,J. Phys. Chem. B, 109(28), 13676 (2005).
22. L. Xia, K. Qiu, Y. Gao, X. He, and F. Zhou, J. Mater. Sci., 50(7), 2914 (2015).
23. S. S. Zhang, K. Xu, and T. R. Jow,Electrochim. Acta, 51(8–9), 1636 (2006). 24. S. J. An, J. Li, Z. Du, C. Daniel, and D. L. Wood,J. Power Sources, 342, 846 (2017). 25. M. Ender, J. Illig, and E. Ivers-Tiff´ee,J. Electrochem. Soc., 164(2), A71 (2016). 26. J. Costard, M. Ender, M. Weiss, and E. Ivers-Tiff´ee,J. Electrochem. Soc., 164(2),
A80 (2016).
27. S. Solchenbach, D. Pritzl, E. J. Y. Kong, J. Landesfeind, and H. A. Gasteiger,J. Elec-trochem. Soc., 163(10), A2265 (2016).
28. D. Takamatsu, Y. Koyama, Y. Orikasa, S. Mori, T. Nakatsutsumi, T. Hirano, H. Tanida, H. Arai, Y. Uchimoto, and Z. Ogumi, Angew. Chem. Int. Ed., 51(46), 11597 (2012).
29. K. Dokko, M. Mohamedi, Y. Fujita, T. Itoh, M. Nishizawa, M. Umeda, and I. Uchida,
J. Electrochem. Soc., 148(5), A422 (2001).
30. T. Osaka, D. Mukoyama, and H. Nara,J. Electrochem. Soc., 162(14), A2529 (2015). 31. Y. Hoshi, Y. Narita, K. Honda, T. Ohtaki, I. Shitanda, and M. Itagaki,J. Power
Sources, 288, 168 (2015).
32. R. Younesi, A. S. Christiansen, R. Scipioni, D. T. Ngo, S. B. Simonsen, K. Edstrom, J. Hjelm, and P. Norby,J. Electrochem. Soc., 162(7), A1289 (2015).
33. E. Endo, T. Yasuda, A. Kita, K. Yamaura, and K. Sekai,J. Electrochem. Soc., 147(4), 1291 (2000).
34. Z. Chen and J. R. Dahn,Electrochim. Acta, 49(7), 1079 (2004).
35. Y. Ozawa, R. Yazami, and B. Fultz,J. Power Sources, 119–121, 918 (2003). 36. S. S. Zhang, K. Xu, and T. R. Jow,Electrochim. Acta, 49(7), 1057 (2004). 37. I. Landa-Medrano, I. Ruiz de Larramendi, N. Ortiz-Vitoriano, R. Pinedo,
J. Ignacio Ruiz de Larramendi, and T. Rojo,J. Power Sources, 249, 110 (2014). 38. J. Illig, M. Ender, T. Chrobak, J. P. Schmidt, D. Klotz, and E. Ivers-Tiff´ee,J.
Elec-trochem. Soc., 159(7), A952 (2012).
39. I. Yamada, Y. Iriyama, T. Abe, and Z. Ogumi,J. Power Sources, 172(2), 933 (2007). 40. S. Yamada, M. Fujiwara, and M. Kanda,J. Power Sources, 54(2), 209 (1995). 41. H. Xia, L. Lu, and G. Ceder,J. Power Sources, 159(2), 1422 (2006).
42. I. Yamada, T. Abe, Y. Iriyama, and Z. Ogumi,Electrochem. Commun., 5(6), 502 (2003).
43. H. Sato, D. Takahashi, T. Nishina, and I. Uchida,J. Power Sources, 68(2), 540 (1997). 44. D. Takamatsu, Y. Orikasa, S. Mori, T. Nakatsutsumi, K. Yamamoto, Y. Koyama, T. Minato, T. Hirano, H. Tanida, H. Arai, Y. Uchimoto, and Z. Ogumi,J. Phys. Chem. C, 119(18), 9791 (2015).
45. D. Takamatsu, S. Mori, Y. Orikasa, T. Nakatsutsumi, Y. Koyama, H. Tanida, H. Arai, Y. Uchimoto, and Z. Ogumi,J. Electrochem. Soc., 160(5), A3054 (2013). 46. S. Kobayashi and Y. Uchimoto,J. Phys. Chem. B, 109(27), 13322 (2005). 47. S.-S. Kim, Y. Kadoma, H. Ikuta, Y. Uchimoto, and M. Wakihara,Electrochem.
Solid-State Lett., 4(8), A109 (2001).
48. Y. Yamada, Y. Iriyama, T. Abe, and Z. Ogumi,Langmuir, 25(21), 12766 (2009). 49. D. G. Kwabi, V. S. Bryantsev, T. P. Batcho, D. M. Itkis, C. V. Thompson, and
Y. Shao-Horn,Angew. Chem. Int. Ed., 55(9), 3129 (2016).
50. K. Ueno, K. Yoshida, M. Tsuchiya, N. Tachikawa, K. Dokko, and M. Watanabe,
J. Phys. Chem. B, 116(36), 11323 (2012).
51. M. Schmeisser, P. Illner, R. Puchta, A. Zahl, and R. van Eldik,Chem. Eur. J., 18(35), 10969 (2012).
52. T. Doi, K. Miyatake, Y. Iriyama, T. Abe, Z. Ogumi, and T. Nishizawa,Carbon, 42(15), 3183 (2004).
53. J. C. Bachman, S. Muy, A. Grimaud, H. H. Chang, N. Pour, S. F. Lux, O. Paschos, F. Maglia, S. Lupart, P. Lamp, L. Giordano, and Y. Shao-Horn,Chem. Rev., 116(1), 140 (2016).
54. S. Muy, J. C. Bachman, H.-H. Chang, L. Giordano, F. Maglia, S. Lupart, P. Lamp, W. G. Zeier, and Y. Shao-Horn,Chem. Mater., 30(16), 5573 (2018).
55. K. Xu, Y. Lam, S. S. Zhang, T. R. Jow, and T. B. Curtis,J. Phys. Chem. C, 111(20), 7411 (2007).
56. N. Ogihara, S. Kawauchi, C. Okuda, Y. Itou, Y. Takeuchi, and Y. Ukyo,J. Electrochem. Soc., 159(7), A1034 (2012).
57. J. P. Schmidt, T. Chrobak, M. Ender, J. Illig, D. Klotz, and E. Ivers-Tiff´ee,J. Power Sources, 196(12), 5342 (2011).
58. S. Verdier, L. El Ouatani, R. Dedryve`are, F. Bonhomme, P. Biensan, and D. Gonbeau,
J. Electrochem. Soc., 154(12), A1088 (2007).
59. D. Briggs and J. T. Grant, Surface analysis by Auger and X-ray photoelectron
spec-troscopy, IMPublications (2003).
60. R. Dedryv`ere, H. Martinez, S. Leroy, D. Lemordant, F. Bonhomme, P. Biensan, and D. Gonbeau,J. Power Sources, 174(2), 462 (2007).
61. R. A. Quinlan, Y.-C. Lu, D. Kwabi, Y. Shao-Horn, and A. N. Mansour,J. Electrochem. Soc., 163(2), A300 (2015).
62. Y.-C. Lu, A. N. Mansour, N. Yabuuchi, and Y. Shao-Horn,Chem. Mater., 21(19), 4408 (2009).