Dynamics of the illicit drug market in Italy
By
Gabriele Martegiani
M.S. Management
London Business School, 2015
B.S. International Economics, Management and Finance UniversitA Commerciale L.Bocconi, 2014
SUBMITTED TO THE MIT SLOAN SCHOOL OF MANAGEMENT IN PARTIAL FULFILLMENT OF THE REQUIREMENTS FOR THE DEGREE OF
MASTER OF SCIENCE IN MANAGEMENT STUDIES
AT THE
MASSACHUSETTS INSTITUTE OF TECHNOLOGY
JUNE 2016
02016 Gabriele Martegiani. All rights reserved.
The author hereby grants to MIT permission to reproduce and to distribute publicly paper and electronic copies of this thesis document in whole or in part
in any medium now known or hereafter created.
Signature of Author: MASSACH09ETTS INSTITUTE OF TECHNOLOGY
JUN 08 2016
LIBRARIES
ARCHIVES
Signature redacted
Signature red
MIT Sloan School of Management May 6, 2016
acted
I le A 1 --7
Accepted by: Hazhir Rahmandad Albert and Jeanne Clear Career Development Professor Assistant Professor of System Dynamics Thesis SupervisorSignature redacted
Rodrigo S. Verdi Associate Professor of Accounting Program Director, M.S. in Management Studies ProgramDynamics of the illicit drug market in Italy
ByGabriele Martegiani
Submitted to MIT Sloan School of Management on May 6, 2016 in Partial fulfillment of the requirements for the Degree of Master of Science in
Management Studies.
Abstract
Alongside street crime, a high prevalence of illicit drug consumption in the population represents a great source of funding for organized crime, and this is especially true in Italy, where the main criminal organizations control almost all the imports of cocaine and heroin: as a consequence, it is of the utmost importance that the policymakers take decisive and effective actions against the prevalence of illicit drugs in the country. However, the fact that the data about the prevalence of consumption is self-reported by substance users might represent an obstacle to an objective planning and evaluation of repressive policies: it is well documented how the reporting rate is lower than the actual prevalence in the population. This research attempt to address this issue by modeling a structure of the Italian market for the two main heavy drugs in the country (cocaine and heroin), using the tools provided by System Dynamics,
specifically to analyze the effects of the introduction of the law n.49/2006.
The results presented by the model - and consistent with the real data - show that the actual prevalence in the population is increasingly different from the reported one following the implementation of the law. This result implies the necessity for policy makers to adopt more accurate tools for the evaluation of past and proposed policies, in order to be able to estimate the dynamics involved in the complex and little known market of illicit substances.
Thesis Supervisor: Hazhir Rahmandad
Title: Albert and Jeanne Clear Career Development Professor Assistant Professor of System Dynamics
Acknowledgment
I would like to thank my parents, my brother and my entire family: my whole academic career,
from high school to the completion of this thesis, could not have been possible without you, your support and encouragement.
Table of Contents
1. Introduction...9
2. Review of Literature in the field of System Dynamics... 13
2.1. "Persistent Poppy" m odel... 13
2.2. L ater m odels of 1994, 2000, 2002... 14
2.3. Jack B . H om er 1991 M odel... 15
3. A note on the general literature... 19
4. D ata sources for the Italian m arket... 21
5. M odel structure...22
6. R esults, A nalysis and Im plications... 28
6.1. M odel calibration and insights... 28
6.2. M odel im plications...32
6.3. Scenario analysis...32
7. C onclusion and critique of the m odel... 40
R eferences...42
A ppendix A ... 45
1. Introduction
In the broader context of fighting the organized crime, one simply cannot avoid talking about the illegal drug traffic. Especially when considering Italy, illicit drug trafficking - most of which, in terms of revenues, is represented by cocaine and marijuana in their various forms
-replenishes the organized crime's pockets with money which will be eventually spent in corruption and money-laundering activities, with the associated negative effects on the "healthy" legal economy. If we were to consider as well the cost currently associated with the fight of this phenomenon, with tribunals all over the country overwhelmed with trials against minor drug dealers, more than 24,000 incarcerations a year for drug related felonies and their associated incarceration expense (above El Billion per year) the toll would significantly rise. On a smaller scale - albeit not less important - when considering the negative effects of high prevalence of illicit drugs, it is also necessary to keep in mind the well documented causal link between street crime and drug addiction (Ousey & Lee, 2016). For all these reasons, a clear and meaningful estimate of the national prevalence of the main and most addictive types of illegal drugs it if of the upmost importance to the law enforcement agencies both in Italy and around the world.
The first issue with these estimates, however, is how they are computed: since it is an illegal business there are no official statistics or records of its size both in terms of revenues nor quantity, and - currently -most of the drug contrast initiatives are modeled based on the results of the self reported prevalence in national surveys. These numbers are often misrepresenting the actual population of addicts in the country and this is especially true when particularly repressive drug contrast policies are introduced. Building on the assumption that because of these specific policies, aiming at increasing the legal punishment - and therefore the fear - of illicit drug consumption, users might influence the self reporting rate, biasing the recorded results of the policy itself, this research will focus onto building a model that could represent the actual status of the drug-abusing population in Italy following the now abolished law 49/2006.
The case of law n.49/2006
The controversial "Fini-Giovanardi" law n.49 of February 21, 2006 ("Testo Aggiornato del Decreto del Presidente della Repubblica, 9 ottobre 1990, n. 309," 1990) increased the legal
consequences of both possession and trade of illegal psychotropic substances and introduced the equivalence between the so called "light" drugs (cannabis, marijuana, etc.) and "heavy drugs". Since its inception the law was highly criticized because it contradicts the results of the
1993 referendum on drug consumption, and it was in fact deemed unconstitutional by the
Italian constitutional court and abolished in 2014 (La Repubblica, 12/02/2014).
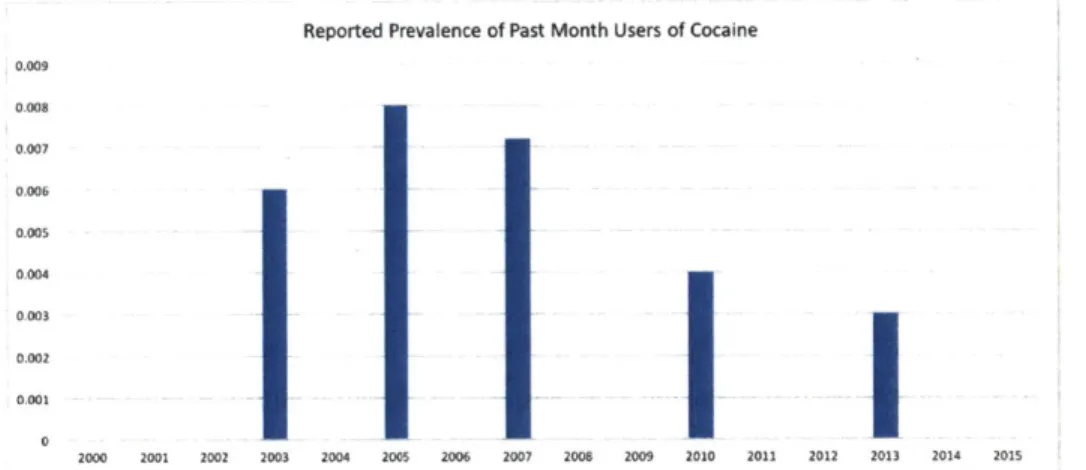
Throughout 8 years, such law impacted significantly to the national judiciary and penitentiary system and, as reported in the periodic pamphlet "I quarto libro bianco sulla legge Fini-Giovanardi"(Magistratura Denocratica, 2013) as of 2012 some 120,000 people were arrested because of ita, and as much as one third of the entire inmates in the country were jailed because of drug-related crimes, most of which linked to excessive personal consumption or small dealing: even the detention of a very limited quantity of marijuana was heavily punished, to the point that - as soon as the law was abrogated - some newspapers published guidelines on how to request a condemn reduction for drug possession crimes (VICE, 19/15/2014). On the other hand, the reported rates of prevalence of drug addiction in the country have diminished: after a period of undoubted growth of consumption between 2000 and 2005, as shown in figure
1
and 2, both the reported prevalence of Heroin and Cocaine decreased after the promulgation of law n.49/2006.Reported Prevalence of Past Month Users of Cocaine 0.009 0.008 0007 0.006 0.005 0.004 0003 0.002 0.001 2000 2001 2002 2003 2004 2005 2006 2007 2008 2009 2030 2011 2012 2013 2014 2015
Figure 1 -Reported Prevalence ofJPasl Moth Useis of Cocaine
Reported Prevalence of Past Month Users of Heroin 0.0025 0.002 0.0015 0.001 0.0005 0 2000 2001 2002 2003 2004 2005 2006 2007 2008 2009 2010 2011 2012 2013 2014 2015
Figure 2 -Reported Prevalence of Past A'oth Users of Heroin
Without entering in the decades-long discussion concerning the legalization or the contrast of psychotropic substances, this research intends to provide an instrument that, taking into account the dynamic effects of changes in policies, seizures and other market and perception dynamics, offers an unbiased estimate of the actual prevalence of consumption of the two more popular heavy drugs in the country, i.e. cocaine and heroin. The implementation and successive abrogation of the law n.49/2016 discussed above represents a unique opportunity to calibrate and compare the model with the actual results from the reported cases of cocaine and heroin addiction in the country, and based on the results it will be interesting to investigate what the model suggests about the future, and what the reported and actual prevalence will be once the law is abrogated and its effects dissipated.
Reasons for a two-drug market analysis
Among the different reasons to choose a two-substances analysis for this specific model, it is worth pointing out that cocaine and heroin are by far the two major sources of revenue for the organized crime and particularly the main three Italian mafias "Cosa Nostra", "'Ndragheta" and "Camorra" (note that whereas marijuana sales total an higher amount in revenue, its trade is dominated by smaller criminal groups (VICE, 05/11/2011)). Secondly, the first insights ( La Repubblica 16/03/2016) of this year result of the ESPAD survey (European School Survey on Project of Alcohol and Other Drugs) are reporting an alarming increase in the heroin consumption in the 15-19 years old population, peaking at an incredible 2% of 15 years old
males consuming heroin in the 30 days before the survey: heroin being highly addictive, this increase in popularity among high school students will probably result in a future higher prevalence in the overall population.
Furthermore on this issue, and more specifically in the broader context of drug abuse, polyconsumption - i.e. the consumption and/or addiction to two or more substances at the same time - is currently the first cause of death by overdose (de Oliveira, Alberghini, dos Santos, & de Andrade, 2013), with the combination of cocaine and heroin (the so called "Speedball") gaining again popularity in recent years (La Repubblica, 11/04/2016): whereas this study does not intend to specifically analyze the issue of polyconsumption, it might be useful to lay ground to future research on this topic by modeling how the reporting rate of the population is affected
by public policy and other market forces.
A note on methodology: why using System Dynamics for drug market modeling?
In a complex environment like our modem society is, the evaluation and optimization of public policies increasingly demand for a more accurate, simple and dynamic forms of modeling, a need that might well be satisfied by the tools offered by system dynamics. A modeling effort in this direction might in fact benefit the definition of drug contrast policies in to ways: first, with the qualitative process of modeling itself and secondly with a quantified computer simulation. Researchers have yet raised concerns about the usefulness of a quantified simulation of the modeling resulting from a apriori modeling effort (Coyle, 2000), stating that most value added relies in the understanding of complexity arising from the modeling task itself. Alongside previous answers on the issue (J. Homer & Oliva, 2001), 1 would however argue that if a model is successfully calibrated on real data, it not only validates the insights offered by the modeling process itself, but it be might also useful for an "educated" evaluation
2. Review of Literature in the field of System Dynamics
Whereas the development of System Dynamics as a discipline, initiated by Prof. Jay W Forrester and his colleagues at the MIT in the late '50s, was initially conceived as a tool to deliver computer-based model structures to analyze industrial systems, it quickly expanded to other purposes, having proved to be a reliable and useful modeling tool for complex socio-economic settings. Given this characteristic, System Dynamics thus became a popular tool in policy analysis, and this expanded to modeling the structure of illegal dug markets in order to better understand implications of existing and potential contrast policies. The first effort to model such market, or more specifically, the Heroine market in New York City, was proposed
by Levin, Roberts and Hirsch in 1975, with the purpose of identifying the best drug contrast
policies at city level.
Further notable efforts in the field are those of (Gardiner and Schreckengost, 1987), Everingham and Rydell ( Rydell & Everingham, 1994), Behrens and Caulkis (Behrens, Caulkins, Tragler, Haunschmied, & Feichtinger, 1999), and, finally, Jack B. Homer's (J. B. Homer, 1994) model, on which the model used in this paper is based on. In the following pages
I will discuss these efforts, analyzing in greater detail Homer's work.
2.1. 1975 "Persistent Poppy" model
Initially developed specifically for policy analysis, the model developed by Levin, Roberts and Hirsch was published as a book in 1975 under the name of "Persistent Poppy", and later inspired further modeling efforts with its structure. The model - and here I shall point out how this work dates back to the '70s - identifies the main problem of drug, and more specifically, Heroin addiction in the fact that consumers would be more prone to delinquencies to fund their addiction, thus driving up micro criminality. The structure proposed in the "Persistent Poppy" is however quite convoluted, if not too complex and detailed: the model goes as far as analyzing the impact of factors such as "Personal Relevance of Arrests" and "Psychopathological Attractiveness of Addiction". Despite these variables are indeed affecting the physiological and psychological addiction to drugs (Alexander, Beyerstein, Hadaway, & Coambs, 1981), their effect is intuitively small and could rather be summarized or compensated with the inclusion of more broad and meaningful variables.
In order to understand the rationale behind the inclusion of variables with such small effect, is important to remember the context in which this model was conceived and its ultimate goal: the "Persistent Poppy" was developed in order to better estimate local policy effect to contrast Heroine addiction and the associate street crime in a single urban area, which justify the inclusion of variables that could well be the target of specific local community efforts. For the broader national context that this research aims to model however, the significance of these factors is negligible and, thus, excludable.
2.2. Later models of 1994, 2000, 2002
The work of Everingham and Rydell in 1994 and Behrens and Caulkis in 2002 was later focused on modeling of drug initiation rates. Whereas Rydell proposes a model with first-order equations, Behrens extend the initiation rate structure with an endogenous function of prevalence, following Musto's 1997 theory of drug epidemics: it is introduced the idea that not only the number of drug users is directly influencing the initiation rate but also the proportion of heavy to casual users matters. The argument follows the idea of a possible deterrence effect given by a higher proportion of heavy users and associated health issues, and, in Behrens and Caulkis work, this explains the inflating and bursting of drug epidemic bubbles with the following equation of initiation:
H
Initiation volume = x + sLe ]
where:
* r is the number of "innovators", i.e. the users that try drug out of curiosity;
* s is the average rate at which users attract non users;
e q is a constant indicating the deterrence effect of heavy drug users;
* H & L are respectively the number of heavy and light abuse users.
H 2 10 H - 0 1.75 10' 1996 0510. 1* L 0 1.25 10-70000 =190 500000
~
<1196 20000 1975 9 L 2 10 4 1( 6 10 8 10 Figure 4Phase portrait of model (2) for the base case parameter-set:
a a 0.163,b .0024,g w 0.062.s -0.6, q - 7.0, -50M)1 , including smoothed historical trajectory of the current US cocaine epidemic (Everinghamn&Rydell)
I ISurfi I'/as I'lot (bLch; i. Caulkis, 7ru,1it. Ilo mms i, ied. & I chinge. I 999)
Other important insights offered by this model include a division of the drug user population similar to the one later used by Jack B. Homer into heavy and light addiction and a philosophical view on how the System Dynamic modeling task of the drug market work as a dynamic process itself, offering a Pirandello-esque' perspective on the subject.
2.3. Jack B. Homer 1991 Model
For the purpose of a deeper understanding of the dynamics underlying the Italian illicit drugs market, this research will be mainly based on the model developed by Homer on the national cocaine prevalence in the US. First developed in 1991, Jack B. Homer model was published in the Sysftern Dynamics Review in 1994, right in the midst of what it would have been known as "the war on drugs", which eventually resulted in a major increase in arrests related to illegal drugs trafficking and consumption. The increased fear of legal and social consequences arising from such policy are the very reasons that lead Jack Homer to develop a model that would account for a reduction in the reporting fraction of the cocaine user population in order to obtain a more realistic estimate of their number.
Whereas the model was developed with the purpose of delivering more precise estimates on the national cocaine prevalence in the period, it expresses its potential also in evaluating the effect of different scenarios, such as an increase of legal consequences of abuse, higher
' Luigi Pirandello, Nobel Prize for Literature in 1934, was notorious for his extensive use of
metatheatre, where characters of a theatrical play impersonate the role of actors in a "play
within the play". Similarly, here Behrens and Caulkis acknowledge to be modeling a dynamic
JP10141F -- - --vmm
INK--substances seizures, a reduction in correlated drugs abuse etc., while considering the reactions of the various sides of the market.
6
StructureIn his paper, Homer describes the structure of his model as "simpler" than previous efforts on the subject as to make it more clear and understandable by potential users. The model itself is divided into: a structure deemed to represent the different types of users and their interaction, a model of the market and the underlying forces determining price, purity and seizures and finally a structure representing the dynamics of underlying perceptions.
- User Population Structure
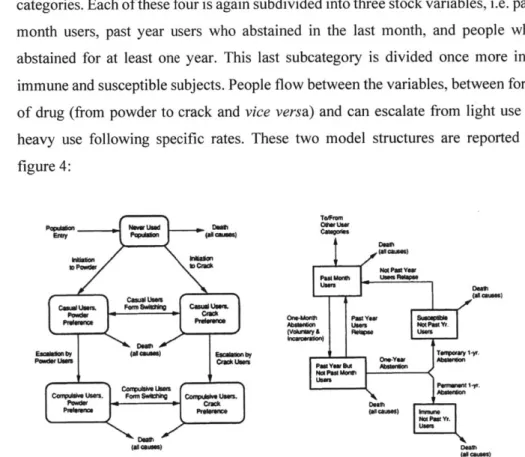
The model divides the population by two subcategories for each cocaine drug form: light and heavy users for both powder and crack cocaine, for a total of four categories. Each of these four is again subdivided into three stock variables, i.e. past month users, past year users who abstained in the last month, and people who abstained for at least one year. This last subcategory is divided once more into immune and susceptible subjects. People flow between the variables, between form of drug (from powder to crack and vice versa) and can escalate from light use to heavy use following specific rates. These two model structures are reported in figure 4:
Categones Death
Wo Past Year Past &Stor~ Lotet Reoaw"
Useers Death
Orte-Month Past Year a~t~ Absae.Won User Not Paot yr (Vokr"sy Reimpe Uset
Ternporay 1 -yr. OrtYON Apetererot P:.l yeat Wr DtSserbot Perantwt 1 -yr. Uses~eio DDeath W* PaS er.
Figure 4 -Popdaioni Sruucaure I &- _1 (J B. Iiowzer. 1994)
Papdabon Never Wad Dadlh E-y Papulaborl (0 cous")
W.Wabon kaaw
ID Powder ID Cr4*
f'.-, I LJWB
CULIW Usem Form SwnftV CaVA usem
powder CnKi
Prelerenice Prelver"
DOM
Escalation by (W CAUM) Escolabon by
Powder Users Crack LASM
Compuls" Lam
007PA" usem. Form Sw" C users.
P QMWEW - C4 ack
Preference Preference
Dam
- Market Structure
The market structure of Homer's model aims at estimating variables such as cocaine price and purity and how these are affected by different amounts of shipment seizures. These variables are then feeding back into the user population. affecting the rates at which the users initiate consumption, abstain from consumption, relapse or escalate to heavy addiction. This model component will be important especially for what concern the analysis of drug-contrast policy implications as - albeit simple
- it captures all the main market forces and the associated results on supply, sales,
price per gram, and purity to final users. A diagram is reported in figure 5.
COCAINE UER
Ratio
Seizure Fraction
eta(supsly
Retail Pricepy
Figure 5 - AIarket irictiire (J. B. Homer, 1994)
- Role of perceptions and overall model structure
The last, and most important, component of the model is represented by the structure of the public perceptions, shown in figure 6. Both market forces and user population size contribute to determine the rates at which the susceptible population initiate the consumption of drugs - as it influences the overall social exposure of the population to drug consumption and the associated stigma - but a pivotal role
is also played by perception of health risks and legal risks of consumption: these two are very important factors in determining both the initiation rate to casual use
of cocaine and the escalation rate, whereas the most important drivers for abstinence rates are market factors (supply, price) and arrests.
COCAINE USER M
POPULATION Use Prealence Preferred Parm 11111uXbo, of
Pe e ived Pe
Ae h S0*ZurS Fracon
Finem
F ignirc 6 - (A era/i Struc ture and IRates (J .I lnici. I 94b
Model output and critique
The model's initial aim was to provide policy makers with a realistic and dynamic estimate of the reporting and - most importantly - non-reporting cocaine users in the country, assuming that legal risk and the increased associated social stigma would reduce the share
of reporting users. Training the model
on
past data, Homer shows how his model deliverestimates consistent with publicly available data on reported cocaine users, and how the
reporting and the non-reporting population reacts to basic policy changes such as an
increment in arrests, seizures and associated perceptions.
This model structure is very efficient in representing the change in the reporting share of
drug users over time and, for this very reason, it will be the basis this research will rely on in the quest for a dynamic and inclusive portrait of the
Italian
illegal market. Alongside thepraise of Homer's structure, it is worth adding a brief critique, that is mostly concerning
the determinants of the initiation, abstention and relapsing rates: whereas the functions themselves are undoubtedly a simplification of reality, they use the prevalence of marijuana as a measure of drug availability (therefore positively correlated with initiation and the rate
of
relapsing intococaine
consumption). This might not only be a bold assumption in the first place (availability of alight
recreational drug might not correspond to availability ofcocaine or - worse - crack), but it might also prove dynamically inconsistent: since the very nature of the model is relying on the assumption that there is a share of drug users that voluntarily do not self report as such, and this reporting rate is supposedly affected by an increase in legal punishment for drug consumption and possession, why would the marijuana self-reported prevalence rate also not be affected? In other words, the marijuana reporting rate might also decrease as a consequence of the introduction of a harsh drug contrast policy, thus reducing the model estimates for cocaine initiation and relapsing rates.
A possible solution for this issue might be to not consider a measure of availability at all:
while this option might make logically more sense, the model could intuitively result less accurate, and leading to a poor interpretation of the dynamics involved. Another solution could be to adjust the marijuana prevalence for a given factor after the introduction of restrictive policies: this would however lead to a further discussion on how to determine such factor, that is beyond the scope of this research.
Again, considering the conceptual simplicity and the flexibility offered by this model, this research will focus on replicating Homer's proposed structure and adapt it to the Italian market. The aim is to modify the structure to accommodate two drugs (heroin and cocaine) and recalibrate the model onto Italian data, with the final goal to offer a reliable and meaningful tool for policy analysis on the subject.
3. A note on general literature
In order to achieve a model that is plausible both in terms of its qualitative structure and its quantitative parameters, this research makes extensive use and reference to the general literature on the subject. Whereas to justify most logical structures or relationship I refer both to Italian and International research, for the analysis and tuning of the model, both in terms of numbers and specific market tendencies, I mostly refer to Italian research, reports and newspaper articles from the main editorial groups in the country (Corriere della Sera, La Repubblica, I Sole 24 Ore etc.). More specifically, precise studies for the model calibration have been used to determine:
This is mostly compared to the results of "Probability of transitioning to substance dependence among substance users (Lopez-Quintero et al., 2011)", assuming the equivalence of "heavy use" to "addiction". The research reports:
"After the first year of substance use onset the probability of transition to dependence was almost [...] 7.1% for cocaine users. [...] a decade after use onset was [...] 14.8%
among cocaine users [...] Lifetime cumulative probability estimates indicated [...]
20.9% of cocaine users [...] users would become dependent [...]"
These values were used as a reference when building and calibrating the model and indeed the results are very close to the estimates of the report.
The assessment the seizure offset capacity
Homer in his work assumed that the organized crime is able to partially - if not fully
-offset the seized quantities of imported drugs: this is intuitively especially true not only because of the immense producing capacity of the suppliers in South America (cocaine) and Afghanistan (opium - the basis for heroin), but also because of the central role of the Italian crime organizations in the European illicit drug traded. In order to validate this assumption I mostly relied the work of Reuter, Crawford and Cave (Gordon Crawford, Jonathan Cave, 1988) alongside the International Narcotics Control Strategy Report (1993) of the US Department of State, the "Recent statistics and trend analysis of illicit drug markets" of the UNODC (UNODC, 2010) and some journalistic reportages (P. Jennings, ABC 1992), which led me to accept the inclusion of this variable in the model, using a similar offset capacity function to the one adopted by Homer's structure. An additional insight on the pivotal role that drug cultivation has in the drug producing economies is also given by the work of Edouard Martin and Steven Symansky (2005), which help to explain the reasons behind the enormous supply of the substances at the origin.
The effectiveness of preventive strategies
The main study used to evaluate how a preventive strategy based on sensitizing the population might affect the initiation rate was the work of Griffin (Griffin & Botvin,
2010), which report a 25% decrease in the initiation rate to heavy drug consumption in the target group versus the baseline after just one year.
4. Data sources for the Italian market
The Italian government has been actively involved in the contrast of the illegal drugs trade in the last decades for many reasons. First, as explained in the introduction to this study, the import and subsequent retail sales of drugs represent the main source of income to organized crime, and age long problem in the country: an effective drug contrast policy is in fact aimed both at the reduction of the street crime associated to heavy addiction and at reducing the sources of power of the mafias. Secondly the Italian government is traditionally close the the United States and, following the '80s and '90s war on drugs on the American continent, the political consensus was against the tolerance policy adopted elsewhere (e.g. Netherlands). For this very reason the Italian Parliament created a department aimed at coordinating the public efforts in this direction: the "Dipartimento per le Politiche Antidroga", which publishes annually a report on the status of the illegal drug market in Italy.
Most of the data used for comparison and calibration of the model proposed come form these yearly reports (Dipartimento Politiche Antidroga, 2001-2015), publicly available on the internet, which aggregate data about seizures from all law enforcement agencies, arrests and imprisonment statistics, estimates and reports of prevalence both from medical and non-medical (survey) sources. Some of the variables are integrated with the records obtained from surveys conducted by the ESPAD (European School Survey on Project of Alcohol and Other Drugs) and published in their yearly report (Guttormsson, Balakireva, Bjarnason, Kokkevi, & Kraus, 2005-2011), and by IPSAD (Italia Population Survey on Alcohol and Drugs) (IPSAD,
2003-2011).
More specifically, the variables collected and used for the calibration of the model are:
* Reported prevalence of users consuming cocaine in the last 30 days, year and more than one year
e Reported prevalence of users consuming heroin in the last 30 days, year and more than
one year
- Reported prevalence of consumption of marijuana in the last month
e Average percentage of pure substance per gram for both cocaine and heroin
- Average price of substance per pure gram for both heroin and cocaine - Seizures in kilograms for both cocaine and heroin
* Arrests for drug related crimes for both drugs * Incarcerations for drug related crimes for both drugs
All prevalence is computed over a target population including people resident in the Italian
Republic aged between 15 and 64.
It is important to note that these data were collected for all available years from 2001 and 2015 from a variety of sources and due to the very nature of these data it is hard to obtain very precise yearly records. Getting specific on how some of the data are computed, while the reported prevalence is the result of a national survey conducted every 3 years, the average purity and the average price for the two drugs are computed as the non weighted average of the price and purity of the seized quantities at retail-level. Also, the differentiation between heavy and light users is made on the basis of the reported "share of users in need of assistance", which in this model is assumed to be the share of heavy users.
5. Model Structure
The model structure is based on, and indeed replicates, the one proposed by Jack B. Homer in his analysis of the national cocaine prevalence, and it is divided as well into a user population structure, a market structure and a perceptions structure. From a more technical perspective, Homer's model was initially translated from its original iThink STELLA software form onto a Ventana Systems Vensim format: I then built onto the existing structure with the necessary additions and modifications. Some differences include separate market structures for heroin and cocaine, different role of the marijuana prevalence in the model and some additional structures to show the effect of policies on criminal revenue from drug sales.
* User Population Structure
The model identifies two subcategories of drug usage: light and heavy users for both cocaine and heroin, totaling four user structures. Each of these four is divided again into past month users, past year users who abstained in the last month, and people who abstained for at least one year, similarly to Jack B. Homer model. People can escalate from light (recreational) use to heavy addiction for both cocaine and heroin, can abstain, relapse in addiction and can also switch from on to the other drug. One example of this structure is reported in figure 7, obtained from the Vensim interface.
~L
k: . 5SNTY DmIN PAFigure 7 - User Siruciure
- Market Structure
In order to determine the market price per gram
of
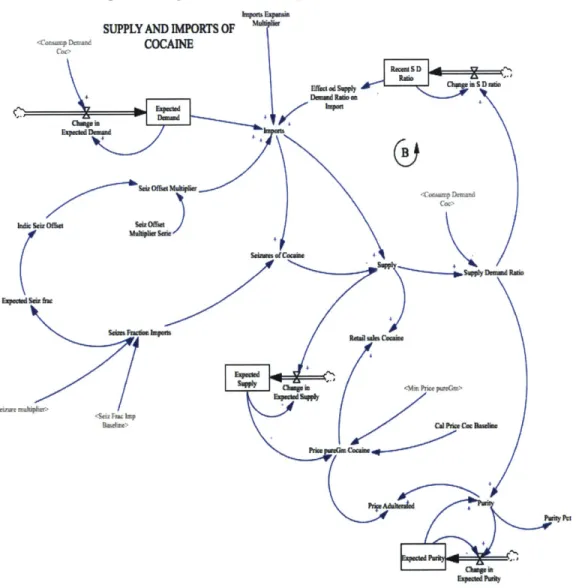
the two substances (both pure and adulterated), their purity and the effect of seizures on these two variables, the market structure include basic model of supply, demand and seizures over total imports and-as shown in the picture below - a supply-demand ratio that influences the price per
gram and the purity of the retail doses. The structure, based on the one proposed by Jack B. Homer, is duplicated to account for both drugs separately. However, whereas the data concerning purity, price and seizures is available for both drugs, it might be argued that some records - especially concerning heroin - are not detailed enough to
successfully calibrate a model: while this is indeed true, the distinction of the two markets allow the model to better represent the effect that seizures have
on
the finalprice, quality and supply of the two drugs, eventually delivering a more case-specific result. In figure 8 is reported a Vensim representation of this model component.
LrnPeit LIParIM
SUPPLY AND IMPORTS OF COCAINE R~ei S D f Supplp Ch m D ra o DEmpm io bm LExpeckd Upmed Deman
sni OffAr Multliper
rDecliscpt
be tCal Pra Coo Baidwo
Price .Cocoto
Pre Addte
Pry P
Chtmnge to
Figure 8 -COcaine A arket Strucutre
More specifically, this structure is based on an import variable represented as a function
of expected demand and the seizures (note that the imports are modeled in such a way
to partially
offset
seizures, addressing the previously mentioned capacity of criminal organizations to do so (Schulbofer, 1994)), and the resulting supply is then compared to the actual demand: in case of high supply-demand ratio the substance purity increases and the price decreases, whereas for a low supply-demand ratio the opposite is true. Once formed, the drug price and quality then feeds back in determining the initiation, abstention and relapsing rate of the addict population. The Supply-Demand ratio alsoinfluences negatively the imports creating a balancing loop: for a supply significantly above the demand in fact the imports will be reduced until the two are matched.
The formation of the reporting rate and the role of perceptions
The main and most important part of the model is the one that describes the formation of perceptions and how they affect the reporting rate of the population.
In order to analyze the effects of the shift in public policy from all points of view, three main perceptions are taken into account in the model:
o Perceived Safety
This is a measure of how safe people feel in consuming cocaine and heroin. It is negatively affected by the number of people being hospitalized due to drug consumption related issues and it is thus directly correlated with the number of heavy users of the two drugs. Since it does negatively affect the initiation rate, conceptually creates a balancing loop, similarly to what proposed by Behrens and Caulkins (look part 2.2).
o Perceived Legality
The perceived legality plays a pivotal role in the model, as it does not only impact the initiation, abstaining and relapsing rate, but also the reporting rate, the very focus of this research. The perceived legality in the model is a function of the arrests for drug related charges, both for consumption and sale (and this fits very well with the case of law n. 49/2006) and it directly relates to the effects of an increase in legal punishment, regardless of the actual incarceration rate of arrests. Compared to the equations proposed in past works, this feature
-introduced for the first time by Jack B. Homer in its model -is a big addition to the structure of the initiation rate function, as it accounts for the basic and most immediate effects of legal punishment.
o Exposure Ratio
The Exposure ratio accounts for the growth in the overall prevalence of illicit drug consumption in the population and it is used as a model proxy for the public exposure to consumption of both Heroin and Cocaine (note that this
e The reporting rate
It is quite intuitive that, considering the very nature and stigma associated to drug consumption, the self-reported addiction of drug users might be biased (Turner, 1998) (P. Grimm, 2010). In this research, as described above, the reporting rate is assumed to be a function of the perceived legality ratio and a baseline rate, and it directly impacts the proportion of addicts self reporting as such. The overall change of this rate will be very important from the point of view of policy evaluation, as a reporting rate decreasing over time might lead to the perception of afaux success of the implemented policy.
* The determination of the actual initiation, abstinence and relapsing rates
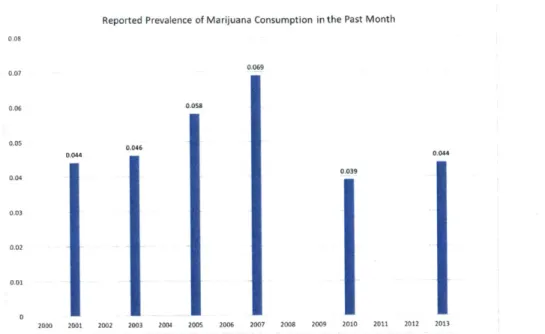
The two public perception measures of legality and safety are very important in determining the initiation, abstention and escalation rate, alongside the substances' price and the prevalence of Marijuana: following up on the issue raised when criticizing Homer's solution, the possibility that the reported prevalence of marijuana might itself be subject to changes in response to the implementation of restrictive policies is quite important for the case of this model, especially when considering the fact that, as shown in figure 9, the reported prevalence of marijuana suffer a strong decrease right after the introduction of law 49 in 2006.
Reported Prevalence of Marijuana Consumption in the Past Month 0.069 0.5 0.06. 0.050 0.046 0.044 0.044 0.039 0,04 E B"' 0.03 0.02 0.01 2000 2001 2002 2003 2004 2005 2006 2007 2008 2009 2010 2011 2012 2013
Figure 9 -Reported Prevalence of Alarijuana Consumption in the Past Month
In absence of alternative indicators in the general population however, for the main version of this model will still use this metric as a proxy for availability of illicit drugs, and, in order to evaluate the impact of this assumption, I will add a what-if analysis with a marijuana prevalence constant at 2007 level in Appendix A.
The final initiation function for the two drugs will be:
InitiationRate = a x M arijuanaPrevalencefi xExposureRatiofi2 xPriceRationa xPerceivedSafety4 xPerceivedLegality#s
Consistently with what proposed by Jack B. Homer in his work and with Vlahov (Vlahov et al., 2001). Note that this function is delivering similar results to the one proposed by Behrens and Caulkins (part 2.2), but adding an important feature: the deterrence effect of a restrictive policy, represented by the inclusion of the "Perceived Legality" factor.
6. Results, analysis and implications 6.1. Model calibration and insights
The model has been calibrated on past datae and - after some adjustments - performs well as shown in the output depicted below for the past month prevalence of cocaine:
Prevalence of Cocaine consumtion in the last 30 days
.02 .015 .. . . . ... ... .01 ... 0 2000 2002 2004 2006 2008 2010 2012 2014 Time (Year)
Reported Prevalence of PMU Cocaine FinalOpt2 ... ...
Prevalence PMU Cocaine : FinalOpt2
-Official Cocaine Prevalence : FinalOpt2 ... . 0 . .aaa
And past month prevalence of heroin:
Prevalence of Heroin Consumption in the last 30 days .003 D002 25 ... eam."Sm o-,o .00075 0 2000 2002 2004 2006 2008 2010 2012 2014 Time (Year) Reported Prealence of PMU Heroin : FinalOpt2 .
Prevalence PMU Heroin : FinalOpt2 I
Official Heroin Prevalence : FinalOpt2 -... . ... a . . -. ... a
Where the green dots are the official reported data and the blue ones are the model estimate of the self reported prevalence in the population.
Note that the model provides us with an estimation of the actual prevalence in the population (in red) and, as it was expected, the initial small discrepancy grows bigger right at the introduction of law n.49/2006 (note that the lawmaking process in Italy is very long and the law was presented as a "decreto legislativo" in 2005 (Parlamento
e Note that data are available until the years 2012-2013 as the prevalence surveys are taken every 3 years.
Italiano, 2006)): this it has strong implications for the final evaluation of the effectiveness of the law itself, as it does suggest that the approach of increasing the legal punishment of drug possession was more effective in reducing the reporting rate among the consumer population rather than the consumption itself. These fears are confirmed by a more detailed analysis of the reporting rate of the two drugs themselves:
Reporting Fraction of Cocaine and Heroine Users
.9
.5
2000 2002 2004 2006 2008 2010 2012 2014 Time (Year)
Reporting Fraction of PMU Cochine: Finalopt2 . a ... a
Reporting Fraction of PMU) Heroin : Finalopt2
Where the red series represents heroin and the blue the cocaine user reporting rates. Again it is quite clear how the model suggests a gradual decrease of the reporting rate, from an average of 85% before the introduction of the law 49/2006 to a significantly lower 55% after few years past the implementation. As can be seen on the graph, the two rates move symmetrically -this is due to a reasonable approximation of the model: as said, the reporting fractions are modeled to be influenced by a single perceived legality factor, mainly based on the arrests for drug related charges in the population. And the suggested behavior of the reporting fraction might be clearly explained by the comparison with the arrest rate:
Arrcsts for drug sale and possession 60.000 45.000 . 30.000 . ... .-15,000 0 2000 2002 2004 2006 2008 2010 2012 2014 Time (Year)
Arrests CocHer: Finalopt2 ...
Official Arrests CocHer : FinalopE2
Where the blue series shows the number of arrests suggested by the model and in red is reported the official arrest figure by year.
It can be easily observed how the model suggests that the increase in the arrest rate that followed the promulgation of the law n.49/2006 had a direct negative impact on the reporting rate. Also, the model suggests that -at the same time- the organized crime capacity to partially offset seizures allowed for a steadily growing level of imports as shown below:
Total Seizures of Cocaine and Heroin
40,000 30,000 m...--""" . . .. . . . . . """0.. 20.000 . ... ome. 0 2000 2002 2004 2006 2008 2010 2012 2014 Time (Year)
Total Official Seizures : Finalopt2 . .a . -aaa a a ... a .a a a a a .. .a
Total Seizures: Finalopt2
Total Imports : Finalopt2 ... ... ... a a a a a a a a -a n aaa
Where the blue series is the official seized quantity of both drugs by year, the red series is the model estimate for the seriesf and in green the estimated imports. Likewise, the
Note that the model was calibrated on the two separate drugs, whereas the results here summarized in a single graph. Note that there is no record of heroin seizures before 2007,
model proposes a price level per pure gram of the two substances: when compared with actual data, these are also quite similar (note that the heroin official prices are much more volatile due to the low number of seizures counted in computing the original statistic). In the graph below, reporting prices, the grey and red series are representing the prices suggested by the model. whereas the blue and green line are the estimated prices collected from the yearly report to the Italian parliament.
Prices goo 600 E 200 0 2000 Official Price pu Price pureGm Co
Official price pur Price pureGm He 2002 2004 2006 2008 2010 2012 2014 Time (Year) cGm coc :Finalop2 ....-..-...-... ... ...-... -. caine : Finalopt2 . i I I cGm her: Finalopt2 ..---... roin: Finalopt2 , , ,
z-Note that the resulting supply - calculated as the estimated imports minus the estimated seizures - correspond to final retail sales revenue constantly around C5.3Billion, in line with the recent estimates of the Abele association (11 Fatto Quotidiano, 26/06/2016) for the Italian market and UNODC (UNODC, 2010).
Total Revenue from retail sales
6 B 5.5 B 5 B 4.5 B 4B 2000 2002 2004 2006 200t 2010 2012 2034 Time (Year)
Total Retail Sales : Finalopt2 ....-. - -..
....-.-...--.-and the aggregate value is therefore the sum of the Cocaine seizures plus an estimate for years before 2007.
31
6.2. Model Implications
Once observed the results suggested by the model, it is clear that such model structure has some serious implication for the way drug-contrast actions are currently evaluated: whereas some results might be represented by the number of arrests and the quantity of substance seized throughout the year, the actual impact that harshly repressive policies have on the prevalence of substance consumption in the population might be significantly misrepresented by the official surveys. In the detail of the case of the law "Fini-Giovanardi" n.49/2006, once calibrating the model to reproduce data consistent with reality, this seems to be the case for a significant share of the population as wide as almost 1% of the target population. Italian policymakers should be aware of this effect and perhaps account for it using models similar to this one when evaluating the impact of restrictive measures.
6.3. Scenario analysis
Having tuned the model on real data, it might be now interesting to simulate some possible future scenarios based on a reasonable evolution of key parameters in order to project the user prevalence of the two drug in the foreseeable future: among all the possible scenarios I selected the three that would make more sense, i.e. a baseline, a repressive and a permissive one.
Baseline
A first baseline future scenario is computed based on a constant target population (note
that the Italian demographic growth is close to zero), similar marijuana prevalence, arrest and seizure rate in line with the one at the end of the recorded period (2012). This scenario would ideally represent the fact that the government did not undertook any particular countermeasure after the repeal of the law 49/2006.
Prevalence of Cocaine consuntion in the last 30 days .03 .0225 0075 2000 2002 2004 2006 2008 2010 2012 2014 2016 2018 2020 Time (Year)
Reported Prevalence of PMU Cocaine : Scenario 1 . a ...
Prevalence PMU Cocaine : Scenariol
Official Cocaine Prevalence : Scenario]
Prevalence of Heroin Consumption in the last 30 days .003 .00225 .00075 0 2000 2002 2004 2006 2008 2010 2012 2014 2016 2018 2020 Time (Year)
Reported Prealence of PMU Heroin: Scenario] ... ...-... ...
Prevalence PMU Heroin : Scenario] <1-- -
-Official Heroin Prevalence: Scenario] ... ... ....
Reporting Fraction of Cocaine and Heroine Users .9
8
I
% ..
2000 2002 2004 2006 2008 2010 2012 2014 2016 2018 2020
Time (Year) Reporting Fraction of PMU Cocaine: Scenariol ...-.
Reporting Fraction of PMU Heroin : Scenario l"....
Note that in this case the perceived legality is slowly stabilizing, following a flat growth of arrests after the end of 2012. This in turns re-stimulate the initiation rates, causing the prevalence of cocaine and heroin to start growing again. At the same time the reporting fraction is stabilizing around the levels of the late 2012 - also as a consequence of the flat growth in arrests - thus causing the reported rate to grow symmetrically to the actual prevalence rate in the market, but still representing only a
proportion of the actual number of addicts: here the model is showing clearly how repressive policies might have a long-lasting effect on the reporting rate of the population. It is worth noticing that this might actually be a good representation of what it is happening in these years in Italy: as picked by "La Repubblica" (11/04/2016) the first insights on the new survey proposed by the CNR (Consiglio Nazionale per le Ricerche) show a staggering increase in the reported cases of heroin compared to 2011 data: this might well be the result of the increase in actual prevalence combined with a slow growing back of the reporting fraction.
Repressive Scenario
The repressive scenario takes in consideration both the effects of higher arrests and a (perhaps consequential) reduction in the marijuana prevalence, and the impact of an increase in seizures separately, so to identify the impact of each sub-scenario.
Increase in arrests
This scenario is assuming an increase over four years of arrests of 30% over the baseline associated with a reduction of the marijuana prevalence by 3
0%,
also accomplished progressively over four years. The suggested results are reported below:Prevalence of Cocaine consumtion in the last 30 days
.02 .015 .005 0 2000 2002 2004 2006 2008 2010 2012 2014 2016 2018 2020 Time (Year)
Reported Prevalence of PMU Cocaine : ArrestIncrease ...
Prevalence PMU Cocaine : ArrestIncrease
.-Prevalence of Heroin Consumption in the last 30 days .003 00225 .0015 -.00075 0 2000 2002 2004 2006 2008 2010 2012 2014 2016 2018 2020 Time (Year) Reported Prealence of PMU Heroin : ArrestIncrease .
Prevalence PMU Heroin : ArrestIncrease
Official Heroin Prevalence: Arrestincrease . . . . . . . . . . .
Reporting Fraction of Cocaine and Heroine Users
9%
.6%
...
*-2000 2002 2004 2006 2008 2010 2012 2014 2016 2018 2020 Time (Year)
Reportinp Frction of PMU Cocaine :Arrestincrease .. . . . . . .
Reporting Fmction of PMU Heroin: Arrestincrease
This scenario replicates what happened in the years 2006-2014 under the law n.49/2006, with a high number of arrests and a resulting decrease in the reporting rate, and it would ideally replicate a prosecution of such policy (assuming constant seizures). The model suggests that over the course of the next 8 years such scenario would feature a reporting fraction stabilizing to the low level of 2012 - below 60%
-and an actual prevalence in the population decreasing for both heroin -and cocaine.
Increase in Seizures
For this scenario I assumed an increase in seizures of 50% over the baseline scenario, while arrests and marijuana prevalence are assumed to stay constant to the baseline after 2012.
Prevalence of Cocaine consumtion in the last 30 days
.02
0
2000 2002 2004 2006 2008 2010 2012 2014 2016 2018 2020
Time (Year)
Reported Prevalence of PMU Cocaine : Seizureincrease -. .. .. -... ...
Prevalence PMU Cocaine : Seizureincrease -
-Official Cocaine Prevalence: SeizureIncrease ... .... a . ... ....
Prevalence of Heroin Consumption in the last 30 days
.003 .00225 .0015 00075 0 2000 2002 2004 2006 2008 2010 20]2 2014 2016 2018 2020 Time (Year)
Reported Prealence of PMU] Heroin: Seizurelncrease -... . ...
Prevalence PMU Heroin : Seizurelncrease
Official Heroin Prevalence: SeizureIncrease .... .. - -... ...
Reporting Fraction of Cocaine and Heroine Users .9 .4. .675 .225 -0 2000 2002 2004 2006 2008 2010 2012 2014 2016 2018 2020 Time (Year)
Reporting Fraction of PMU Cocaine: SeizureIncrease . ..-...-..
Reporting Fraction of PM U Heroin : Seizurelncrease
Note how while the effect over our variables of interest - i.e. prevalence, reported prevalence and reporting rate - is indeed similar in direction to the previous scenario featuring an increased arrest rate, an increase in seizures is not affecting the actual consumption prevalence as much. This is a consequence of the fact that there is very little deterrence effect in an increase in seizures, and the only way it will impact the initiation and abstention rate of the population is trough an increase in retail price per
equally-pure dose: this effect is in fact partially mitigated by the reduction in purity of the retail substance and by increased imports, jeopardizing the effect of an increase in seizures.
Permissive Scenario
The permissive scenario assumes a decrease of both seizures and arrests of 30% below the baseline and an increase Marijuana prevalence by 30%, all accomplished over four years. Note that this result might be compared with the proposed legalization of light drugs in the country, and it shows a significant resemblance to what happened in Colorado after the legalization of Marijuana for recreational use: as reported by the Rocky Mountain High Intensity Drug Trafficking Area report (RMHIDTA, 2015) such provisions resulted in an increase of 32% in past month marijuana use among adults in the state. First data concerning of only 6 months after the legalization suggests that the effect of such policy on the prevalence of other drugs show contradictive results, with an increase in Heroin and a slow decrease in Cocaine users (Mendelson, 2014).
Prevalence of Cocaine consumtion in the last 30 days
.04
.02
0
2000 2002 2004 2006 2008 2010 2012 2014 2016 2018 2020 Time (Year)
Reported Prevalence of PMU Cocaine : Scenariol . . ..
Prevalence PMU Cocaine : Scenario] . ...
-Official Cocaine Prevalence: Scenariol . . . .. . . . . . .
Prevalence of Heroin Consumption in the last 30 days
.004 .003 .-.002 .001 0 2000 2002 2004 2006 2008 2010 2012 2014 2016 2018 2020 Time (Year)
Reported Prealence of PMU Heroin : Scenario I " - -.-Prevalence PMU Heroin : Scenariol
Reporting Fraction of Cocaine and Heroine Users .575 .625 *__J 2000 2002 2004 2006 2008 2010 2012 2014 2016 2018 2020 Time (Year)
Reporting Fraction of PMU Cocaine: Scenario I ... ... .
Reporting Fraction of PMU Heroin: Scenario 1
-The model does indeed suggest a similar growth trend for both drugs but also a slow increase in the reporting rate back to very high levels in the next years: this is due to the low readjustment of the perceived legality, that affects both the initiation rate -thus leading to the overall increase in prevalence for both drugs - and the actual reporting rate. Note that whereas in Colorado there was a full legalization of marijuana for recreational use, the model is representing a scenario of higher tolerance to illicit drug consumption in general, and its effects on cocaine and heroin prevalence in the population: the main difference is that the relationship between marijuana prevalence and the Initiation, abstention and relapse rate of both cocaine and heroin might well become insignificant in a context of full legalization, whereas in a "tolerance" scenario
it make sense that such causation link is still present.
Proposed addition
As I will point out in the conclusion, one major issue with the current model is that it does not account for the effect of alternative repressive measures, the main being preventive sensitizing about negative health effects associated to drug consumption. Such policy has been evaluated when implemented in high school students and proved to be very effective, to the point of registering a 25% decrease (Griffin & Botvin, 2010) in heavy drugs initiation among the study group after one year. In an attempt to lay the ground for future efforts on the issue, I might propose that a similar strategy might lead to the same effectiveness among the general population, thus effectively changing the Perceived Safety rate in the initiation rate function by a factor of 25% to account for the increased awareness of the dangers associated to drugs consumption:
InitiationRate = a xMarijuanaPrevalence6' xExposureRatiol x PriceRatio3 xPerceivedSaf etyad x PerceivedLegalityl
In the years after a full-scale implementation of the prevention strategy".
A quick analysis of the baseline scenario with prevention strategy after 2012 is
reported below.
Prevalence of Cocaine consuntion in the last 30 days
.02 .015 .01 .005 .ae"4 0 2000 2002 2004 2006 2008 2010 2012 2014 2016 2018 2020 Time (Year)
Reported Prevalence of PMU Cocaine : ScenarioPre . ... ... ...
Prevalence PMU Cocaine : ScenarioPrev
Official Cocaine Prevalence: ScenarioPrey ... ...
Prevalence of Heroin Consumption in the last 30 days
.003 .0025 .DD075 0 2000 2002 2004 2006 2008 2010 2012 2014 2016 2018 2020 Time (Year)
Reponed Prealence of PMU Heroin ScenarioPrey . ... ... Prevalence PMU Heroin: ScenarioPrev -I
Official Heroin Prevalence: ScenarioPrev . a
-. D.- .-...
Reporting Fraction of Cocaine and Heroine Users .9 .6 .5 2000 2002 2004 2006 2008 2010 2012 2014 2016 2018 2020 Time (Year)
Reporting Fmction of PMU Cocaine: ScenarioPrev . ...
Reporting Fraction of PMU Heroin : ScenarioPrev
The model suggests that the effects of such policy over the next 8 years are very significant, leading to a reduction of the prevalence of 0.5% points versus what it would have been without intervention in the case of cocaine. Of course this effect is the result of a simple addition that does not consider the other variables - perhaps on the abstention rate - that such policy might influence.
7. Conclusion and Critique of the model
The model presented in this research is undoubtedly an approximation of what the realcocaine and heroin markets are in this very moment in Italy: it does rely on the availabledata for its calibration - which end in 2012 - and does not include many variables that might be of interest to the policy maker, but it does a good job in capturing the dynamics of the prevalence of consumers in the target population and - specifically for the case taken in analysis, i.e. the introduction of the repressive law n.49/2006 - it does suggests that the hypothesis that increased fear of legal consequences associated with drug consumption might have caused low reporting rates is consistent with the real data. This result implies the need for policymakers to adopt new, dynamic tools that are able to model the structure and the behavior of a complex and - to many - obscure structure of the illicit drugs market: this is necessary to attain a much needed objective evaluation of past policies and a reasonable projection for future ones.
It it also important to stress that the main benefit of this and other modeling efforts in the context of system dynamics is the better understanding of the interaction of different variables and how their feedback loop influences results over time: the resulting model is an attempt to structure these interactions so to provide meaningful estimates of the actual prevalence of both