ORIGINAL PAPER
Long-term snow and weather observations at Weissfluhjoch
and its relation to other high-altitude observatories
in the Alps
Christoph Marty&Roland Meister
Received: 28 September 2011 / Accepted: 3 January 2012 / Published online: 18 January 2012 # Springer-Verlag 2012
Abstract Snow and weather observations at Weissfluhjoch were initiated in 1936, when a research team set a snow stake and started digging snow pits on a plateau located at 2,540 m asl above Davos, Switzerland. This was the begin-ning of what is now the longest series of daily snow depth, new snow height and bi-monthly snow water equivalent measurements from a high-altitude research station. Our investigations reveal that the snow depth at Weissfluhjoch with regard to the evolution and inter-annual variability represents a good proxy for the entire Swiss Alps. In order to set the snow and weather observations from Weissfluh-joch in a broader context, this paper also shows some comparisons with measurements from five other high-altitude observatories in the European Alps. The results show a surprisingly uniform warming of 0.8°C during the last three decades at the six investigated mountain stations. The long-term snow measurements reveal no change in mid-winter, but decreasing trends (especially since the 1980s) for the solid precipitation ratio, snow fall, snow water equiva-lent and snow depth during the melt season due to a strong temperature increase of 2.5°C in the spring and summer months of the last three decades.
1 Introduction
Mountains played a central role in the history of meteorol-ogy. From the 1860s onwards, meteorologists began to recognise that the vertical structure of the atmosphere holds important clues to large-scale weather trends. They began to
distinguish between valley measurements, which reflected local peculiarities, and measurements taken at high-altitude observatories, which revealed general characteristics of the atmospheric circulation (Coen2009). However, meteorolog-ical measurements at the mountain observatory Weissfluh-joch (WFJ) above Davos started for a totally different reason. In December 1936, a research team of the Swiss Snow and Avalanche Research Commission appeared on the Weissfluhjoch, where a few years later, the Swiss Federal Institute for Snow and Avalanche research (SLF) was founded. They set a snow stake and started digging snow pits on a plateau situated at 2,540 m asl. The goal of these activities was to obtain a better understanding of avalanche formation. Being aware that avalanches are always a prod-uct of a particular stratigraphy of the snowpack and special weather conditions, these pioneers also initiated daily weather observations during the snow season. Due to the focus on avalanche formation, it was not until 1947 that Weissfluhjoch became part of the network of the Swiss Federal Office of Meteorology and Climatology (MeteoS-wiss) and the meteorological observations were performed operationally year-round. The successful collaboration of these two institutions (SLF and MeteoSwiss), was an im-portant basis for the fact that that the daily observations from Weissfluhjoch soon became indispensable to answer basic questions in alpine meteorology or climatology. In the first decades, the data were already used to investigate the snow metamorphosis (Bader et al. 1939), to analyse the altitude dependence of the snow depth (Schild 1949), to explore the evaporation of snow (De Quervain 1951), to explain the structure of hail grains (List and de Quervain
1953), to determine the climatological snowline (Zingg
1954), to analyse the temperature dependency of the forma-tion of snowflakes (Bossolasco1954) or to investigate the spatial variability of new snow height (Zingg1963).
C. Marty (*)
:
R. MeisterWSL Institute for Snow and Avalanche Research SLF, Flüelastr. 11,
7260 Davos, Switzerland e-mail: [email protected]
Theor Appl Climatol (2012) 110:573–583 DOI 10.1007/s00704-012-0584-3
Over the last seven decades, many experimental measure-ments and international projects have been carried out at Weissfluhjoch by different research groups. They all benefited from the wide range of operational measurements for avalanche warnings, the climatological record and the accessibility of the site. Besides fundamental snow and avalanche research, the topics covered range from isotopes in the snowpack (Stichler et al.1981), to snow hydrological investigations (Martinec and Rango 1981), sensor tests (Gubler and Hiller1984), aerosol analyses in the snowpack (Baltensperger et al.1993), remote sensing validation (Seidel et al.1994), radiation studies in mountainous terrain (Pluess and Ohmura1997), snow cover modelling (Fierz et al.1997), snow texture investigations (Pielmeier et al.2001), the altitude dependence of the greenhouse effect (Marty et al.2002), UV radiation studies (Schmucki and Philipona2002), permafrost investigations (Luetschg et al.2004), international snow model intercomparisons (Brown et al.2006), solid precipitation inter-comparisons (Egli et al.2009), climate change studies (Bavay et al.2009), glacier change analyses (Huss et al.2009), the microwave backscattering of snow (Werner et al.2010) or recently to the monitoring of organochlorine pesticides (Zhu et al.2011).
The focus of this paper is on climatologically impor-tant snow parameters, because, as we will demonstrate, the homogeneity and long-term availability is unique for these parameters at a high-altitude location such as Weissfluhjoch. However, we will also give an overview on the now operationally measured parameters at Weiss-fluhjoch and demonstrate how some of these parameters react to the observed climate change. In order to set these measurements in a wider frame, we will show some comparisons with data from other long-term mountain observatories in the Alps.
2 Locations and data 2.1 Weissfluhjoch
Weissfluhjoch is the name of a saddle in the eastern Swiss Alps about 1,000 m above the valley floor in Davos. Most of the meteorological measurements are performed on a nearby unnamed peak at 2,690 m asl. This small peak is positioned in the middle of the ski area and the terminus of a cable car, where the SLF headquarters were located for more than 60 years. The well-known observation site where the operational snow measurements started in 1936 is located on a plateau 150 m below. The daily snow depth is read from a snow stake with a cm-scale, the new snow height is measured on a new snow board which is placed each morn-ing flush with the snow cover surface, and the new snow density is calculated from the weight of 1,000 cm2section
taken by a snow sampler from this new snow board. The total snow water equivalent of the snowpack is measured bi-weekly together with the snow hardness and other strati-graphic parameters in a snow pit as described in Meister (2009). These snow measurement methods have hardly changed in the last 75 years and were always accompanied by daily meteorological observations. These meteorological and nivological observations are part of the operational net-works run by SLF and MeteoSwiss. Despite the fact that solid precipitation is difficult to measure reliably with stan-dard precipitation gauges, Weissfluhjoch is the only high-alpine observatory with collocated measurements of new snow height. It is also the only station in the MeteoSwiss network where the precipitation gauge is manually adjusted to be 2 m above the snow surface in order to be consistent with the measurements without snow on the ground. The site is well protected from wind and its environment has not been changed. Besides the daily manual measurements of the different snow parameters, there are now a whole series of long-term automatic measurements available, which are listed in Table1.
In order to investigate the spatio–climatological represen-tativity of the Weissfluhjoch snow depth, we also used data from the“Interkantonales Mess- und Informations System” IMIS (Egli2008), which covers the entire Swiss Alps. Since most of the IMIS stations became operational after 1999, the investigation period is limited to the 12 years between 2000 and 2011. There are 64 stations above 2,000 m asl available for this time period. According to the avalanche service, the main user of this network, 13 of these stations are on unrepresentative ridges or crests and where thus excluded from the analysis. The 51 remaining ones are situated be-tween 2,000 and 2,900 m asl and have a median altitude of 2,405 m asl, i.e. only 145 m lower than the Weissfluhjoch observation site.
In the following, we introduce the five other high-altitude observatories in the Alps (Fig.1), which are used to put the Weissfluhjoch measurements into perspective.
2.2 The five other long-term mountain observatories The Säntis (SAE) observatory (2,502 m asl) is on an ex-posed peak in the foothills of the north eastern Swiss Alps and part of the operational network of MeteoSwiss. Snow depth used to be measured close to the peak, but since 1978, it is read with binoculars from a snow stake in a flat depres-sion about 300 m lower at 2,230 m asl. New snow height is measured with a Hellmann precipitation gauge (if full, ad-justed to valley measurements from neighbouring stations) and thus can hardly be compared to standard measurements. Moreover, the measurement location has changed several times during the recent decades (personal communication Willy Kobler, observer MeteoSwiss).
The Jungfraujoch (JUN) mountain observatory (3,580 m asl) is situated on an exposed ridge in the northwest of the central Swiss Alps and is part of the MeteoSwiss operational network. Neither precipitation nor snow is measured at this exposed location.
Grand St. Bernard (GSB) is situated at the top of an important pass in the western Swiss Alps at 2,472 m asl and is part of the MeteoSwiss operational network. Due to its wind prone location, reliable snow measurements are a difficult task. Snow depth was only recorded for some years (1965–1981). New snow height has only been measured since 2007.
The mountain observatory Zugspitze (ZUG) is locat-ed on an exposlocat-ed peak (2,962 m asl) on the German/ Austrian border and is part of Germany’s National Me-teorological Service DWD operational network. Snow depth measurements are available since 1901 from snow stake readings on the nearby glacier at Zugspitzplatt (Huber 1914). However, due to several displacements, data before 1946 should not be used (Hauer 1950). Nowadays, snow depth is still measured from snow stakes on the downwasting glacier at 2,600 m asl by the avalanche service and the data are passed on to DWD (personal communication Manfred Kirsten,
DWD). New snow height has never been measured on ZUG.
The Sonnblick observatory (SOB) is situated on an isolated peak (3,105 m asl) in the middle of the eastern Austrian Alps and is part of the Austrian national meteoro-logical service ZAMG operational network. Snow depth has been measured daily with binoculars since 1938 from a snow stake (PG6) at a glaciated saddle (2,990 m asl) close to the observatory. However, monthly readings from this and 4 other stakes on the nearby glaciers already started in 1928. The measurements from the stake with the daily read-ings are influenced by strong snow drift due to its location on saddle. For this analysis, we therefore used the stake PG1 at 2,400 m asl, which is well protected from wind, and shows a good representativity for the lower part of the glacier (Schöner et al.2009).
The data has been quality checked and most of the temperature and precipitation series have been homogenised by the data owners. None of the snow data has been homo-genised. However, the methods of snow measurement have not been changed at the observatories involved. In addition, the locations of the snow measurements at Weissfluhjoch and Sonnblick are still the same as at the start of the observations.
Table 1 Manual and automatic, operationally measured parame-ter at Weissfluhjoch
a
Daily values from 1947 to 1958 only in the annual reports of MeteoSwiss. Automatic since 1981
b
Measurement location has been changed in 1981 (SLF 1986)
c
Terminated in 2008
dAlso automatic since 1994 e1936–1938: Incomplete
meas-urements during the summer month (July–September)
fAlso automatic by snow pillow
since 2008
g
Physikalisch-Meteorologisches Observatorium Davos, World Radiation Center
h
Local standard time
Location/parameter Since Temp. resolution Data provider WFJ Peak, 2,690 m
Temperature 1947a 10 min MeteoSwiss Relative humidity 1947a 10 min MeteoSwiss Sun duration 1947a, b 10 min MeteoSwiss
Global radiation 1947a, b 10 min MeteoSwiss
Wind speed 1947a 10 min MeteoSwiss
Wind direction 1947a 10 min MeteoSwiss
Pressure 1947a 10 min MeteoSwiss
Synoptic weather observation 1947c 3 times daily MeteoSwiss Short- and longwave in radiation 1995 2 min SLF WFJ Observation site, 2,540 m
Snow depth 1936d Daily, 7:30 LSTh SLF New snow height 1936e Daily, 7:30 LST SLF New snow density 1942 Daily, 7:30 LST SLF Snow water equivalent 1948f Bi-weekly snow profile SLF Precipitation 1947a 10 min MeteoSwiss
Temperature 1995 10 min SLF
Relative humidity 1995 10 min SLF
Wind speed 1995 10 min SLF
Wind direction 1995 10 min SLF Shortwave in and out radiation 1995 2 min SLF Longwave in and out radiation 1995 2 min SLF
UV-A and UV_B in and out radiation 1997 2 min PMOD/WRCg
3 Results and discussion
We start with the two standard meteorological parameters temperature and precipitation. The integrated product of these two parameters determines the snowfall sum and the depth and duration of the snow on the ground, whose analysis is the focus of this investigation.
3.1 Air temperature
An analysis of the mean annual air temperature of the six mountain observatories shows a more or less parallel evo-lution since the beginning of the measurements (Fig.2). The absolute difference between the stations can mainly be explained by altitude. As the time series have not yet all been homogenised, we limited our analysis to the tempera-ture trend of the last 30 years (1981–2010). We found a surprisingly good agreement among the six stations with an increase of roughly 0.8 K over the last three decades. Since low-altitude stations show a larger spread and larger ampli-tudes regarding the recent temperature increase (1.2 to 1.4 K for the six lowest Swiss stations), these data demonstrate that high-altitude observatories are important locations for undisturbed measurements. The observed increase of 0.8 K
is 1.2 times higher than the corresponding northern hemi-sphere temperature increase (HadCRUT3 (Brohan et al.
2006)) over the last three decades. This stronger warming in the Alps is not surprising, taking into account the con-tinentality of the Alps and the fact that that the northern hemisphere temperature is a lot determined by ocean areas. As we will show later, the snow parameters experience the largest changes during the melting period (April, May, June). The observed warming of these 3 months at the mountain observatories was 2.5 K during the last three decades, which is three times larger than the annual temper-ature increase and 3.5 times larger than the corresponding northern hemisphere temperature increase. This enhanced warming in the Alps agrees well with what others have already found for homogenised air temperature series in Switzerland (Rebetez and Reinhard2008).
3.2 Precipitation
Considering the different climatic locations of the observa-tories, it is not surprising that there are remarkable differ-ences in precipitation between the stations. This becomes evident when the annual precipitation cycle is analysed. The southernmost station GSB, for example, experiences a
Mediterranean-like precipitation regime with lower amounts during the summer months. Weissfluhjoch on the other hand, is the driest station, which is typical for its inner-alpine location. All stations show a high inter-annual vari-ability, and thus, there is no trend towards wetter or drier conditions. The same is true for the new snow sum during the winter season (November to April) at Weissfluhjoch, the only high-altitude station with continuous new snow height measurements. Moreover, despite the fact that new snow density depends on the ambient temperature (Meister1986), no density increase has been detected yet. Another investi-gation demonstrates that the probability for extreme snow fall events has not significantly changed at this high-altitude location (Marty and Blanchet2011).
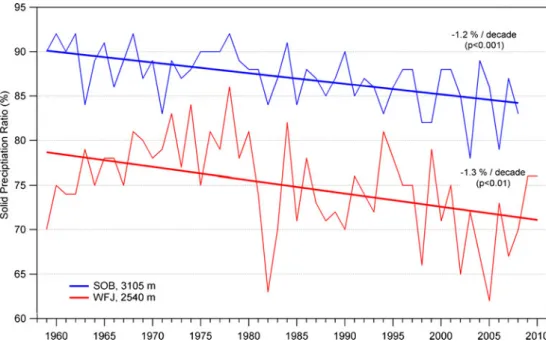
However, the situation looks different if the solid tion ratio (fraction of solid precipitation of the total precipita-tion) is analysed. Theoretically, this parameter would be available from three of the six stations. However, the data of Säntis cannot be used for this purpose since the measurement location for precipitation and new snow has changed several times in recent decades and the two parameters were also measured at different sites. At Sonnblick, the precipitation measurement is classified by the observer with either 0%, 50% or 100% solid precipitation since 1892 (Schöner et al.
2009). At Weissfluhjoch, the solid precipitation ratio was de-termined by the snowfall/precipitation day ratio as described in Serquet et al. (2011). Both methods show a clear trend towards more rain and less snow at these high altitudes. A trend analysis using the Mann–Kendall test (Mann1945; Kendall1975) and Sen’s slope estimator (Sen1968) demonstrates a highly signif-icant decrease of about 1.25% per decade at both stations (Fig. 3). The higher variability at Weissfluhjoch can be explained by the fact that it is located 600 m lower than Sonnblick and due to the different methods involved as
described above. A seasonal analysis reveals that the decrease in the solid precipitation ratio during the spring months is twice as high (2.8% per decade at Weissfluhjoch and 1.6% per decade at Sonnblick for the month April to June) as during the winter month and is thus mainly responsible for the observed annual decrease.
3.3 Snow depth
Only three mountain observatories measure snow depth each day, which allows to derive climatologically important parameters such as mean snow depth or the number of snow days (days with a snow depth above a certain threshold). However, if the analysis is limited to the beginning of each month, we can also include the long-term monthly reading from Sonnblick. We have done this for the end of the meteorological winter season (March 1), which, at this alti-tude, is still in the accumulation season. For all four stations, we found a high inter-annual variability, which is by far the lowest at Weissfluhjoch. In comparison with the other sta-tions, Weissfluhjoch also shows the lowest decadal variabil-ity (Fig.4). Only the Zugspitze measurements seem to show a long-term decreasing trend. The other three stations show no obvious sign of change with regard to the March 1 snow depth. Considering the different settings and climates of these stations, it is evident that the absolute values show larger differences between the different locations.
As the snow depth at this time of the winter is mainly determined by precipitation, we assessed the long-term compa-rability of the snow depth measurements with a simple corre-lation analysis between the May 1 snow depth and the winter (November–April) precipitation sum. We found a good agree-ment between the two parameters at Weissfluhjoch (r00.83), but substantially lower correlation coefficients (r between 0.39
Fig. 2 Mean annual air temperature at the six mountain observatories and their corresponding temperature increase during the last three decades (1981–2010). The thick lines represent 20-year Gauss-ian low-pass filter smooth trend. The ten first and last years were constructed by bouncing the raw values
and 0.65) for the three other stations. Assuming that the relative under-catch of winter precipitation (Goodison et al.1998) is similar from year to year, we explain these lower correlation coefficients with the fact that the other three sites are influenced by snow drift, which also explains the extreme values in some years. Bearing in mind that the snow measurement site at Säntis is in a depression or on a changing glacier at the two other sites (Zugspitze and Sonnblick) explains these results. The apparent long-term decreasing trend for March 1 snow depth at Zugspi-tze (without a simultaneous precipitation decrease) is therefore most likely caused by the changing topography of the measure-ment field on a downwasting glacier.
In addition, an analysis of the mean snow depth between November and April and for the date of the maximum snow depth at Säntis and Weissfluhjoch revealed no significant
changes. Another study (Marty and Blanchet 2011) also demonstrated that the magnitude of the maximum snow depth is not changing at higher altitudes. However, there is a trend towards less snow at the end of the snow season (see Sections3.4and3.6).
3.4 Snow onset and snow disappearance dates
Snow onset (the date when the winter snow cover starts to accumulate) and snow disappearance (the date when the winter snow cover disappears, i.e. the measurement field is less than 50% snow covered) could only be analysed for the two data series on non-glaciated terrain (Säntis and Weissfluhjoch), since it is often impossible to distinguish between the present and past year’s snow during the melt season on a glacier. In the melt
Fig. 4 Annual values of snow depth for March 1. The thick lines represent the 20-year Gaussian low-pass filtered values
Fig. 3 Annual values of solid precipitation ratio as measured at Sonnblick and Weissfluhjoch and their corresponding decrease per decade
season, the date of first disappearance of 50 cm snow depth, the date of first disappearance of 10 cm snow depth or the date of snow disappearance all show a clear decreasing trend since the 1980s, with a series of unusually early snow disappearance dates in the last 15 years for both stations (Fig.5). However, the trend is not significant (p00.25) if the whole Weissfluhjoch series is considered. The record snow disappearance date, for example, occurred at the beginning of the observation period— in early June 1947. The succeeding dry and hot summer is often compared with summer heat of 2003. No trend can be ob-served, if the snow onset date is analysed. This is not surprising, considering the fact that the inter-annual variability (expressed by the coefficient of variation) of the snow onset date for both stations is higher than that for the snow disappearance date and knowing that the months during snow onset (September to November) show the smallest temperature increase of all sea-sons (Rebetez and Reinhard2008).
3.5 Snow water equivalent
Snow water equivalent is only measured bi-weekly at Weissfluhjoch. As could be expected, long-term trend of snow water equivalent is similar to that of the snow depth. There is no change in the April 1 measurements, but there is a decreasing trend in the June 1 measurements. Again, the trend is only significant for the last 30 years. Values before 1948 have been parameterized based on the available snow depth measurements and the corresponding bi-weekly den-sity values according to Jonas et al. (2009).
3.6 Summer snow
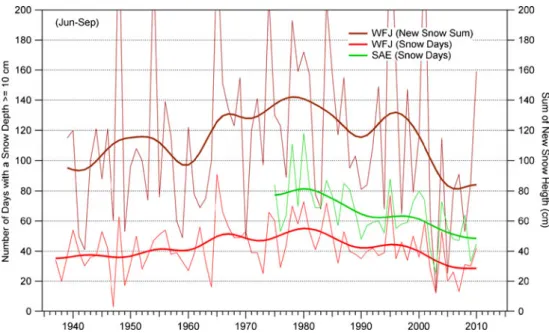
If we analyse the months June to September, it becomes evident that the new snow sum or snow days with at least
10 cm of snow depth have also been decreasing during the last three decades (Fig. 6). The new snow sum even reached unprecedented low values in the last decade. For snow days, a threshold of 10 cm has been chosen in order to guarantee that the snow was still detectable at Säntis, where it is read with binoculars. The snow days at Zugspitze have not been con-sidered here, for the same reason as described in Section3.3. 3.7 Spatio–climatological representativity of Weissfluhjoch Over the years, many of the experiments mentioned in the introduction complemented each other and enhanced the scientific value of the measurements at this high-altitude site. Many of these studies also demonstrated that the Weissfluhjoch site is an ideal location for snow investigations due to its homogeneous snow cover (Meister
1983) and undisturbed environment. Nevertheless, the question still arises as to how well the Weissfluhjoch site represents the mean snow cover at about 2,500 m asl in the Swiss Alps. This question is in general difficult to answer due to the complex topography and thus het-erogeneous snow distribution in the Alps. A recent study shows that flatfield observations often register too much snow in comparison with the same altitude band in the whole catchment area (Gruenewald and Lehning 2011). Nevertheless, we can analyse how the snow depth from the flat observation site at Weissfluhjoch compares to the flat measurement sites of the recently established auto-matic IMIS network. Due to the different environments and regional climates the IMIS stations are in, it is obvious that the evolution of the daily snow depth shows a high inter-station variability (Fig. 7). A comparison between the mean of the 12-year mean daily snow depth of the IMIS stations and the snow depth at Weissfluhjoch
Fig. 5 Annual snow onset and disappearance dates at Säntis and Weissfluhjoch. The thick lines represent the 20-year Gaussian low-pass filtered values
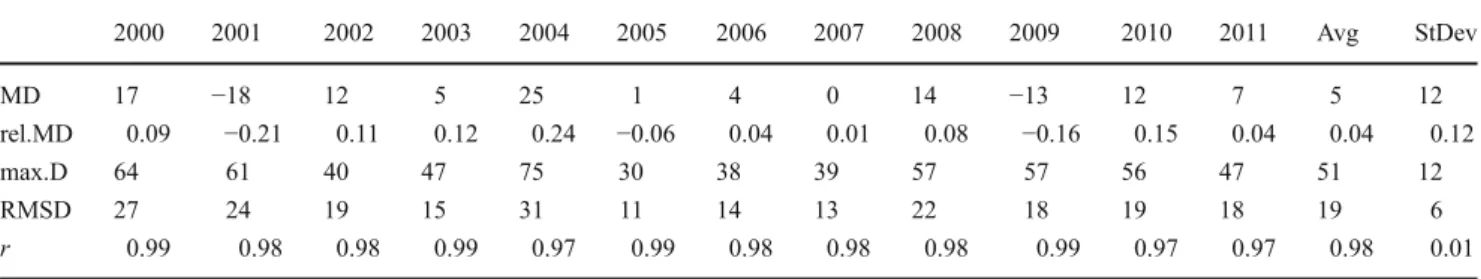
reveals a high similarity. Weissfluhjoch generally has a little more snow, but both datasets display maximum snow depth in mid-April. The largest differences (about 20 cm) are observed during the melt season (May–June), and the other differences are generally less than 10 cm. The differences in July are caused by the fact that many of the IMIS stations are on grassy terrain and thus register grass growth after snow melt. Interestingly, the individual years reveal also a good agreement between Weissfluhjoch and the mean of the IMIS stations (Table2). In
a next step, we analysed how well the inter-annual variability and the corresponding changes during the last 12 years at the IMIS stations throughout the Swiss Alps are represented at Weissfluhjoch. An examination of the mean snow depth be-tween November and May also revealed an unexpectedly good agreement with a root mean-squared difference of only 13 cm and a correlation coefficient of 0.82 between these two datasets (Fig.8).
We explain these good agreements by the fact that Weissfluhjoch, although clearly located on the northern
Fig. 6 Sum of new snow height (brown) and the number of days with a snow depth of at least 10 cm (green and red) during summer month (June–September). The thick lines represent the 20-year Gaussian low-pass filtered values
Fig. 7 Mean (2000–2011) evolution of snow depth at Weissfluhjoch (2,540 m asl) and the average of the 51 IMIS stations with a median altitude of 2,405 m asl. Each of the thin lines represents one of these automatic stations
side of the Alpine crest, is not sensitive to extreme precipitation systems from one or the other side of the Alps due to its position in the centre of the Alps. An analysis of the spatial distribution of extreme snowfall events in Switzerland corroborates this hypothesis (Blanchet et al. 2009). Moreover, during a winter sea-son, Weissfluhjoch is often affected by some precipita-tion from the north and some from the south. Nevertheless, it is still surprising that even special win-ters such as 2001 (Nov 2000 to May 2001) with anom-alously high snow amounts in the southern Alps do not cause a higher bias for that year. The only explanation we have is that the southern side of the Swiss Alps covers a smaller area and that there are far less IMIS stations there than at the northern side. A mean snow depth for the whole Swiss Alps will therefore always be heavily influenced by the snow cover on the northern
side, due to its larger area and better station coverage. The fact that Weissfluhjoch is in eastern Switzerland does not seem to matter, as there is almost no west– east pattern regarding the snow depth at the winter scale (Scherrer and Appenzeller 2006).
4 Conclusions
We have shown that regarding data homogeneity, Weiss-fluhjoch is an ideal site for snow and precipitation measure-ments at high altitude in the Alps. Moreover, we could demonstrate that the snow measurements at the Weissfluh-joch observation site are not only spatially representative for the entire Swiss Alps with regard to the evolution and inter-annual variability, but also on the daily time scale. None-theless, there are other mountain observatories with longer
Table 2 Mean difference (MD), relative mean difference (rel.MD), maximum difference (maxD), root mean-squared difference (RMSD) and Pearson’s correlation coefficient (r) between Weissfluhjoch and the 51 IMIS stations for the individual years
2000 2001 2002 2003 2004 2005 2006 2007 2008 2009 2010 2011 Avg StDev MD 17 −18 12 5 25 1 4 0 14 −13 12 7 5 12 rel.MD 0.09 −0.21 0.11 0.12 0.24 −0.06 0.04 0.01 0.08 −0.16 0.15 0.04 0.04 0.12 max.D 64 61 40 47 75 30 38 39 57 57 56 47 51 12 RMSD 27 24 19 15 31 11 14 13 22 18 19 18 19 6 r 0.99 0.98 0.98 0.99 0.97 0.99 0.98 0.98 0.98 0.99 0.97 0.97 0.98 0.01 Average and standard deviation of these parameters over the 12 investigated years are given in the last two columns
Fig. 8 Mean daily snow depth between November and May at Weissfluhjoch (2,540 m asl) and the average of the 51 IMIS stations with a median altitude of 2,405 m asl. The vertical bars represent the standard deviation of the daily means at the automatic stations
time series for standard meteorological parameters such as temperature or precipitation. To our knowledge, Weissfluhjoch is the only high-altitude mountain station worldwide with such long-term daily year-round snow and weather observations. These uninterrupted series are now a unique resource for the investigation of snow climate-related questions in an undis-turbed high-altitude environment. The long-term climatologi-cal snow series can hardly be compared to the few other alpine mountain observatories at similar altitudes because snow is either not measured at all or the measurements are heavily influenced by snow drift or changing topography due to their location on shrinking glaciers.
Regarding air temperature, the results of the last three decades show a parallel warming of about 0.8°C at all six mountain observatories analysed. Such a uniform warming, which has not been observed at low-altitude stations strong-ly indicates that temperature measurements on mountain peaks, away from urbanisation and topographic effects, provide an unbiased record of the global temperature. This climate change-induced warming has an effect on the snow cover, as has been shown in earlier studies (e.g. Marty2008; Scherrer et al.2004). Most of these studies focused on low and mid-altitude stations due to the sparse long-term meas-urements at high altitudes. Our results demonstrate that at high altitudes, snow depth, snow water equivalent, new snow amount or new snow density are not undergoing changes in mid-winter yet despite the observed warming. This is due to the fact that the mean winter temperatures at the investigated mountain observatories are still cold enough to largely prevent snow melt and that the large majority of precipitation still falls as snow. However, to-wards the end of the snow season (i.e. May–July at about 2,500 m asl), when mean temperatures fluctuate around 0, the additional warming of 2.5°C in last three decades caused enhanced melting and more rain events. As a result, a more rapidly decreasing snow depth (and snow water equivalent) and therefore an earlier snow disappearance date during the last three decades, can be observed. Looking at the whole time series of the last 75 years, these changes are, however, not significant. The solid precipitation ratio is the only parameter which reveals a significant decrease even at this high altitude. This trend towards more liquid precipitation, especially during melt season, is responsible for the decreas-ing new snow amounts and thus for the decreasdecreas-ing number of snow days during the summer months. Moreover, this reduction of summer snow days is mainly responsible for the shrinking Alpine glaciers (Zemp et al.2006; Huss et al.
2008), which are thus not insulated from the summer heat. Long-term data from mountain observatories are not only helpful to characterise present and past climatological fea-tures in high-alpine environments, but also provide useful information for the climate modelling community. Thus, monitoring activities at mountain observatories are an
indispensable source to answer current climatological and environmental questions. The harsh conditions at mountain stations or the lack of appropriate sensors often require human presence. However, the continuity of such long-term observations is endangered worldwide for financial reasons. Unfortunately, some of these unique mountain observations have already been discontinued in recent years. An initiative of WMO’s Global Cryosphere Watch programme (IGOS 2007), which among others plans to establish cryospheric reference sites at high altitudes, will hopefully help to maintain the remaining observatories.
Acknowledgements We are grateful that the National Weather Serv-ices of Austria (ZAMG), Germany (DWD), and Switzerland (MeteoS-wiss) have maintained their long-term mountain observatories and thank them for providing the data and metadata for this analysis. We also thank Charles Fierz for sharing his knowledge about the measure-ments at Weissfluhjoch and Marcia Phillips for polishing the English.
References
Bader H, Neher J, Niggli P (1939) Der Schnee und seine Metamor-phose: Erste Ergebnisse und Anwendungen einer systematischen Untersuchung der alpinen Winterschneedecke; durchgefuehrt von der Station Weissfluhjoch-Davos der Schweiz. Schnee- u. Law-inenforschungskommission 1934–1938. Kuemmerly u. Frey Baltensperger U, Schwikowski M, Gaggeler HW, Jost DT, Beer J,
Siegenthaler U, Wagenbach D, Hofmann HJ, Synal HA (1993) Transfer of atmospheric constituents into an alpine snow field. Atmos Environ - Part A Gen Top 27 A(12):1881–1890 Bavay M, Lehning M, Jonas T, Löwe H (2009) Simulations of future
snow cover and discharge in Alpine headwater catchments. Hydrol Processes 23(1):95–108. doi:10.1002/hyp.7195
Blanchet J, Marty C, Lehning M (2009) Extreme value statistics of snowfall in the Swiss Alpine region. Water Resour Res 45:12. doi:10.1029/2009wr007916
Bossolasco M (1954) Schneefall und Lufttemperatur. Experientia 10 (9):365–366
Brohan P, Kennedy JJ, Harris I, Tett SFB, Jones PD (2006) Uncertainty estimates in regional and global observed temperature changes: A new data set from 1850. Journal of Geophysical Research-Atmospheres 111 (D12)
Brown R, Bartlett P, MacKay M, Verseghy D (2006) Evaluation of snow cover in CLASS for SnowMIP. Atmosphere-Ocean 44 (3):223–238
Coen DR (2009) The storm lab: meteorology in the Austrian alps. Sci Context 22(3):463–486
De Quervain M (1951) Zur Verdunstung der Schneedecke. Theor Appl Climatol 3(1):47–64. doi:10.1007/bf02242590
Egli L (2008) Spatial variability of new snow amounts derived from a dense network of Alpine automatic stations. Ann Glaciol 49:51–55 Egli L, Jonas T, Meister R (2009) Comparison of different automatic methods for estimating snow water equivalent. Cold Reg Sci Tech 57(2–3):107–115. doi:10.1016/j.coldregions.2009.02.008
Fierz C, Pluss C, Martin E (1997) Modelling the snow cover in a complex Alpine topography. Ann Glaciol 25:312–316
Goodison BE, Louie PYT, Yang D (1998) WMO Solid Precipitation Measurement Intercomparison. Instruments and Observing Meth-ods, vol 76. WMO, Geneva
Gruenewald T, Lehning M (2011) Altitudinal dependency of snow amounts in two small alpine catchments: can catchment-wide
snow amounts be estimated via single snow or precipitation stations? Ann Glaciol 52(58):153–158
Gubler H, Hiller M (1984) The use of microwave FMCW radar in snow and avalanche research. Cold Reg Sci Tech 9(2):109–119 Hauer H (1950) Klima und Wetter der Zugspitze - 50 Jahre
meteor-ologische Beobachtungen des Observatoriums Zugspitze, vol 16. Berichte des Deutschen Wetterdienstes in der US-Zone. Bad Kissingen
Huber A (1914) Das Klima der Zugspitze. Druck von E. Mühlthaler, München
Huss M, Bauder A, Funk M, Hock R (2008) Determination of the seasonal mass balance of four Alpine glaciers since 1865. J Geo-phys Res 113(F1):F01015. doi:10.1029/2007jf000803
Huss M, Funk M, Ohmura A (2009) Strong Alpine glacier melt in the 1940s due to enhanced solar radiation. Geophys Res Lett 36(23): L23501. doi:10.1029/2009gl040789
IGOS (2007) Integrated Global Observing Strategy Cryosphere Theme Report—for the monitoring of our environment from space and from earth. WMO/TD-No. 1405. WMO, Geneva
Jonas T, Marty C, Magnusson J (2009) Estimating the snow water equivalent from snow depth measurements in the Swiss Alps. J Hydrol 378:161–167
Kendall MG (1975) Rank correlation methods, 4th edn. Charles Griffin, London
List R, de Quervain M (1953) Zur Struktur von Hagelkörnern. ZAMP Zeitschrift für angewandte Mathematik und Physik 4 (6):492–496
Luetschg M, Stoeckli V, Lehning M, Haeberli W, Ammann W (2004) Temperatures in two boreholes at Flüela Pass, Eastern Swiss Alps: the effect of snow redistribution on permafrost distribution pat-terns in high mountain areas. Permafr Periglac Process 15(3):283– 297. doi:10.1002/ppp.500
Mann HB (1945) Non parametric test against trend. Econometrica 13 Martinec J, Rango A (1981) Areal distribution of snow water equiva-lent evaluated by snow cover monitoring. Water Resour Res 17 (5):1480–1488. doi:10.1029/WR017i005p01480
Marty C (2008) Regime shift of snow days in Switzerland. Geophys Res Lett 35. doi:10.1029/2008GL033998
Marty C, Blanchet J (2011) Long-term changes in annual maximum snow depth and snowfall in Switzerland based on extreme value statistics. Climatic Change 1–17. doi:10.1007/s10584-011-0159-9
Marty C, Philipona R, Frohlich C, Ohmura A (2002) Altitude depen-dence of surface radiation fluxes and cloud forcing in the Alps: results from the Alpine Surface Radiation Budget network. Theor Appl Climatol 72(3–4):137–155
Meister R (1983) Ermittlung der Schneehöhenverteilung mit Hilfe der Photogrammetrie. Schnee und Lawinen im Winter 1981/1982, vol 46. SLF, Davos-Weissfluhjoch
Meister R (1986) Density of new snow and its dependence on air temperature and wind. In: GIETHZ (ed) Wokshop on the Correc-tion of PrecipitaCorrec-tion Measurements, Zürich, 1985
Meister R (2009) Snow profiling at Weissfluhjoch. In: Schweizer J, (SLF) (ed) International snow science workshop, Davos, 2009
Pielmeier C, Schneebeli M, Stucki T (2001) Snow texture: a compar-ison of empirical versus simulated texture index for Alpine snow. Ann Glaciol 32:7–13
Pluess C, Ohmura A (1997) Longwave radiation on snow-covered mountainous surfaces. J Appl Meteorol 36(6):818–824. doi:10.1175/1520-0450-36.6.818
Rebetez M, Reinhard M (2008) Monthly air temperature trends in Switzerland 1901–2000 and 1975–2004. Theor Appl Climatol 91(1):27–34
Scherrer SC, Appenzeller C (2006) Swiss Alpine snow pack variabil-ity: major patterns and links to local climate and large-scale flow. Clim Res 32(3):187–199
Scherrer SC, Appenzeller C, Laternser M (2004) Trends in Swiss Alpine snow days: the role of local- and large-scale climate variability. Geophys Res Lett 31. doi:10.1029/2004GL020255
Schild M (1949) Schneehöhen: Der Einfluss der Meereshöhe. Schnee und Lawinen im Winter 1946/47, vol 11. Davos-Weissfluhjoch Schmucki DA, Philipona R (2002) Ultraviolet radiation in the Alps: the
altitude effect. Opt Eng 41(12):3090–3095. doi:10.1117/1.1516820
Schöner W, Auer I, Boehm R (2009) Long term trend of snow depth at Sonnblick (Austrian Alps) and its relation to climate change. Hydrol Processes 23(7):1052–1063
Seidel K, Brusch W, Steinmeier C Experiences from real time runoff forecasts by snow cover remote sensing. In: Geoscience and Remote Sensing Symposium, 1994. IGARSS’94. Surface and Atmospheric Remote Sensing: Technologies, Data Analysis and Interpretation., International, 8–12 Aug 1994 1994. pp 2090– 2093 vol.2094
Sen PK (1968) Estimates of the regression coefficient based on Kendall’s tau. J Am Stat Assoc 63:1379–1389
Serquet G, Marty C, Dulex J-P, Rebetez M (2011) Seasonal trends and temperature dependence of the snowfall/precipitation-day ratio in Switzerland. Geophys Res Lett 38(7):L07703. doi:10.1029/ 2011gl046976
Stichler W, Rauert W, Martinec J (1981) Environmental isotope studies of an alpine snowpack (Weissfluhsoch Switzerland). Nord Hydrol 12(4–5):297–308
Werner C, Wiesmann A, Strozzi T, Schneebeli M, Matzler C The snowscat ground-based polarimetric scatterometer: Calibration and initial measurements from Davos Switzerland. In: Geoscience and Remote Sensing Symposium (IGARSS), 2010 IEEE Interna-tional, 25–30 July 2010 2010. pp 2363–2366
Zemp M, Haeberli W, Hoelzle M, Paul F (2006) Alpine glaciers to disappear within decades? Geophys Res Lett 33(13)
Zhu XH, Ding GH, Levy W, Jakobi G, Offenthaler I, Moche W, Weiss P, Schramm KW (2011) QSPR study about sampling rates of semipermeable membrane devices for monitoring of organochlo-rine pesticides in Alps air. Chin Sci Bull 56(18):1884–1889 Zingg T (1954) Die Bestimmung der klimatischen Schneegrenze auf
klimatologischer Grundlage. Mitteilungen des Eidg. Institutes für Schnee- und Lawinenforschung, vol 12
Zingg T (1963) Übersicht über die Schneeverhältnisse in der Schweiz. II. Teil: Neuschneeverhältnisse. Schnee und Lawinen im Winter 1961/62, vol 26. Davos-Weissfluhjoch