Metabolic £ux response to phosphoglucose isomerase knock-out in
Escherichia coli and impact of overexpression of the soluble
transhydrogenase UdhA
Fabrizio Canonaco
a, Tracy A. Hess
b, Sylvia Heri
a, Taotao Wang
b,
Thomas Szyperski
b, Uwe Sauer
a;*
a Institute of Biotechnology, ETH Zu«rich, CH-8093 Zurich, Switzerland
b Department of Chemistry, University at Bu¡alo, The State University of New York, Bu¡alo, NY 14260, USA
Received 16 May 2001; received in revised form 22 August 2001; accepted 23 August 2001 First published online 5 October 2001
Abstract
Blocking glycolytic breakdown of glucose by inactivation of phosphoglucose isomerase (Pgi) in Escherichia coli led to a greatly reduced maximum specific growth rate. Examination of the operational catabolic pathways and their flux ratios using [U-13C6]glucose-labeling experiments and metabolic flux ratio analysis provide evidence for the pentose phosphate (PP) pathway as the primary route of glucose catabolism in the knock-out mutant. The resulting extensive flux through the PP pathway disturbs apparently the reducing power balance, since overexpression of the recently identified soluble transhydrogenase UdhA improves significantly the growth rate of the Pgi mutant. The presented results provide first evidence that UdhA restores the cellular redox balance by catalyzing electron transfer from NADPH to NADH. ß 2001 Federation of European Microbiological Societies. Published by Elsevier Science B.V. All rights reserved.
Keywords: Fluxome; Metabolism; Metabolic £ux ratio analysis; NADPH; Phosphoglucose isomerase; Transhydrogenase
1. Introduction
By providing energy, building blocks, and co-factors, central carbon metabolism constitutes the biochemical backbone of all cells. Nevertheless, our understanding of systemic properties of the central metabolic network lacks behind the accumulated wealth of detailed biochemical and genetic knowledge on its individual components. One reason is the redundancy of this complex network, in the sense that more than one reaction or pathway cata-lyze a given conversion of intermediates. Thus, ¢rm con-clusions on metabolic consequences of genetic manipula-tions can often not be drawn on the basis of physiological characterization only [1]. When based on isotopic tracer data, however, methods of metabolic £ux analysis can potentially distinguish between alternative pathways [2^4]. One approach is based on tracing intact carbon frag-ments in cells grown on mixtures of uniformly [U-13C
6]
and unlabeled glucose [5,6]. The resulting13C-labeling
pat-terns of metabolic intermediates are analyzed by nuclear magnetic resonance (NMR) spectroscopy of amino acids that are synthesized from these intermediates. Because al-ternative pathways that lead to common intermediates or products yield di¡erent intact fragments that originate from a single glucose source molecule, speci¢c multiplet patterns in the 13C ¢ne structures that re£ect the in vivo
usage of reactions are generated. Probabilistic equations relate the determined intensities of the multiplet compo-nents to the relative abundance of intact carbon fragments [5]. Thus, this method, also referred to as metabolic £ux ratio (METAFoR) analysis, identi¢es the active metabolic pathways and the ratios of their £uxes during a labeling experiment [5^9].
Here we use METAFoR analysis by NMR to investi-gate the metabolic consequences of phosphoglucose iso-merase (Pgi) inactivation in Escherichia coli. Since Pgi is located at the ¢rst juncture of di¡erent pathways for glu-cose catabolism (Fig. 1), its inactivation is particularly useful for studying general metabolic network behavior because glucose catabolism must then proceed via the pen-tose phosphate (PP) and/or the Entner^Doudoro¡ (ED)
* Corresponding author. Tel.: +41 (1) 633 36 72; Fax: +41 (1) 633 10 51.
E-mail address: sauer@biotech.biol.ethz.ch (U. Sauer).
2. Materials and methods
2.1. Strains and growth conditions
Here we used the two E. coli strains wild-type MG1655 (V3, F3, rph-1) and a Pgi mutant (V3, F3, IN(rrnD^
rrnE)1, rph-1, pgi: :Tn10) (a gift of G. Sprenger, Biotech-nology, Forschungszentrum Julich, Germany) that was constructed by P1 phage transduction of the pgi^Tn10 marker [11] into W3110. Luria^Bertani (LB) and M9 min-imal medium were prepared as described previously [9]. M9 medium was supplemented with either glucose or fruc-tose at a ¢nal concentration of 0.5% (w/v). Aerobic culti-vation was performed in 1-l ba¥ed shake £asks with max-imally 150 ml medium at 30³C on a gyratory shaker at 200 rpm.
For 13C-labeling experiments, cultures were grown in
M9 medium with 0.45% (w/v) unlabeled glucose and 0.05% (w/v) uniformly labeled [U-13C
6]glucose
(13C s 98%, Isotech). In these cases, the inoculum volume
was well below 1% of the culture volume, so that the presence of unlabeled biomass could be neglected for the analysis of the 13C-labeling patterns. These cultures were
always harvested in the mid-exponential growth phase at an optical density at 600 nm (OD600) of about 1.
2.2. Analytical procedures
Cell growth was monitored by determination of OD600
and cellular dry weight (cdw) was calculated from previ-ously determined OD600-to-cdw correlations. Glucose,
ace-tate, and protein concentrations were determined with commercial kits (Beckman) or by high-performance liquid chromatography (HPLC). Physiological parameters were calculated as described previously [9].
To prepare crude cell extracts, LB-grown cultures were washed and resuspended in one volume 0.9% (w/v) NaCl, 10 mM MgSO4, and disrupted by two sonication steps at
100 W for 1 min each. After centrifugation at 10 000Ug for 30 min, the supernatant was transferred to a new tube and used directly for determination of protein concentra-tion and enzyme activities. Speci¢c activities of Pgi [12] and transhydrogenase [13,14] were determined as
de-2.3. NMR spectroscopy and data analysis
Preparation of protein hydrolysates and recording of 2D 13C^1H correlation NMR spectra for aliphatic and
aromatic amino acid resonances were performed as de-scribed previously [5,9]. The program FCAL [6,16] was used for integration of13C^13C scalar coupling ¢ne
struc-tures and the calculation of relative abundances, f, of in-tact carbon fragments originating from a single source molecule of glucose [5]. Brie£y, these f values were calcu-lated with probabilistic equations from the relative inten-sities, I, of the superimposed multiplets in the 13C^13C
scalar coupling ¢ne structures of resonances in 48 carbon atoms of the amino acids. The f values in amino acids carbon atoms provide then information on the metabolic origin of their precursors molecules in central metabolism, i.e. P5P, E4P, PGA, PEP, PYR, OGA, and OAA [5]. 2.4. Genetic manipulations
Inducible overexpression of the soluble transhydroge-nase UdhA [17] was achieved by PCR ampli¢cation of udhA from chromosomal DNA of E. coli MG1655 with the primers 5P-CGGGATCCGA TGCCATAGTA ATA-GG-3P and 5P-CCCAAGCTTT TTTAAAACAG GCGG-TT-3P (chromosomal sequences are underlined). The re-sulting PCR product was digested with BamHI and HindIII and cloned under the control of the IPTG-induc-ible trc promoter of pTrc99A (Pharmacia).
3. Results and discussion 3.1. Phenotypic characterization
Pgi enzyme activities of 966 þ 5 and 5 þ 5 U mg31
pro-tein in crude cell extracts from control and mutant batch cultures, respectively, proved complete absence of Pgi ac-tivity in the mutant. Under aerobic conditions, mutant cultures grew well on fructose as the sole carbon source with a maximum speci¢c growth rate (Wmax) of 0.40 h31, as
was reported previously [12]. This indicates that G6P is not an essential component of E. coli biomass because it cannot be synthesized from fructose in pgi3 mutants.
Pro-viding glucose as the sole carbon source, the Pgi mutant grew signi¢cantly slower and consumed less glucose (Table 1). The biomass yield of the Pgi mutant on glucose, how-ever, was slightly improved when compared with the wild-type, which is consistent with previous observations [12]. This indicates a kinetic limitation of glucose catabolism, which is supported by the complete absence of the meta-bolic over£ow product, acetate (data not shown). 3.2. Metabolic £ux response to pgi knock-out
To investigate metabolic consequences of blocking the
¢rst step of glycolysis, E. coli wild-type and the Pgi mutant were subjected to a [U-13C
6]glucose-labeling experiment in
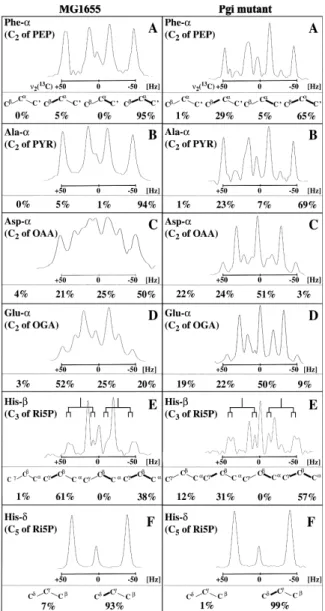
batch culture. Visual inspection of the resulting 13C^13C
scalar coupling ¢ne structures in the amino acids immedi-ately revealed several striking di¡erences between wild-type and mutant (Fig. 2). Using probabilistic equations (METAFoR analysis), these ¢ne structures were then quantitatively analyzed and then recruited to derive METAFoRs [5,6].
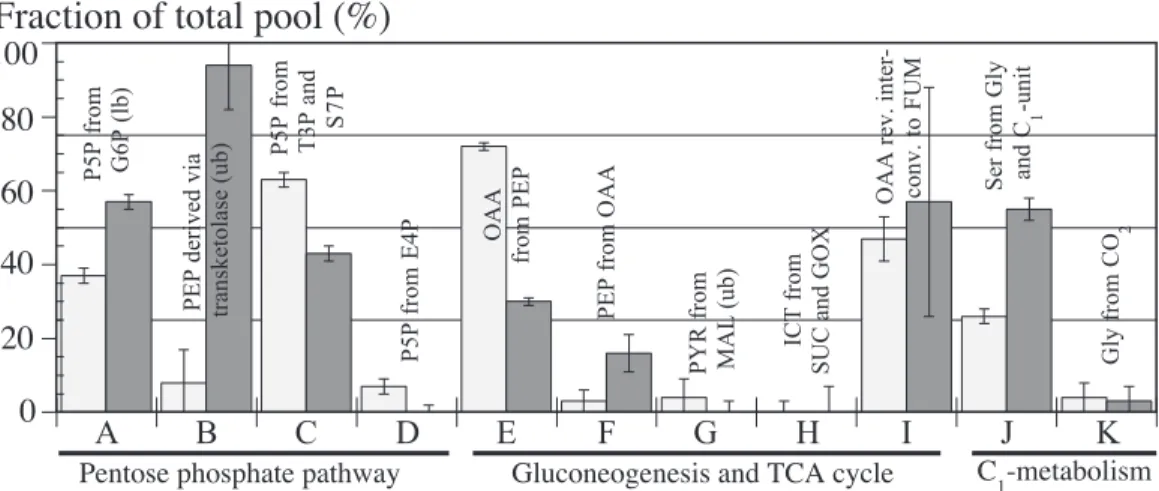
The ratios obtained for MG1655 (Fig. 3) were very sim-ilar to those reported for E. coli JM101 when grown under the identical conditions [9]. In accordance with textbook knowledge [10], the glyoxylate shunt (Fig. 3H) and the gluconeogenic reactions catalyzed by PckA and MaeA/B (Fig. 3F,G) were inactive during aerobic exponential growth on glucose. The only signi¢cant di¡erence between MG1655 and JM101 was the relative £ux through the anaplerotic Ppc reaction, 72% (Fig. 3E) and 45% [9], re-spectively. The comparably high value of MG1655 dem-onstrates that it uses the trichloroacetic acid (TCA) cycle predominantly for generating the building blocks OAA and OGA, and to a lesser extent for generating ATP via oxidative phosphorylation. E. coli JM101, on the other
Fig. 1. Reaction network of E. coli central carbon metabolism. The arrows indicate physiological reaction directionality and key enzymes are indicated by their three-letter code in the gray ellipses. Abbreviations: G6P, glucose-6-phosphate; F6P, fructose-6-phosphate; 6PG, 6-phosphogluconate; KDPG, 2-keto-3-deoxy 6PG; P5P, pentose-5-phosphate; E4P, erythrose-4-phosphate; S7P, seduheptulose-7-phosphate; GAP, glyceraldehyde-3-phosphate; DAP, dihydroxy acetone-phosphate; PGA, 3-phosphoglycerate; SER, serine; GLY, glycine; PEP, phosphoenolpyruvate; PYR, pyruvate; ACoA, acetyl coen-zyme A; CIT, citrate; ICT, isocitrate; OGA, oxoglutarate; SUC, succinate; FUM, fumarate; MAL, malate; OAA, oxaloacetate; GOX, glyoxylate; Eda, KDPG aldolase; Edd, 6-phosphogluconate dehydratase; Ppc, PEP carboxylase; PckA, PEP carboxykinase; Mdh, malate dehydrogenase; MaeA, NAD-linked malic enzyme; MaeB, NADP-linked malic enzyme; transhydrogenase, pyridine nucleotide transhydrogenase; Zwf, G6P dehydrogenase.
Table 1
Exponential growth parameters of aerobic E. coli cultures with glucose as the sole carbon source
Parameter Wild-type Pgi mutant Wmax (h31) 0.74 þ 0.02a 0.16 þ 0.01
qglc(g g31h31)b 2.4 þ 0.1 1.1 þ 0.1
YX=S (g g31)c 0.46 þ 0.03 0.54 þ 0.02 aStandard deviation from triplicate experiments.
bSpeci¢c glucose consumption rate.
hand, exhibited a more balanced TCA cycle use for build-ing block synthesis and energy generation [9].
The METAFoR data of the Pgi mutant di¡ered signi¢-cantly from those of the wild-type, most pronounced for the £ux ratios that are related to the PP pathway (Fig. 3A^D). Most telling is the upper bound of the fraction of PEP molecules that were derived through at least one
response to Pgi inactivation appears to be the £ux rerout-ing via the PP pathway. METAFoR analysis by NMR, however, provides an upper bound for the fraction of PEP molecules that were derived via transketolase, and we thus cannot exclude residual glucose catabolism via the ED pathway based on the labeling data [5]. In fact, ED path-way in vitro activity (conversion of 6PG to PYR) was identically low in glucose-grown cultures of both strains (1.2 þ 0.1 U mg31 protein). Hence, we conclude that the
ED pathway likely catalyzes a minor fraction of glucose catabolism in both wild-type and mutant strain. Conse-quently, the physiological consequences of PP pathway £ux rerouting due to a Pgi knock-out is apparently man-ifested in signi¢cantly reduced speci¢c growth and glucose-uptake rates, and thus a kinetic limitation of glucose ca-tabolism.
3.3. UdhA overexpression increasesWmax of the Pgi mutant
Kinetic limitations of catabolism might be due to (i) the di¤culty of E. coli metabolism to reoxidize NADPH, (ii) the inability of the PP pathway to support higher £uxes, or (iii) the inhibition of one or more essential reactions by accumulation of metabolites. Since we have no evidence for the latter possibility (iii) from HPLC analysis of cul-ture supernatants, the ¢rst two possibilities appear more likely. Reoxidation of NADPH can potentially be achieved by three reactions in E. coli: (i) the NADPH-dependent malic enzyme (either via back£ux through the NADH-dependent malic enzyme or via a futile cycle from PYR via MAL, OAA, and PEP to PYR); (ii) the mem-brane-bound transhydrogenase PntAB [18]; and (iii) the soluble transhydrogenase UdhA [17] (Fig. 1). Signi¢cant involvement of the malic enzyme can be excluded because virtually no PYR originates from MAL (Fig. 3G), and only a small fraction of PEP originates from OAA (Fig. 3F). Similarly, PntAB is unlikely to catalyze su¤cient re-oxidation of NADPH because pgi3 pntAB3 double
mu-tants grow as slowly as the pgi3 mutant [19], i.e. the
addi-tional knock-out of PntAB does not further reduce the rate of glucose catabolism, which would be expected if reoxidation through PntAB would play an important role. The primary metabolic function of PntAB appears to be in the generation of NADPH because zwf3 pnt3
Fig. 2.13C scalar coupling ¢ne structures observed for fractionally 13
C-labeled amino acids obtained from wild-type E. coli MG1655 (left) and the Pgi mutant (right). A: Phenylalanine CK; B: alanine CK; C:
aspar-tate CK; D: glutamate CK; E: histidine CL; and F: histidine CN. The
carbon atoms are derived from the metabolic intermediates given in the panels. In each panel, the relative abundances of the di¡erent carbon fragments shown in (A) are indicated, where carbon^carbon bonds that remained intact during amino acid biosynthesis from glucose are shown in bold. E: The doublet of doublets arising from13CQ^13CL^13CKis
fur-ther split by the two-bond scalar coupling 2J
CLCN, which reveals the
presence of intact C5-fragments originating from a single source
mole-cule of glucose in ribose, which arise from the action of the oxidative branch of the PP pathway [5,8]. The relative abundancies were calcu-lated as described [3,5] and served to determine the biosynthetic origin of metabolic intermediates (Fig. 3).
mutants grow slower than a zwf3 mutant [19], as is
ex-pected when PntAB produces NADPH in the absence of PP-pathway £uxes (in the zwf mutant).
To verify that insu¤cient reoxidation of NADPH is relevant for the kinetic limitation of glucose catabolism in Pgi mutants, we thus overexpressed the soluble trans-hydrogenase UdhA in both wild-type and Pgi mutant. The IPTG-induced expression level was chosen such that two-to three-fold increased transhydrogenase activity was achieved, when compared to controls of the same strain that were transformed with the empty pTrc99a and sub-jected to the same IPTG concentration. While this mod-erate overexpression had no e¡ect on Wmax of the
wild-type, Wmax of the Pgi mutant was increased by about
25% (from 0.22 þ 0.00 to 0.27 þ 0.01 h31). This observation
provides the ¢rst evidence for a physiological role of the soluble transhydrogenase UdhA in the reoxidation of NADPH. A further increase in UdhA overexpression to a transhydrogenase activity about 10-fold the control ac-tivity did not lead to a further increase in Wmax (data not
shown). Thus, growth of the Pgi mutant cannot be re-stored fully to wild-type rates by further improving the capacity for NADPH reoxidation. This suggests that re-duced growth of the Pgi mutant is caused by both the increased demand for NADPH reoxidation and the lim-ited capacity of the PP pathway.
Acknowledgements
We are grateful to G. Sprenger for sharing the Pgi mutant with us. T.S. is indebted to the University at Buf-falo, The State University of New York, for a start-up fund.
References
[1] Fraenkel, D.G. and Vinopal, R.T. (1973) Carbohydrate metabolism in bacteria. Annu. Rev. Microbiol. 27, 69^100.
[2] Wiechert, W. (2001)13C metabolic £ux analysis. Metab. Eng. 3, 195^
206.
[3] Szyperski, T. (1998)13C-NMR, MS and metabolic £ux balancing in
biotechnological research. Q. Rev. Biophys. 31, 41^106.
[4] Sauer, U., Szyperski, T. and Bailey, J.E. (2000) Future trends in complex microbial reaction studies. In: NMR in Microbiology: Theory and Applications (Barbotin, J.-N. and Portais, J.-C., Eds.), pp. 479^490. Horizon Scienti¢c Press, Wymondham.
[5] Szyperski, T. (1995) Biosynthetically directed fractional13C-labeling
of proteinogenic amino acids: an e¤cient analytical tool to in-vestigate intermediary metabolism. Eur. J. Biochem. 232, 433^ 448.
[6] Szyperski, T., Glaser, R.W., Hochuli, M., Fiaux, J., Sauer, U., Bai-ley, J.E. and Wu«thrich, K. (1999) Bioreaction network topology and metabolic £ux ratio analysis by biosynthetic fractional13
C-label-ing and two-dimensional NMR spectroscopy. Metab. Eng. 1, 189^ 197.
[7] Maaheimo, H., Fiaux, J., C°akar, Z.P., Bailey, J.E., Sauer, U. and Szyperski, T. (2001) Central carbon metabolism of Saccharomyces cerevisiae explored by biosynthetic fractional13C labeling of common
amino acids. Eur. J. Biochem. 268, 2464^2479.
[8] Sauer, U., Hatzimanikatis, V., Bailey, J.E., Hochuli, M., Szyperski, T. and Wu«thrich, K. (1997) Metabolic £uxes in ribo£avin-producing Bacillus subtilis. Nat. Biotechnol. 15, 448^452.
[9] Sauer, U., Lasko, D.R., Fiaux, J.M.H., Glaser, R., Szyperski, T., Wu«thrich, K. and Bailey, J.E. (1999) Metabolic £ux ratio analysis of genetic and environmental modulations of Escherichia coli central carbon metabolism. J. Bacteriol. 181, 6679^6688.
[10] Gottschalk, G. (1986) Bacterial Metabolism. Springer-Verlag, New York.
[11] Bo«hringer, J., Fischer, D., Mosler, G. and Hengge-Aronis, R. (1995) UDP-glucose is a potential intracellular signal molecule in the control of expression of cs and cs-dependent genes in Escherichia coli.
J. Bacteriol. 177, 413^422.
[12] Fraenkel, D.G. and Levisohn, S.R. (1967) Glucose and gluconate metabolism in an Escherichia coli mutant lacking phosphoglocose isomerase. J. Bacteriol. 93, 1571^1578.
Fig. 3. Origins of metabolic intermediates (A^K) during aerobic exponential growth of E. coli MG1655 (white bars) and the Pgi mutant (gray bars). In certain cases, the NMR data permit the determination only of upper bounds (ub) or lower bounds (lb) on the origin of metabolites. The experimental error was estimated from the analysis of redundant13C scalar coupling ¢ne structures and the signal-to-noise ratio of the [13C^1H]COSY spectra
em-ploying the Gaussian law of error propagation. The fraction of the total pool for a particular metabolite quanti¢es the ratio of this metabolite that is derived from a speci¢ed substrate to the sum of all other substrates that contribute to the pool of this metabolite. In cases where only two reactions contribute to one metabolite, e.g. OAA from PEP and PEP from OAA, the remaining fraction of the total pool can be attributed to the competing re-action. Abbreviations are explained in Fig. 1.