Pathophysiology of the hypertrophied heart in man*
H. P. KRAYENBUEHL, O. HESS AND H. HIRZELMedical Policlinic, Cardiology, University Hospital, Zurich, Switzerland
KEY WORDS: Hypertrophy, left ventricular systolic and diastolic function.
Increase in sympathetic drive, the Frank-Starling effect and myocardial hypertrophy represent the three com-pensatory mechanisms in chronic mechanical overloading of the heart. Chronic pressure overload is associated with concentric and chronic volume overload with eccentric hypertrophy. The changes in ventricular geometry have an important influence on the ejection dynamics of the heart; the magnitude of fiber shortening is the predominant mechanism for systolic reduction of cavity size in eccentric hypertrophy whereas in concentric hypertrophy the contribution of systolic wall thickening to ejection becomes very important.
The main abnormality of diastolic function in patients with left ventricular (L V) hypertrophy is the increase of chamber stiffness indicated by the steepened slope of the diastolic pressure-volume relationship. In contrast LV diastolic myocardial stiffness as evaluated from the stress-strain relationship remains relatively unaltered in hypertrophy unless there is massive admixture of fibrosis in the LV wall (congestive cardiomyopathy). Finally LV relaxation (rate of pressure decay) is often impaired in hypertrophied states although the relation-ship of abnormalities of relaxation to alterations of systolic function remains to be established.
There has been considerable debate whether in secondary L V hypertrophy from chronic pressure or volume overload myocardial contractility is normal or depressed. We have recently shown that in patients with myocardial hypertrophy from aortic stenosis ejection phase indexes of contractility are correlated inversely to peak systolic wall stress and that this relationship is modulated according to the actual inotropic state. The patients on the downward shifted curve (depressed contractile state) had a significantly increased L V angiographic mass. Thus advanced LV hypertrophy in chronic pressure overload appears to be associated with compromised con-tractile state. The structural and metabolic abnormalities which may be ultimately responsible for the depression of contractility of the hypertrophied human myocardium encompass the following findings: reduced intra-cellular volume fraction of myofibrils; massive increase of the average fiber diameter and increased variability of the thickness of the individual fibers and reduced activity of the myofibrillar ATPase.
When a prolonged mechanical load is imposed to the crease in wall stress allows the augmented oxygen heart the acutely mobilizable compensatory mechan- consumption per gram muscle to return to normal isms namely the Frank-Starling effect and increased values. Thus the development of hypertrophy serves sympathetic drive rapidly become insufficient for to restore adequate pump function and to normalize maintaining adequate pump function. In this situation energy expenditure per unit mass of muscle in the face myocardial hypertrophy must develop in order to of chronic abnormal loading,
prevent imminent catastrophe. The mechanism by
which hypertrophy (thickening of the ventricular wall) _, . . , . » . . . , . • L J • ii u c • i rr . • . Concentnc and eccentric hypertrophy. Implications of exerts its hemodynamicalry beneficial effect consists, , . , Jr r J r
,. . ., , r . i • J „• c.u the ventricular geometry
according to the law of Laplace, in a reduction of the
critically elevated wall stress. Furthermore the de- Traditionally a given type of chronic abnormal loading has been associated with a specific shape of
Requests for reprints to: H. p. Krayenbuehl, M.D.. Medical Poli- the hypertrophied ventricle"3. Whereas chronic pres-clinic,Cardiology,UniversityHospital,CH-8091 Zurich,Switzerland. s u r e overload leads to concentric hypertrophy
charac-• Supported by a grant from the Swiss National Science Founda- t e r i z e d by a r e d u c e d Chamber radius (r)/wall thickness tion. (h) ratio eccentric hypertrophy is the result of
r/h End-diastole End-systole EF A l / U Normal 3-5
o
(g)
68% 0-2Figure 1 Extent of systolic midwall shortening in a spherical
model of ventricles with an identical ejection fraction (EF). Note that for the given EF the ratio of midwall fiber shortening to initial fiber length (A 1/U) is larger in eccentric than in concentric hypertrophy. In the latter thickening becomes important for the systolic reduction of cavity size. Abbreviations: r = end-diastolic inner chamber radius; h = end-diastolic wall thickness; A 1 = extent of systolic midwall fiber shortening; lo = end-diastolic mid-wall fiber length.
standing volume overload. In the compensated stage the increase in h is proportional or almost so to the increase of r. Thus the ratio r/h is essentially normal. The changes in ventricular geometry consequent to chronic abnormal loading are of importance for the ejection dynamics of the heart. Let us assume (Fig. 1) that the ejection fraction is identical in a normal ventricle, a ventricle with concentric and a ventricle with eccentric hypertrophy. As shown in this spherical model'21 the same ejection fraction is obtained by a clearly different fraction of midwall fiber shortening compared to initial fiber length (A l/l0). Thus in eccentric hypertrophy the
magni-tude of fiber shortening is the predominant mech-anism for systolic reduction of cavity size whereas in concentric hypertrophy the contribution of wall thickening to inward wall displacement (reduction in cavity size) becomes more important and allows for a smaller ratio A l/lo without a fall in ejection
fraction.
Chamber and myocardial stiffness in ventricular hyper-trophy
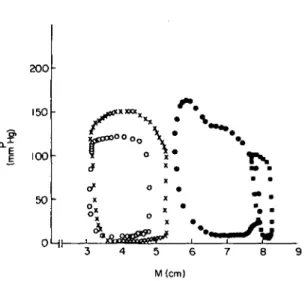
Patients with different types of hypertrophy elicit different left ventricular pressure-volume (P-V) or dimension (M) loops. Figure 2 depicts some typical P-M curves. It is obvious that not only the systolic portions of the loops vary greatly but also the diastolic P-M relationship is different.
If it is assumed that the diastolic P-V relationship is monoexponential, the constant of chamber stiffness
200 150 100 50
r
o o o o
o
\ :• v
OHr-M(cm)Figure 2 Left ventricular pressure-dimension loops in four
patients. Abbreviations: P = left ventricular pressure; M = left ventricular transverse diameter determined by single beamechocardiography;o = normal subject; • = congestive cardiomyopathy; X = aortic stenosis; • = aortic insuffi-ciency.
(kp) can be derived from the slope of the linear
relation between volume stiffness (dP/dV) and pres-sure'3'. This constant has been shown to be increased in patients with concentric hypertrophy'31. Such an increase of kp is either the consequence of the increase
of wall thickness alone or might also be due to changes of the diastolic properties (stiffening) of the muscle itself. The calculation of the constant of muscle stiff-ness from the left ventricular diastolic stress-strain relationship helps elucidate the nature of a steepened diastolic P-V relationship in more detail. In Fig. 3 left ventricular meridional wall stress (S) is plotted against normalized midwall strain (En)'41 in the same
four patients depicted in Fig. 2. Whereas the patients with aortic stenosis and aortic insufficiency show a similar curve as the control subject the curve of the patient with congestive cardiomyopathy is sizably steepened. Thus secondary hypertrophy is accom-panied by no or minor changes of left ventricular muscle stiffness whereas in the primary hypertrophy of congestive cardiomyopathy the left ventricular diastolic muscular properties are clearly altered. In 40 patients with myocardial hypertrophy we have recently shown'51 that an increased normalized visco-elastic constant of myocardial stiffness (Kn) is
associated with increased interstitial fibrosis as evaluated from endomyocardial biopsies (Fig. 4). In contrast cellular hypertrophy estimated from myo-cardial fiber diameter and left ventricular chamber hypertrophy evaluated from angiographic mass did
not correlate with Kn. Thus abnormalities of diastolic
myocardial stiffness in myocardial hypertrophy ap-pear to be related more to the interstitial than to the muscular tissue. 40 30 20 10. • • • • i ° X X 1 1 X X o • o x o X 1 1 0 1 0-2 0-3 0-4 0-5 0-6 En 0-7
Figure 3 Left ventricular diastolic stress-strain relationship in the same four patients as in Fig. 2. Normalization of the stress-strain data was carried out by using a diastolic circumferential reference length at a common wall stress of 15 dynes 103/cm2'41. Note that only the patient with
congestive cardiomyopathy showed a steepened slope of the stress-strain relationship whereas the slopes of the two patients with aortic valve disease did not differ from that of the control subject. S = meridional wall stress; En =
normalized midwall strain. Symbols as in Fig. 2.
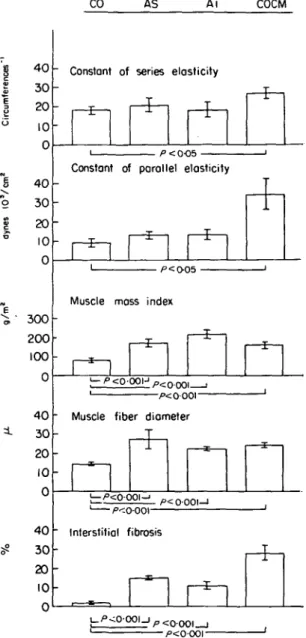
Figure 4 Left ventricular systolic and diastolic myocardial stiffness, angiographic muscle mass, muscle fiber diameter and interstitial fibrosis in eight control subjects (CO), 10 patients with aortic stenosis (AS), 10 patients with aortic insufficiency (AI) and 12 patients with congestive cardio-myopathy (COCM).
The constant of (systolic) series elasticity (k) was approxi-mated by the formula:
0-9maxdS/dt k (circumferences ) = •—
VCF Speak
where S = meridional wall stress; VCF = midwall fiber
(contractile element) velocity of shortening at Speak; Speak = peak systolic stress.
The normalized visco-elastic constant of (diastolic) paral-lel elasticity (Kn) was calculated as reported
pre-viously151.
Note that in COCM there was a significant increase of the constant of series and parallel elasticity associated with a sizable increase in interstitial fibrosis. The elasticity constants correlated however neither with the angiographic muscle mass nor with the muscle fiber diameter. (Bar = mean ± 1 s.e.m.).
In the course of these studies it has become evident that the stress-strain relationship is often not truly exponential, especially in patients with aortic insuf-ficiency. The observed deviation from an exponential curve in the early part of passive diastolic filling has been attributed to visco-elastic influences and hence linearization of the In stress-strain relationship was obtained by accounting for individual strain rates'41. However it must be realized that an alternative mech-anism which could also lead to the observed early deviation from a true exponential is a prolongation of relaxation in left ventricular hypertrophy.
40 30 20 10 0 40 30 20 10 0 300 200 100 0 40 30 20 10 0 40 30 20 10 0 CO AS A i COCM
Constant of series elasticity
• /><0O5
-Constant of parallel elasticity
rfzi
• /"=O05 •
Muscle mass index
" Muscle fiber diameter
1 —I—1
. p<0001-1
" Interstitial fibrosis
/><oooi-Relaxation in ventricular hypertrophy
There are few data in the literature on left ventri-cular relaxation in hypertrophic states in man. In patients with aortic stenosis delayed mitral valve opening has been reported'61 and in hypertrophic cardiomyopathy an increased time constant of iso-volumic left ventricular pressure fall as evaluated from the quotient PatpeaknegdP/dt/peak neg dP/dt was
found'71. We have recently assessed relaxation from simultaneous left ventricular pressure-single beam echo measurements in 58 patients with secondary hypertrophy from aortic valve disease (23 AS, 18 combined lesion, 17 AI) and in 10 controls'8'. Peak
AS AS+AI AI 300 200 100 n=IO n=23 n=l8 n=l7 -NS-
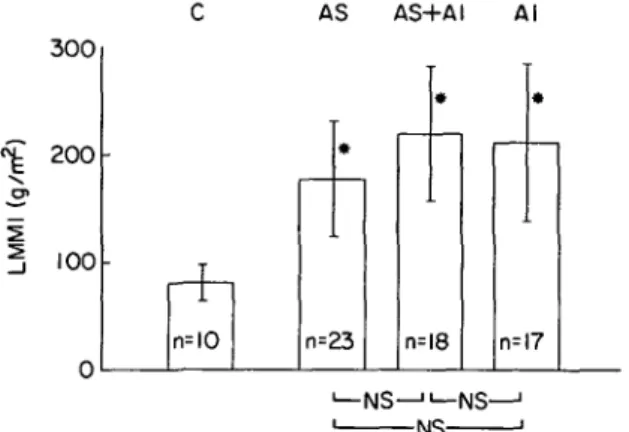
-NS-Figure 5 Angiographic muscle mass (LMMI) in 68 patients
in whom left ventricular relaxation dynamics were evaluated. Abbreviations: C = controls; AS = aortic stenosis; AS + AI = combined aortic valve lesion; AI = aortic insufficiency; n = number of patients; NS = not significant. */><001 compared to controls. (Bar = mean ± 1 s.d.).
c^ 2000 o (dyne s IP/ ! S1 c -* n c A n=IO S * n=23 i ASH-A * n=!8 NS—"— NS N S -AI • • n=l7 —| i
Figure 6 Peak rate of fall of left ventricular meridional
wall stress (peak neg dS/dt) in the same 68 patients as in Fig. 5. Note that peak neg dS, dt was increased significantly in all three groups with aortic valve disease. Abbreviations as in Fig. 5. *P < 001; **P< 002 compared to controls.
rate of fall of left ventricular pressure (peak neg dP/dt) and the time constant (T) of the exponential pressure fall during the interval A2 to mitral valve opening
were used as indexes of relaxation of the left heart chamber whereas peak rate of fall of meridional wall stress (peak neg dS/dt) was considered to be an index of left ventricular myocardial relaxation. Left ventri-cular hypertrophy as estimated from the angiographic muscle mass occurred in all three groups with aortic valve disease. The largest mass was present in the patients with combined lesions (Fig. 5). Left ventri-cular peak neg dP/dt was not different in the three groups with aortic valve disease as compared to the control subjects; peak neg dS/dt was however signi-ficantly increased in all three groups with hypertrophy (Fig. 6). It is obvious that from these isolated para-meters no clear-cut conclusion about the inherent speed of myocardial relaxation can be drawn because peak neg dP/dt is also influenced by peak systolic pressure, and peak neg dS/dt by peak systolic stress'9'. Thus peak neg dP/dt was compared with left ventricular peak systolic pressure. In all three groups with aortic valve disease the significantly increased peak pressure was not accompanied by an increased peak neg dP/dt. This observation suggests a relative depression of peak neg dP/dt in these patients. In contrast the increased left ventricular peak stress was associated with a commensurately increased peak neg dS/dt. The time constant of left ventricular pressure decline was significantly increased in all three groups with hypertrophy (Fig. 7). These observations suggest that the speed of left heart chamber relaxation
AS 100 50 AS+AI AI n=IO n=!2 n=l I n=IO -NS-
-NS-Figure 7 Time constant (T) of left ventricular pressure fall
during the early relaxation period (A2 to mitral valve open-ing) in 43 of the 68 patients of Fig. 5 with clearly visible A2 and early diastolic separation of the mitral leaflets. T was prolonged in all three groups with hypertrophy from aortic valve disease. Abbreviations as in Fig. 5.
>
•
is impaired in secondary hypertrophy whereas the rate of myocardial relaxation seems to be essentially unaltered. Admittedly these results appear to be some-what conflicting. It is to be hoped that an analysis of the entire time course of stress decay will shed more light on the nature of myocardial relaxation in hypertrophy. Furthermore it is not known whether relaxation disturbances in hypertrophy are sufficiently marked to influence left ventricular chamber and muscle dynamics during the period of 'passive' dia-stolic filling, and whether relaxation disturbances occur in conjunction with contraction abnormalities or are independent of systolic function.
Contractile state of the hypertrophied myocardium There has been considerable debate whether in
secondary left ventricular hypertrophy from chronic pressure or volume overload myocardial contractile function is normal or depressed. A major part of this controversy is due to the fact that there is no unanimously accepted technique for quantitating left ventricular contractility under all hemodynamic cir-cumstances. The popular ejection phase indices may be inadequate for the evaluation of inotropic state in the presence of an increased afterload. In this context it has been suggested by Gunther and Grossman1101 that in severe aortic stenosis afterload mismatch may be such as to depress left ventricular ejection fraction down to the extreme of 19%. Never-theless impaired contractility can also be at the origin of a depressed ejection fraction in aortic stenosis'111. We have recently analysed the determinants of left ventricular ejection performance in 76 patients with
1
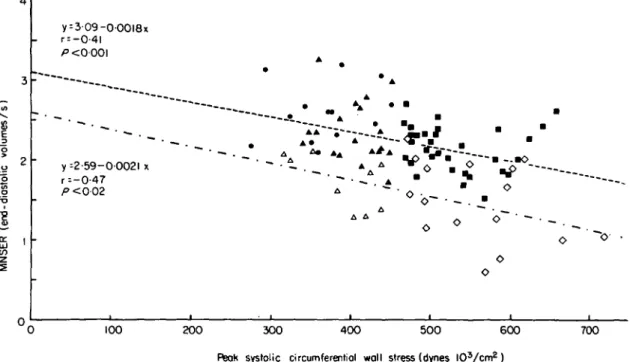
y = 3 09-000l8x r = -0-4l y -2-59-00021 x r=-0-47 P <0 02 • A * " A • o • _ A 100 200 300 4 0 0 5 0 0 600 700 Rsok systolic circumferentiol wall stress (dynes l O V c m2)
Figure 8 Relationship between normalized systolic ejection rate (MNSER) and peak systolic circumferential wall stress
in patients with aortic stenosis.
Separate linear regression analysis was performed for the patients with normal contractility (closed symbols) and for the patients with depressed contractility (open symbols). Groups I and UI represent patients with aortic stenosis having a normal peak systolic wall stress and either normal (closed triangles) or depressed (open triangles) isovolumic indices. Groups II and IV represent patients with aortic stenosis and increased peak systolic wall stress having either normal (closed squares) or depressed (open squares) isovolumic indices. CO = control subjects (dots). Group 1, n = 19; Group II, n = 32; Group III, n = 9; Group IV, n = 16; control subjects, n = 13.
Both regressions show a significant inverse relationship between MNSER and peak systolic wall stress. Comparison of the two lines by covariance regression analysis yielded no significant difference for the slopes but a significantly (P<0-001) higher intercept in the patients with normal isovolumic contractility (309 end-diastolic volumes/s) than in those with depressed contractility (2-59 end-diastolic volumes/s). Thus, MNSER depended on both contractile state and afterload. Reprinted with the permission of Huber and coworkers'121.
pure or predominant aortic stenosis'12'. Like Gunther and Grossman'10' we found an inverse relationship between mean normalized systolic ejec-tion rate (MNSER; i.e. ejecejec-tion fracejec-tion divided by ejection time) and peak systolic circumferential wall stress (Fig. 8). This relationship was, however, modulated according to the actual inotropic state, evaluated from pressure-derived velocity indices, since the curve of the patients with depressed velocity indexes was shifted downwards compared to the curve of the patients with velocity indices within the normal range. Our observation that angiographic muscle mass, which represents an index for chamber hyper-trophy, was significantly (/•< 0-005) increased (197 g/m2) in the 25 patients with depressed contractility (dashed-dotted curve in Fig. 8) as compared to the 51 patients (157 g/m2) with preserved contractile state (dotted line in Fig. 8) is relevant to the discussion of whether contractility is depressed in pressure overload hypertrophy from aortic stenosis. We concluded that in chronic pressure overload advanced hypertrophy is associated with depressed contractile state.
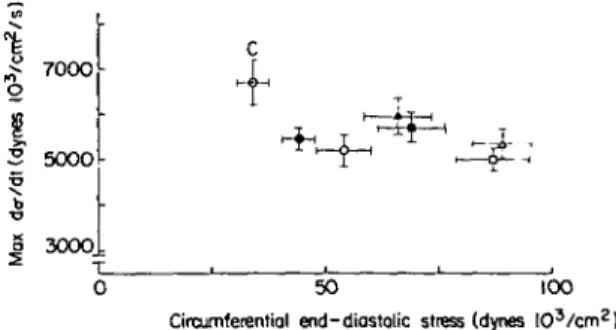
Another important issue which has been debated in the past is whether a given degree of increase of left ventricular mass has different consequences for myocardial contractility when hypertrophy is pro-duced by pressure, volume or mixed ventricular overload. In the animal model'13'14' chronic volume overload was reported to have little or no detrimental effect on left ventricular contractile function whereas in man with volume or mixed overload from aortic insufficiency depression of contractile function is not uncommon'15"17'. We have recently addressed this question in 130 patients with aortic valve disease and 13 control subjects studied by left ventricular micro-manometry and quantitative cine-angiography'18'. There were 42 patients with AS, 50 with a combined lesion and 38 with AI. These three groups were subdivided into patients with moderate increase in angiographic mass (125 to 179 g/m2, Group I) and in those with severe increase in mass( > 180 g/m2, Group II). Left ventricular contractile state was assessed by plotting left ventricular isovolumic maxi-mal rate of rise of circumferential wall stress against end-diastolic wall stress. For the calculation of maxi-mal rate of stress rise it was assumed that left ventricular dimensions do not change during the isovolumic contraction period. Making this assump-tion the maximal rate of rise of wall stress can be determined from max dP/dt and left ventricular end-diastolic dimensional measurements. In this 'iso-volumic' ventricular function diagram all groups with left ventricular hypertrophy were located rightward
7000
5O0O
3000
0 50 100
Circumferential end-diastolic stress (dynes I O3 / c m2
)
Figure 9 Left ventricular isovolumic maximal rate of rise of circumferential wall stress (vertical axis) v. circumferential end-diastolic wall stress (horizontal axis).
The mean values ± 1 standard error (s.e.)ofthe six groups of aortic valve disease and of the control group (C) are plotted. Note that all groups with left ventricular hyper-trophy were located rightward and downward to the control group eliciting less isovolumic performance at an increased preload. This pattern is indicative of impaired left ventricular contractile function. AS = aortic stenosis; AS + AI = com-bined aortic valve lesion; AI = aortic insufficiency; Group 1, left ventricular (LV) angiographic mass < 180 g/m2; Group II, LV angiographic mass > 180 g/m2. AS: • = Group I, o =
Group II; AS + AI: • = Group I, o = Group II; AI. » = Group I, A = Group II. Reprinted with permission of Kray-enbuehl and coworkers"81.
and downward of the control group. This indicates reduced isovolumic performance at an increased preload (Fig. 9), and reveals impaired left ventricular contractile function. At both a moderately and a severely increased mass the patients with combined lesions and with aortic insufficiency had more severely depressed contractile function than the patients with aortic stenosis. We can conclude from these investiga-tions that at a similarly increased left ventricular angiographic mass contractile function appears to be more impaired in eccentric (AI, AS + AI) than in concentric hypertrophy (AS).
Factors responsible for depressed function in myo-cardial hypertrophy
In man there is increasing interest in the correlation of findings obtained from endomyocardial biopsies with functional parameters. Schwarz and co-workers'191 have reported that in patients with de-compensated pressure overload from aortic stenosis the intracellular volume fraction of myofibrils is re-duced compared to AS patients with preserved ejection performance. One may speculate whether this struc-tural abnormality was the underlying cause for the depressed contractile function. In patients with aortic
insufficiency, we have recently analysed1201 whether the prognostically unfavorable combination of reduc-tion of left ventricular minor equator shortening below 25% and of an increase of the end-systolic minor equator of more than 55 m m1"1 is associated with morphometric alterations. Patients presenting with this particular combination of parameters had a significantly larger mean myocardial fiber diameter, a larger intrapatient variability of fiber diameters and more ultrastructural cellular abnormalities than patients with both or at least one of the hemodynamic measures within normal limits. Moreover we have shown that pre-operative excessive fiber thickening in patients with aortic valve disease heralds an un-favorable postoperative outcome, regardless of the pre-operative left ventricular muscle mass1211. Finally enzymic analysis of left ventricular biopsy samples in patients with valvular disease has shown a significant reduction of myofibrillar ATPase activity when left ventricular function was poor1221. Hope-fully in the future the structural and the biochemical evaluation of biopsies can be further refined to give more complete insight into the basic mechanisms responsible for myocardial dysfunction in hyper-trophy.
Hypertrophy, like so many things in life, has contradictory aspects'231. Hypertrophy is necessary
in order to prevent a catastrophe, and therefore is beneficial in the presence of severe loading. However, this compensatory mechanism has inherent dangers for the proper function of the individual muscular units, and thus in some respects hypertrophy is also detrimental.
References
[1] Grossman W. Cardiac hypertrophy: useful adaptation or pathologic process? Am J Med 1980; 69: 576-84. [2] Kreuzer H, Neuhaus KL. Invasive
Untersuchungs-methoden zur Erfassung einer gestorten Kontraktilitat. Verh Dtsch Ges KreislaufTorschg 1976; 42: 31-9. [3] Gaasch WH, Levine HJ, Quinones MA, Alexander JK.
Left ventricular compliance: mechanisms and clinical implications. Am J Cardiol 1976; 38: 645-53. [4] Hess OM, Grimm J, Krayenbuehl HP. Diastolic simple
elastic and viscoelastic properties of the left ventricle in man. Circulation 1979; 59: 1178-87.
[5] Hess OM, Schneider J, Koch R, Bamert C, Grimm J, Krayenbuehl HP. Diastolic function and myocardial structure in patients with myocardial hypertrophy. Circulation 1981; 63: 360-71.
[6] Gibson G, Traill TA, Hall RJC, Brown DJ. Echo-cardiographic features of secondary left ventricular hypertrophy. Br Heart J 1979; 41: 54-9.
[7] Hirota Y. A clinical study of left ventricular relaxation. Circulation 1980; 62: 756-63.
[8] Eichhorn P, Grimm J, Koch R, Hess O, Carroll J, Krayenbuehl HP. Left ventricular relaxation in secondary hypertrophy from aortic valve disease. Circulation (in press).
[9] Weisfeldt ML, Scully HE, Frederiksen J, Rubenstein JJ, Pohost GM, Beierholm E, Bello AG, Daggett WM. Hemodynamic determinants of maximum negative dP/ dt and periods of diastole. Am J Physiol 1974; 227: 613-21.
[10] Gunther S, Grossman W. Determinants of ventricular function in pressure-overload hypertrophy in man. Circulation 1979; 59: 679-88.
[11] Carabello BA, Green LH, Grossman W, Cohn LH, Koster JK, Collins JJ Jr. Hemodynamic determinants of prognosis of aortic valve replacement in critical aortic stenosis and advanced congestive heart failure. Circulation 1980; 62: 42-8.
[12] Huber D, Grimm J, Koch R, Krayenbuehl HP. Deter-minants of ejection performance in aortic stenosis. Circulation 1981; 64: 126-34.
[13] Taylor RR, Co veil JW, Ross J Jr. Left ventricular function in experimental aorto-caval fistula with cir-culatory congestion and fluid retention. J Clin Invest 1968; 47: 1333—42.
[14] Cooper G, Puga FJ, Zujko KJ, Harrison CE, Coleman HN. Normal myocardial function and energetics in volume-overload hypertrophy in the cat. Circ Res 1973; 32: 140-8.
[151 Krayenbuehl HP, Turina M, Hess OM, Rothlin M, Senning A. Pre- and postoperative left ventricular contractile function in patients with aortic valve disease. Br Heart J 1979; 41: 204-13.
[16] Clark DG, McAnulty JH, Rahimtoola SH. Valve replacement in aortic insufficiency with left ventricular dysfunction. Circulation 1980; 61: 411-21.
[17] Henry WL, Bonow RO, Borer JS, Ware JH, Kent KM, Redwood DR, Mclntosh CL, Morrow AG, Epstein SE. Observations on the optimum time for operative intervention for aortic regurgitation, I. Evaluation of the results of aortic valve replacement in symptomatic patients. Circulation 1980; 61: 471-83.
[18] Krayenbuehl HP, Huber D, Koch R, Turina M, Senning A. Contractilite du ventricule gauche hypertrophie par suite d'une lesion de la valvule aortique. Coeur 1980; 11: 429-39.
[19] Schwarz F, Schaper J, Kittstein D, Flameng W, Walter P, Schaper W. Reduced volume fraction of myofibrils in myocardium of patients with decompensated pressure overload. Circulation 1981; 63: 1299-304.
[20] Schneider J, Eichhorn P, Tsuruta U, Krayenbiihl HP. Correlation between prognostic hemodynamic para-meters and myocardial structure in aortic insufficiency. Eur Heart J 1981; 2 (suppl A): 96. (Abstract). [21] Krayenbuehl HP, Schneider J, Turina M, Senning A.
Myocardial function and structure in aortic valve disease before and after surgery. Circulation 1980; 62: IH-207. (Abstract).
[22] Peters TJ, Brooksby IAB, Webb-Peploe MM, Wells G, Jenkins BS, Coltart DJ. Enzymic analysis of cardiac biopsy material from patients with valvular heart-disease. Lancet 1976; 1: 269-70.
[23] Krayenbuehl HP. Effects of hypertrophy on contract-ile function in man. Basic Res Cardiol 1977; 72: 184-9.