Received: 2 March 2004 Revised: 7 June 2004 Accepted: 14 June 2004 Published online: 27 July 2004 © Springer-Verlag 2004
Abstract The purpose of this paper is to compare the influence of detec-tor collimation on the signal-to-noise ratio (SNR) for a 5.0 mm recon-structed slice thickness for four multi-detector row CT (MDCT) units. SNRs were measured on Cat-phan test Cat-phantom images from four MDCT units: a GE LightSpeed QX/I, a Marconi MX 8000, a Toshi-ba Aquilion and a Siemens Volume Zoom. Five-millimetre-thick recon-structed slices were obtained from acquisitions performed using detec-tor collimations of 2.0–2.5 mm and 5.0 mm, 120 kV, a 360° tube rotation time of 0.5 s, a wide range of mA and pitch values in the range of 0.75–0.85 and 1.25–1.5. For each set of acquisition parameters, a Wiener spectrum was also calculat-ed. Statistical differences in SNR for the different acquisition parameters were evaluated using a Student’s t-test (P<0.05). The influence of detector collimation on the SNR for
a 5.0-mm reconstructed slice thick-ness is different for different MDCT scanners. At pitch values lower than unity, the use of a small detector col-limation to produce 5.0-mm thick slices is beneficial for one unit and detrimental for another. At pitch val-ues higher than unity, using a small detector collimation is beneficial for two units. One manufacturer uses different reconstruction filters when switching from a 2.5- to a 5.0-mm detector collimation. For a compara-ble reconstructed slice thickness, us-ing a smaller detector collimation does not always reduce image noise. Thus, the impact of the detector col-limation on image noise should be determined by standard deviation calculations, and also by assessing the power spectra of the noise. Keywords CT · Dose reduction · Dosimetry · Image quality · Optimization F. R. Verdun A. Noel R. Meuli M. Pachoud P. Monnin J.-F. Valley P. Schnyder A. Denys
Influence of detector collimation on SNR
in four different MDCT scanners using
a reconstructed slice thickness of 5 mm
Introduction
To increase volume coverage in a shorter time while maintaining an excellent longitudinal resolution, manu-facturers have developed multi-detector row CT scanners (MDCT). Compared with single-slice CT units, MDCT scanners have arrays of detectors that can simultaneously acquire several slices per 360° X-ray tube rotation. With these systems, the smallest slice thickness that can be obtained is equal to the length, in the longitudinal direc-tion, of the smallest detector cell—referred to here as the
detector collimation. At the end of the data acquisition, z-filtering algorithms can be used to vary the recon-structed slice thickness from the detector collimation thickness to up to 10 mm. Thus, data acquired with a detector collimation of 2.0 mm can be reconstructed as 5.0-mm-thick slices.
The use of a smaller detector collimation than the re-constructed slice thickness has several advantages. For example, it permits the reconstruction of low-artefact sag-ittal or coronal slices, and also the reconstruction at some later time after the data acquisition, of slices with a thick-F. R. Verdun (
✉
) · M. PachoudP. Monnin · J.-F. Valley University Institute for Applied Radiophysics,
Grand-Pré 1, 1007 Lausanne, Switzerland e-mail: [email protected] Tel.: +41-21-6233434
Fax: +41-21-6233435 A. Noel
Medical Physics Division, A. Vautrin Centre (CAV),
54500 Vandoeuvre-lès-Nancy, France R. Meuli · P. Schnyder · A. Denys Department of Diagnostic and Interventional Radiology, University Hospital Centre (CHUV), 1011 Lausanne, Switzerland
higher longitudinal resolution be required [1–10].
The goal of this study is to investigate for four differ-ent MDCT units the effect of using a 2.0–2.5-mm detec-tor collimation (compared with a 5-mm detecdetec-tor collima-tion) on the image noise level for 5.0-mm-thick recon-structed slices, at equivalent dose levels.
Materials and methods
Data acquisitionImages were acquired on four MDCT scanners: (A) a GE Light-Speed QX/i (GE Medical Systems, Milwaukee, WI), (B) a Mar-coni MX 8000 (Philips Medical Systems, Best, The Netherlands), (C) a Toshiba Aquilion (Toshiba Medical Systems Europe, Zoeter-meer, The Netherlands) and (D) a Siemens VZ (Volume Zoom, Siemens Medical Systems, Erlangen Germany). The GE scanner has 16 rows of 1.25-mm-wide detectors; the Marconi and Siemens scanners have two rows each of 1-, 1.5-, 2.5- and 5-mm wide detectors (eight rows total), and the Toshiba has four rows of 0.5-mm- and 30 rows of 1-mm-wide detectors.
Acquisitions were performed at 120 kV, using a 360° gantry ro-tation time of 0.5 s, and a wide range of tube currents (100–400 mA). On units A and D, acquisitions were performed us-ing detector collimations of 2.5 and 5.0 mm with pitch values of 0.75 and 1.5. On unit B, acquisitions were performed using detector collimations of 2.5 and 5.0 mm with pitch values of 0.875 and 1.25 (because pitch values of 0.75 and 1.5 were not available on this sys-tem). On unit C, acquisitions were performed using detector colli-mations of 2.0 mm and 5.0 mm with pitch values of 0.75 and 1.5. Acquisitions were repeated three times for each set of acquisition parameters to improve the statistics of the results. The manufactur-er-recommended reconstruction filter for standard abdominal acqui-sitions was used, and the field of view (FOV) was set to 36 cm. Dosimetry
All units displayed the CTDIwand the DLP corresponding to the acquisition protocol. These data were verified by measuring the
nCTDI100,wusing a 32-cm-diameter CTDI test object and a
10-cm-long CT pencil ionisation chamber connected to an electrometer (Radcal 1035-10.3 CTDI chamber and MDH 1015 electrometer, Radcal, Monrovia, CA). The ion chamber and electrometer were calibrated in RQR9 and RQA9 beams according to IEC 61267 [11], and traceable to the Swiss Federal Office of Metrology. For each set of acquisition parameters, the volume CTDI (CTDIvol) was calculated by dividing the CTDIwby the pitch value, accord-ing to its definition [12, 13].
Image quality assessment
Signal-to-noise ratio (SNR) was assessed for images of the com-mercially available Catphan 500 CT phantom (The Phantom
Lab-manufacturer to simulate the absorption of a standard abdomen in place. With the additional ring in place, the total diameter of the test phantom is 30 cm. The SNR was calculated in a homogeneous area of about 1,500 pixels at the centre of the FOV, by dividing the average pixel value (close to 55 HU for all the CT units) by the standard deviation of the pixel values. The SNR was evaluated on each of the three exposures made with the same acquisition pa-rameters, and an averaged SNR was calculated. For each scanner, a Student’s t-test (P<0.05) was used to evaluate the statistical dif-ferences in SNR between the different acquisition parameters.
To characterize the spatial frequency content of the image noise, a Wiener spectrum (i.e., a noise power spectrum dividing the noise variance into spatial frequencies) was calculated for the images obtained with a tube current of 300 mA. In each image, a homogeneous area of 128×128 pixels was divided into four 64×64 pixel subregions, and the Wiener spectrum was calculated for each subregion [13]. An averaged Wiener spectrum was calculated for each combination of pitch value and detector collimation (four Wiener spectra per image and three images for each set of acquisi-tion parameters).
For each scanner and combination of pitch value and detector collimation, the full-width at half maximum (FWHM) of the slice sensitivity profile (SSP) was assessed using a bead point source in the CPT528 module of the Catphan 500 test phantom. The CPT528 module was scanned in the test object, and the SSP val-ues were obtained by plotting a profile through the bead in a sagit-tal reconstruction, as recommended by the manufacturer.
Results
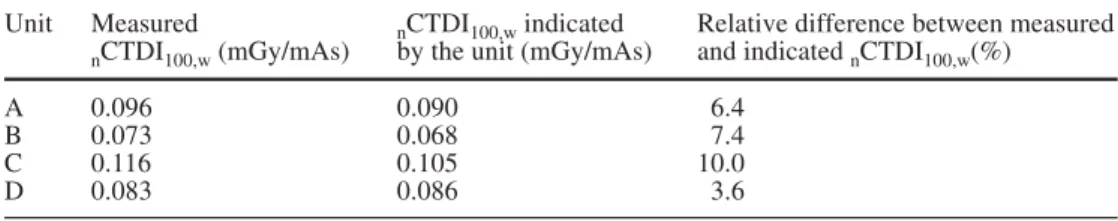
Table 1 shows the normalised weighted CTDI (nCTDIw) measured at 120 kV in the 32 cm CTDI test phantom. There is good agreement between the scanner displays and the measured values (±10%).
Figures 1a, 2a and 3a (for units A, B and C, respec-tively) show the variation in SNR as a function of CTDIvol, for a nominal reconstructed slice thickness of 5.0–6.5 mm (because it was not always possible to re-construct a slice thickness of exactly 5 mm) and a pitch value between 0.75 and 0.85. The results obtained for unit D were similar to those for unit A and have been omitted. The relative error on the SNR measurements is close to 5.0%. The data presented as black squares is for acquisitions with a detector collimation of 5.0 mm. The data presented as white squares is for data acquired with a detector collimation of 2.0–2.5 mm and then recon-structed as 5-mm-thick slices. For a given scanned vol-ume, the use of a detector collimation of 2.0–2.5 mm (in-stead of 5.0 mm) increases the acquisition time by a fac-tor of 2.5–2.0, respectively, and this setting is called “ac-quisition without ac“ac-quisition time constraint”. Table 2
Table 1 Normalised CTDIwfor the four units involved in the study
Unit Measured nCTDI100,windicated Relative difference between measured
nCTDI100,w(mGy/mAs) by the unit (mGy/mAs) and indicated nCTDI100,w(%)
A 0.096 0.090 6.4
B 0.073 0.068 7.4
C 0.116 0.105 10.0
shows the measured SSPs. The measured and nominal values agree within ±0.1 mm.
Table 3 shows the results of the Student’s t-test (P<0.05) on the SNR measurements obtained without ac-quisition time constraint. At equivalent CTDIvol values, there is no statistical difference in the SNR between the use of a 2.5- or 5.0-mm detector collimation for units B and D. For unit A, the use of a 2.5-mm detector collima-tion to get 5-mm-thick slices increases the SNR, and for
unit C the use of a 2.0-mm detector collimation to get 5-mm-thick slices significantly decreases the SNR. It is interesting to observe the effect of detector collimation on the longitudinal resolution of the acquisitions; the use of a 5.0-mm detector collimation on the units B and D gives a FWHM of the SSP of 6.5 and 6.0 mm, respec-tively. The use of a 2.5-mm detector collimation to pro-vide 5-mm slices was only beneficial for unit A.
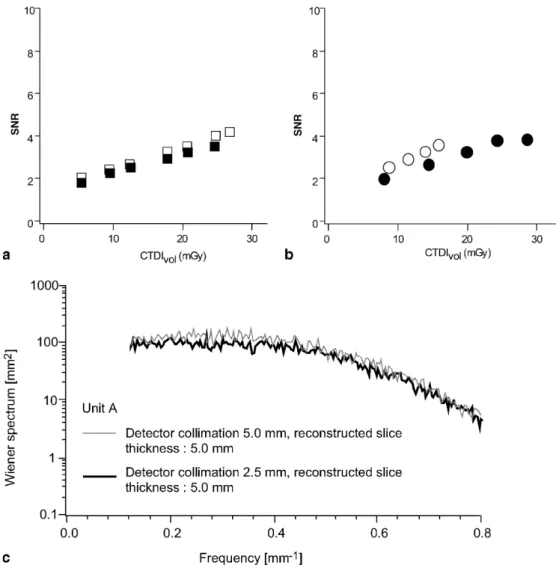
Fig. 1 a SNR of 5.0-mm-thick
reconstructed slices as a func-tion of CTDIvolfor unit A.
Black squares correspond to
the acquisitions performed with a detector collimation of 5.0 mm, whereas white squares correspond to the acquisitions performed with a detector colli-mation of 2.5 mm using sys-tematically a pitch of 0.75.
b Wiener spectrum of
5.0-mm-thick slices obtained with unit A using a pitch of 0.75 and de-tector collimations of 2.5 mm and 5.0 mm. Similar results were obtained for unit D.
c SNR of 5.0-mm-thick
recon-structed slices as a function of CTDIvol. Black circles corre-spond to the acquisitions per-formed using a detector colli-mation of 5.0 mm and a pitch of 0.75. White circles corre-spond to the acquisitions per-formed with a detector collima-tion of 2.5 mm and a pitch of 1.5
Table 2 FWHM of the SSP measured using a pitch of 0.75–0.85
at various detector collimations using a reconstructed slice thick-ness of 5.0 mm
Unit Detector collimation Detector collimation of 2.0–2.5 mm (mm) of 5.0 mm (mm)
A 5.0±0.1 5.1±0.1
B 5.0±0.1 6.5±0.1
C 5.0±0.1 5.0±0.1
D 5.0±0.1 6.0±0.1
Table 3 Analysis of the data presented in Fig. 1: Student’s t-test
results for acquisitions performed with a pitch of 0.75–0.85. Pa-rameters set 1 (PS1) corresponds to the use of a detector collima-tion of 2.0–2.5 mm, whereas Parameters set 2 (PS2) corresponds to the use of a detector collimation of 5.0 mm
Unit Student’s P<0.05 Statistical differences
t-test result between parameter sets 1 and 2 A 2.620 2.306 Yes: PS1 superior PS2 B 0.646 2.447 No: PS1 equal PS2 C 8.680 2.776 Yes: PS1 inferior to PS2 D 2.464 2.776 No: PS1 equal PS2
The data shown in Figs. 1a, 2a, 3a were obtained using the filters usually used in the different centres for routine standard abdominal acquisitions. Since SNR measurements do not take into account the spatial fre-quency content of the noise, these figures should not be used to rank the different units in terms of dose efficien-cy to reduce image noise.
Figures 1b, 2b, 3b show the Wiener spectra of the im-age noise for each unit, with a pitch value in the range of 0.75–0.85. Unit D has been omitted since it is similar to unit A. The low frequency range is not represented be-cause the length of the sample used to perform the calcu-lations is too small to provide adequate precision in this range, and because it is not relevant for this study. For units A and D, Fig. 1b shows that a similar filter is used to reconstruct data that are acquired with a detector collima-tion of 2.5 or 5.0 mm. For unit B (Fig. 2b), the filter ap-plied to reconstruct a 5.0-mm-thick slice is different de-pending on whether a detector collimation of 2.5 or 5 mm is used. The data are significantly more low-pass filtered
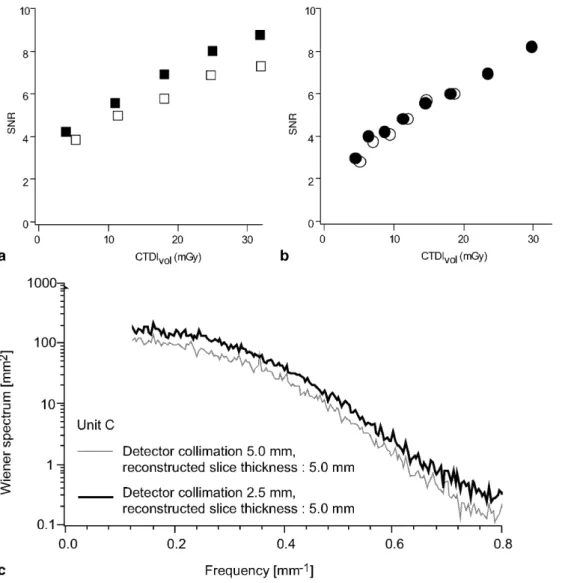
(smoothed) when a detector collimation of 2.5 mm is used than when a detector collimation of 5.0 mm is used. For unit C (Fig. 3b), as for units A and D, there is no change in filter when switching from a detector collimation of 2.0 to 5.0 mm. Nevertheless, the data are highly low-pass fil-tered when compared with the data in Fig. 1b, 2b.
Figures 1c, 2c, 3c show the variation in SNR as a function of the CTDIvolfor a reconstructed slice thickness close to 5.0 mm, for a pitch value of 0.75–0.85 combined with a detector collimation of 5.0 mm, and a pitch value of 1.25–1.5 combined with a detector collimation of 2.0–2.5 mm. The data plotted as black circles are for the acquisitions with a detector collimation of 5.0 mm. The data plotted as white circles are for the acquisitions with a detector collimation of 2.0–2.5 mm, reconstructed as 5-mm-thick slices. For this data, the acquisition duration for a given scan length is comparable, and this setting is called “acquisition with acquisition time constraint”.
The SSPs measured for the acquisitions with a detec-tor collimation of 2.0–2.5 mm and a pitch in the range 6.5-mm-thick reconstructed
slices as a function of CTDIvol for unit B. Black squares corre-spond to the acquisitions per-formed with a detector collima-tion of 5.0 mm (leading to a re-constructed slice thickness of 6.5 mm), whereas white
squares correspond to the
ac-quisitions performed with a de-tector collimation of 2.5 mm (leading to a reconstructed slice thickness of 5.0 mm) using sys-tematically a pitch of 0.875.
b Wiener spectrum of 5.0- or
6.5-mm-thick slices obtained with unit B using a pitch of 0.875 and detector collimations of 2.5 and 5.0 mm. c SNR of 5.0- and 6.5-mm-thick recon-structed slices as a function of CTDIvol. Black circles corre-spond to the acquisitions per-formed using a detector colli-mation of 5.0 mm and a pitch of 0.875. White circles corre-spond to the acquisitions per-formed with a detector collima-tion of 2.5 mm and a pitch of 1.25
1.25–1.5 are similar to those reported in the second col-umn of Table 2. Thus, the use of a pitch value greater than unity, combined with a small detector collimation, allows a good control of the SSP parameter. For all the units, the Wiener spectra obtained with a detector colli-mation of 2.0–2.5 mm and a pitch in the range 1.25–1.5 are similar to those obtained with a detector collimation of 2.0–2.5 mm and a pitch of 0.75–0.85.
Table 4 shows the results of the Student’s t-test (P<0.05) applied to the SNR measurements obtained with the acquisition time constraint. For units A and B, at a given CTDIvol, the use of a detector collimation of 2.5 mm combined with a pitch value of 1.25–1.5 gives a higher SNR than the use of a detector collimation of 5.0 mm and a pitch value of 0.75–0.85. For units C and D, no statistical difference in the SNR is observed be-tween the two sets of acquisition parameters.
Discussion
As expected, there are noticeable differences in the nCTDIwbetween the units. These differences are due to the manufacturers’ choices for X-ray beam filtering and gantry geometries. The nCTDIwalone does not indicate whether a particular unit delivers more patient dose than another. It is more appropriate to differentiate the units on the basis of the image quality obtained for a given
Fig. 3 a SNR of 5.0-mm-thick
reconstructed slices as a func-tion of CTDIvolfor unit C.
Black squares correspond to
the acquisitions performed with a detector collimation of 5.0 mm, whereas white squares correspond to the acquisitions performed with a detector colli-mation of 2.0 mm using sys-tematically a pitch of 0.75.
b Wiener spectrum of
5.0-mm-thick slices obtained with unit C using a pitch of 0.75 and de-tector collimations of 2.0 and 5.0 mm. c SNR of 5.0-mm-thick reconstructed slices as a function of CTDIvol. Black
cir-cles correspond to the
acquisi-tions performed using a detec-tor collimation of 5.0 mm and a pitch of 0.75. White circles cor-respond to the acquisitions per-formed with a detector collima-tion of 2.0 mm and a pitch of 1.5
Table 4 Analysis of the data presented in Fig. 6: Student’s t-test
results for acquisitions performed with a pitch of 1.25–1.5 with a detector collimation of 2.0–2.5 mm (PS3) and with a pitch of 0.75–0.85 with a detector collimation of 5.0 mm (PS2)
Unit Student’s P<0.05 Statistical differences
t-test result between parameter sets 2 and 3 A 5.391 2.306 Yes: PS3 superior PS2 B 8.569 2.447 Yes: PS3 superior PS2 C 2.235 4.303 No: PS3 equal PS2 D 1.302 2.306 No: PS3 equal PS2
w vol cal acquisitions.
There is good agreement between the nominal and measured reconstructed slice thickness (Table 2). For units B and D, in spite of the fact that a detector collima-tion of 5.0 mm is available from the detector characteris-tics [detector length in the z-direction: 5 mm; (2.5+ 1.5+1 mm); (1+1.5+2.5 mm); 5 mm], no SSP of 5.0 mm is available when a detector collimation of 5.0 mm is used. This is, however, possible with units A and C. For all the units, the use of a detector collimation of 2.0 or 2.5 mm allows the reconstruction of a 5.0-mm-slice thick-ness for any pitch value chosen (0.75–0.85 or 1.25–1.5).
The data presented in Table 3 show that z-filtering of the data does not always lead to an SNR improvement. The statistical analysis of the data shows that, of the four units studied, the use of a smaller detector collimation than the reconstructed slice thickness was beneficial for one unit (A), had no effect on two units (B and D) and was detrimental for one unit (C), for a pitch value slight-ly less than unity for all the acquisitions. The detrimental effect observed for unit C might be explained by the fact that the 2.0-mm detector collimation used for this partic-ular unit involves smaller detector cells than the other units. The use of small detector cells improves the longi-tudinal resolution of the acquisitions, but may reduce the efficiency of the conversion of the detected X-ray pho-tons into signal. This behaviour should be carefully mon-itored, since reductions in the size of detector cells is a trend currently being pursued by manufacturers.
When Fig. 1a or 2a is compared with Fig. 3a, it seems that unit C performs better than the other units in terms of patient dose efficacy (i.e., gives a higher SNR than the other units for a given CTDIvol). This may be deceptive, since the SNR evaluation does not take into account the spatial frequency content of the image. In order to assess whether the filters applied to the data were comparable, Wiener spectra of the data were calculated. This allows the variance of the noise to be decomposed into spatial frequency components in order to verify if the data were low-pass filtered in different ways. Several behaviours were observed: for three of the four units, the filter used with a detector collimation of 2.0–2.5 mm and 5.0 mm was the same (units A, C and D); for the fourth unit (unit B), the manufacturer has increased the filtering of the
5.0 mm is selected. Comparing Fig. 1 and 3 shows that images produced on unit C are significantly more low-pass filtered than images produced on unit A. Note that, for the in-plane spatial resolution, the pixel size chosen during the acquisitions gives a Nyquist frequency of 0.71 mm−1[i.e., (1/2) × pixel size, which is 0.7 mm]— and so the different strategies adopted by manufacturers for data filtering might have an impact on in-plane reso-lution. The type of filtering used on unit C might be bet-ter than that used on unit A when dealing with the detec-tion of large low contrast structures, but may give less information than unit A when dealing with the detection of small high contrast structures.
The results obtained with a higher pitch value (to maintain comparable acquisition duration) and a small detector collimation or a 5.0-mm detector collimation are also unit dependent. For units A and B, it is better, in terms of SNR, to use a detector collimation of 2.5 mm and a pitch of 1.25 or 1.5 to get a 5.0-mm-slice thickness than to use a detector collimation of 5.0 mm with a pitch of 0.75 or 0.85. However, it must be noted that a higher filtering is applied to the data for unit B when the 2.5-mm detector collimation is used.
Conclusion
From the results presented in this study, it appears that no general conclusions can be drawn concerning the su-periority of the use of a smaller detector collimation than the reconstruction slice thickness for SNR. Moreover, this study has shown the limitations of SNR calculations based on a standard deviation calculation for evaluating the performances of different CT units. Such an ap-proach is, however, convenient when the aim of the study is restricted to patient dose optimization on a par-ticular system [15]. To fully understand the behaviour of the noise variations, the Wiener spectra should be evalu-ated to take into account the reconstruction kernel used during the processing of the data.
Acknowledgements The authors acknowledge Dr J.-L Dreyer (Neuchâtel, Switzerland), Drs A. Blum and T. Ludig (Nancy, France) and Dr F. Sadry (Givisier, Switzerland) for providing the machine time required to perform the study.
References
1. Kalender WA, Seissler W, Klotz E, Vock P (1990) Spiral volumetric CT with single-breath-hold technique, continuous transport, and continuous scanner rotation. Radiology
176:181–183
2. Liang Y, Kruger RA (1996) Dual-slice spiral versus single-slice spiral scan-ning: comparison of the physical per-formance of two computed tomography scanners. Med Phys 23:205–220 3. Hu H, He HD, Foley WD, Fox SH
(2000) Four multidetector-row helical CT: image quality and volume cover-age speed. Radiology 215:55–62
4. McCollough CH, Zink FE (1999) Per-formance evaluation of a multi-slice CT system. Med Phys 26:2223–2230 5. Hu H, Fox SH (1996) The effect of
he-lical pitch and beam collimation on the lesion contrast and slice profile in heli-cal CT imaging. Med Phys
6. Brooks RA, Di Chiro G (1976) Statisti-cal limitations in X-ray reconstructive tomography. Med Phys 3:237–240 7. Kalender WA, Schmidt B (2000)
Recent advances in CT: will doses go down or will they go up? Physica Medica 16:137–144
8. Hu H, Shen Y (1998) Helical CT re-construction with longitudinal filtra-tion. Med Phys 25:2130–2138 9. Hu H (1999) Multi-slice helical CT:
scan and reconstruction. Med Phys 26:5–18
10. Shin HO, Falck CV, Galanski M (2004) Low-contrast detectability in volume rendering: a phantom study on multide-tector-row spiral CT data. Eur Radiol 14(2):341–349
11. International Electrotechnical Committee (1994) Medical diagnostic X-ray equipment—radiation conditions for use in the determination of charac-teristics. Standard IEC #61267, Geneva 12. International Electrotechnical
Commit-tee (1999) Medical diagnostic X-ray equipment—particular requirements for the safety of X-ray equipment for CT 1999. Standard IEC #60601-2-44, Geneva
13. International Electrotechnical Commit-tee (2002) Medical diagnostic X-ray equipment—particular requirements for the safety of X-ray equipment for CT. Standard IEC #60601-2-44, Geneva
14. Dainty JC, Shaw R (1974) Image science. Academic, London
15. Greess H, Lutze J, Nomayr A, Wolf H, Hothorn T, Kalender WA, Bautz W (2004) Dose reduction in subsecond multislice CT examination of children by online tube current modulation. Eur Radiol 14(6):995–999