Integrated systems for forecasting urban meteorology, air pollution and population exposure
Texte intégral
Figure
Documents relatifs
Associ- ation between prenatal exposure to traffic-related air pollution and preterm birth in the PELAGIE mother–child cohort, Brittany, France. Does the urban–rural
Compared to previous urban economics literature with aggregate city-wide pollution (e.g. Verhoef and Nijkamp, 2003), we show that lower local traffic-induced air pollution differs
The main objective of this study is therefore to measure individuals' levels of exposure to air pollution and road traffic noise during rush hours in Montreal, according to three modes
Since an off-street bicycle path's proximity to the closest section of road can have a signi ficant impact on the levels of exposure to noise and air pollution, we created a variable
Average weekly traffic intensity and pollution parame- ters measured in Pista Silla
– Exposure to climate change and air pollution is linked to many signs of obstructive respiratory diseases (eg, asthma exacerbation), increased medication use, visits to
el, not only can short-term exposure to elevated concentrations of urban air pollutants exacerbate pre-existing asthma and allergic rhinitis but also long-term exposure to
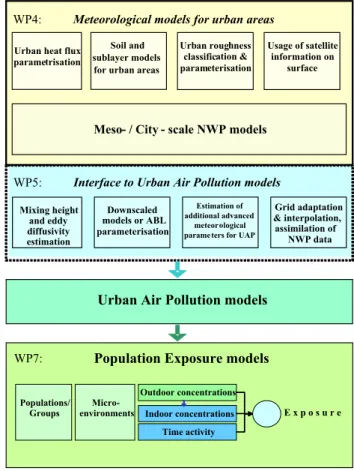
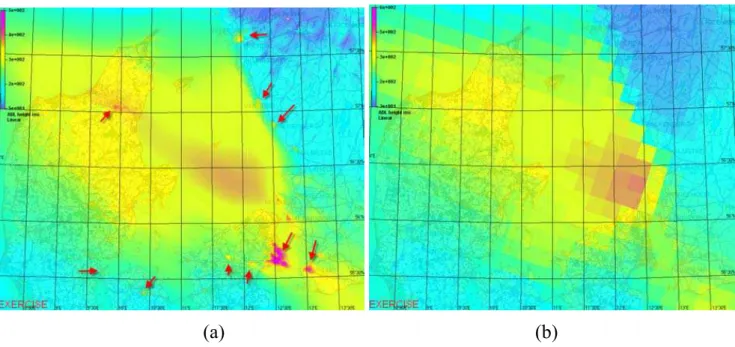
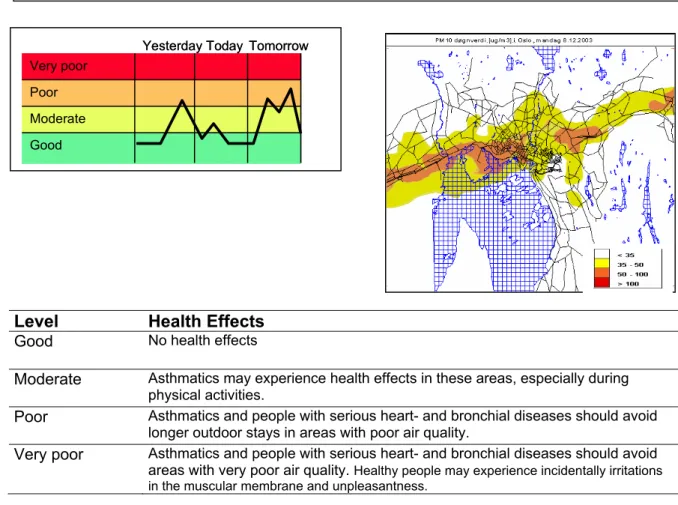
The strategy of new generation integrated Meso- Meteorological (MetM) and Atmospheric Chemical Transport Model (ACTM) systems suggest considering the urban air quality as a
