HAL Id: hal-00304954
https://hal.archives-ouvertes.fr/hal-00304954
Submitted on 1 Jan 2004HAL is a multi-disciplinary open access archive for the deposit and dissemination of sci-entific research documents, whether they are pub-lished or not. The documents may come from teaching and research institutions in France or abroad, or from public or private research centers.
L’archive ouverte pluridisciplinaire HAL, est destinée au dépôt et à la diffusion de documents scientifiques de niveau recherche, publiés ou non, émanant des établissements d’enseignement et de recherche français ou étrangers, des laboratoires publics ou privés.
Hydrological controls on denitrification in riparian
ecosystems
S. E. Machefert, N. B. Dise
To cite this version:
S. E. Machefert, N. B. Dise. Hydrological controls on denitrification in riparian ecosystems. Hydrology and Earth System Sciences Discussions, European Geosciences Union, 2004, 8 (4), pp.686-694. �hal-00304954�
Hydrological controls on denitrification in riparian ecosystems
S.E. Machefert
1and N.B. Dise
1,21Department of Earth Sciences, The Open University, Milton Keynes, MK7 6AA, UK 2Department of Biology, Villanova University, Villanova, PA 19085, USA
Email for corresponding author: [email protected]
Abstract
Nitrous oxide fluxes and denitrification rates were measured in situ over a year at a riparian site in the UK. An exponential relationship was found between denitrification rates and soil moisture, with a sharp increase in denitrification rate at a water-filled pore space of 6080%. Similar relationships were found in other studies compiled for comparison. The present study is unique in measuring denitrification in an intact ecosystem in the field, rather than in cores in the field or the lab. The exponential relationship between denitrification rate and soil moisture, with a threshold at 6080% water-filled pore space (2040% gravimetric moisture), has proven to be comparable across a wide range of ecosystems, treatments and study conditions. Whereas moisture content determines the potential for denitrification, the absolute rate of denitrification is determined by available nitrate (NO3), dissolved organic carbon and temperature. As a first approximation, denitrification
rates can be simply modelled by using a general exponential relationship between denitrification potential and water-filled pore space (or volumetric/gravimetric water content) multiplied by a constant value determined by the nitrogen status of the site. As such, it is recommended that the current relationship used in INCA to relate denitrification to soil moisture be amended to an exponential form, with a threshold of approximately 70% for the onset of denitrification.
Keywords: nitrous oxide, denitrification, soil moisture, nitrogen, eutrophication, riparian
Introduction
Denitrification is a biological process by which nitrogen is transferred from the soil to the atmosphere. This transfer is one of the principal mechanisms by which the environmental pollutant nitrous oxide (N2O) enters the atmosphere
(Bouwman, 1990). NO and N2O are intermediate products
of denitrification which may be further reduced to nitrogen gas. The net chemical reaction is:
NO3 ki NO2 i NO (gas) i N2O (gas) i N2 (gas) (1)
Only trace amounts of nitric oxide (NO) are usually produced and the main products are nitrous oxide (N2O)
and dinitrogen (N2), with different suites of micro-organisms
being involved in NO2 reduction and N2O reduction. N2O
is an important greenhouse gas: it contributes approximately 6% of the total effect of all anthropogenically-enhanced greenhouse gases to global warming (Denmead, 1991) and has a radiative forcing 180 times greater than carbon dioxide
(Mogge et al., 1998). However, denitrification in riparian soils may have the positive effect of reducing the hydrological export of reactive N to the river channel, especially in agricultural catchments that receive high loads of fertiliser N.
The first investigations of denitrification (Wijler and Delwiche, 1954; Nommik, 1956) focused on the individual effects of pH, nitrate concentration, the presence of an available energy source, soil water and temperature. Since then, research has intensified to determine relationships between denitrification and ranges of these driving variables, especially moisture content or water-filled pore space (defined with other hydrological terms in Table 1) (Robertson and Tiedje, 1984; Davidson and Swank, 1986; Groffman et al., 1991). The experimental study presented in this paper investigates the effects of soil water content on denitrification and the partition between the end products N2 and N2O in the field. Very few long-term studies of
Hydrological controls on denitrification in riparian ecosystems
none to the authors knowledge have been carried out in situ that is, studying the denitrification rates and environmental controls from intact ecosystems rather than cores placed in the field (Tiedje et al., 1989).
This study was undertaken to identify relationships between denitrification and environmental factors, ultimately to develop a catchment-scale model to simulate nutrient processes in the riparian zone. The INCA model (Integrated Nitrogen Model for European CAtchments; Whitehead et al., 1998) currently simulates denitrification but it was necessary to determine whether it is an adequate tool, and if not, how the simulation of denitrification in the riparian zone could be improved. The present representation of denitrification within INCA is a function of a soil-temperature-dependent parameter and two controlling factors: soil moisture deficit (SMD) and soil nitrate concentration (Eqn. [17], Wade et al., 2002; Wade, 2004). The value of the parameter is determined by calibration. A soil moisture threshold is also set by calibration in INCA.
The following objectives were addressed in this study: (a) What are the most important factors controlling the
denitrification rate of riparian zones receiving nitrate-rich agricultural runoff?
(b) Can a simple mathematical relationship be developed to describe these processes?
(c) Is the relationship derived using data collected in situ where the soil remained intact supported by the results
of other studies, where the measurements have been made on cores in the lab and in the field?
(d) Can these relationships be generalised into an equation or set of equations for use with INCA, or other models of riparian nutrient dynamics?
Materials and methods
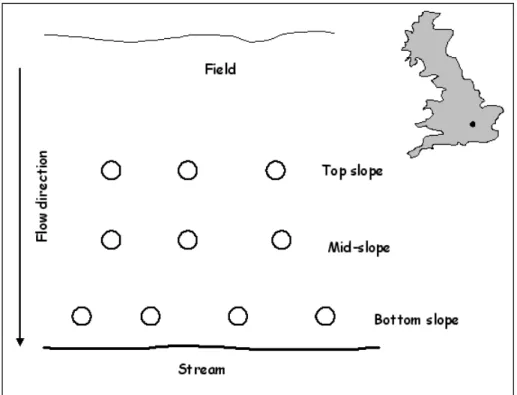
STUDY AREAThe experimental plot is within the Great Ouse river catchment (Fig. 1) in the UK. It is near the town of Chicheley, north-east of the city of Milton Keynes (52.33°N, 0.70°W). The site is a riparian ecosystem situated on an active farm and drains an agricultural field into a small stream, the Chicheley brook. The plot is characterised by a gradual slope (17%) to the stream and a long runoff from the field. The soil is from the Fladbury Series, a grey clayey pelo-alluvial gley with >50% clay in the plough layer (025 cm), and the soil pH (in H2O, 1:2.5) is 7.6.
Ten static chambers were installed at the site. The chambers were made of 30 cm diameter PVC rings inserted 5 cm deep in the topsoil at three levels above the stream surface. Four replicate chambers were installed near the stream, and three each at an intermediate zone and upslope (Fig. 1). N2O fluxes were determined using the closed
chamber technique (Hutchinson and Mosier, 1981). Three gas samples (20 ml each) were withdrawn from the Table 1. Definition of terms related to soil water content
Definition Mathematical expression
Gravimetric moisture Instantaneous water content of soils on a qg = [(g moist soil) (g dry soil)] / (g dry soil)
weight basis (g water/g dry soil)
Volumetric moisture Determination of the volume of water by qv = qg × Bulk Density
volume of soil (mL water/cm3 soil) with Bulk Density in g dry soil/cm3 soil
Time Domain Reflectometry (TDR) Measurement of the soil dielectric constant that is generally proportional to the water content. Gives the volumetric water content.
Water-Filled Pore Space Measurement of field water content. Gives % WFPS = [Pw × (BD / St)] × 100
the percentage of soil pores filled by water. with Pw = q¸g × 100, Bulk Density (BD) in
g dry soil/cm3 soil and Total porosity (S t) as %
Water Holding Capacity Amount of water held by the soil after the % WHC = [g water retained by soil × 100] / water held by this soil at field capacity has (g oven dry soil)
headspace using a 60 ml syringe (a) immediately after closing the chamber, (b) 30 minutes and (c) 60 minutes later. Before removing a sample in each case, the atmosphere in the chamber was mixed by pumping the syringe plunger six times. Each sample was injected into an evacuated container (Labco Exetainer, 10 ml).
The change in N2O concentration as a function of time
was used to calculate the emission rate of N2O. After the
first 60-minute sampling period, the chambers were left open for 30 minutes to allow the atmosphere of the chamber to return to ambient levels of N2O. After that, the chambers
were closed again and acetylene was added in the headspace to reach 10% of the volume delimited by the chamber. Such a level of acetylene inhibits the reduction of N2O to N2 in
the final step of the denitrification pathway (Eqn. 1). The acetylene was left to stand for two and a half hours, and three and a half hours following rainfall, to allow diffusion into the soil (Hutchinson and Mosier, 1981). After that time, the chambers were aerated for another 30 minutes before a second measurement of N2O fluxes was taken following the procedure described above. The amount of N2O
produced in the chambers atmosphere after the addition of acetylene corresponded to the total rate of denitrification (N2 + N2O). Ambient air samples were also taken at each
visit.
The Exetainers were transported to the laboratory and N2O
concentrations were determined using a gas chromatograph fitted with an electron capture detector and equipped with a PorapakQ, 50-80, 6ft column. The carrier gas (N2) flow
rate was 58 ml min1, the detector temperature was 320 oC,
and the injector and the oven were at 45 oC and 60 oC,
respectively.
The soil moisture content (% vol. TDR, 6 cm probe) was monitored on each sampling date. The soil temperature (10 cm deep) was also monitored. Total denitrification was measured on eight occasions during the period from 08/03/ 2002 to 09/04/2003 in each of the ten chambers.
DATA ANALYSES
The data were analysed by stepwise multiple regression and fitting empirical equations between denitrification rates and the relevant environmental factors. These results were compared with those from other studies in the literature. In a previous paper (Machefert et al., 2004), soil moisture was shown to be the main driving control on N2O emission
from Chicheley, with soil temperature and dissolved organic carbon of secondary importance. Nitrate was rarely if ever limiting in this well-fertilised site. Special emphasis has therefore been placed on the relationship between soil hydrology and denitrification in the current study.
Fig. 1. Diagram of experimental set-up and map location of the Chicheley site. The experimental plot is 6m x 7m, the circles represent the flux chambers.
Hydrological controls on denitrification in riparian ecosystems
COMPARISON WITH OTHER STUDIES
Six studies were used for comparison with the present findings, with focus on experiments undertaken in riparian ecosystems, whether they were forested, herbaceous or agricultural. The particular experiments were chosen because they were studies of denitrification and its controls (field or lab experiment on soil cores) and because they were long-term experiments (at least 12 months) or were a compilation of the results from a large number of samples analysed. As such, these studies provide a comparison with the measurements made in situ at Chicheley where the soil remained intact. The denitrification rates in all six studies were determined using the acetylene inhibition technique (Tiedje, 1994; Yoshinari et al., 1977). The soil moisture was expressed as water-filled pore space and gravimetric moisture content in five of the studies.
The soil moisture in the sixth study considered was expressed as a percentage of the water holding capacity (% WHC) and could not be changed to volumetric soil moisture content or water filled pore space. The data obtained in this study were based on sieved soil samples that were incubated in flasks. These could not be related to the WFPS of intact soil cores.
Results and discussion
RIPARIAN STUDYTotal denitrification rates at Chicheley were highest at the lower level nearest to the stream and decreased uphill away from the stream. This agrees with previous findings (Davidson and Swank, 1986; Groffman and Tiedje, 1989) and was expected, since rates of denitrification are known to be higher at higher moisture contents (Davidson, 1991). The soil at the lower level was always wet and sometimes waterlogged. Regular flooding events contributed to maintaining the high moisture content of the lower soil.
Water-filled pore space, soil nitrate, dissolved organic carbon (DOC) and soil temperature were included in a step-wise regression on the denitrification rates. The result showed that denitrification rates were best predicted by (1) water-filled pore space (p = 0.003, r2 = 0.31) and (2) soil
nitrate content (p = 0.01; cumulative r2 = 0.48). The equation
of the model is:
Denit. (mg N m-2 hr-1) = 0.214 + 5.23E-03 * WFPS (%)
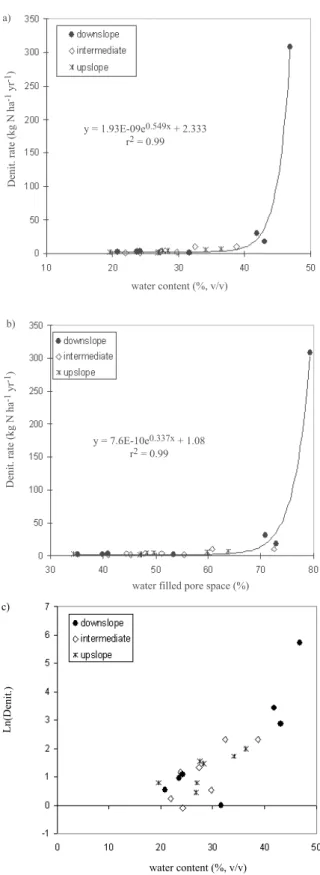
+ 4.27E-03 * soil nitrate (ppm in sol.) Figure 2 shows the relationship between denitrification rates and volumetric water content (2a) and between denitrification and water filled pore space (2b). Figure 2c
Fig. 2. Plot of total denitrification (kg N ha-1 yr-1) against (a)
volumetric soil moisture (%) and (b) water filled pore space (%WFPS) at the three different levels of the slope at the Chicheley study site. Exponential (black curve) is fitted to the whole of the data with an r2 = 0.99. (c) Natural logarithm of total denitrification
against volumetric soil moisture (%) at all three different levels of the slope at the Chicheley study site.
shows a plot of the natural logarithm of denitrification rate in relation to the water content of the soil studied (r2 = 0.84).
In Figs 2a and 2b, an exponential model was fitted to the experimental data, with a coefficient of determination of 0.99 for both models (y = 1.93E-09e0.549x + 2.333 and y =
7.6E-10e0.337x + 1.08, respectively). This confirms that a
threshold of moisture of about 6570% (WFPS) has to be reached for high denitrification rates to occur.
The moisture threshold between N emitted as N2O and N
emitted as N2 was determined at all three levels. For soil
volumetric water contents below 35%, gaseous N was emitted as 50% N2O and 50% N2 at the lower (N = 4),
intermediate (N = 5) and upper (N = 6) levels above the stream surface. Above this moisture level, the partition was 80% N2 and 20% N2O, 90% N2 and 10% N2O and 60% N2
and 40% N2O, at the lower (N = 4), intermediate (N = 3)
and upper (N = 2) level respectively. However, there was a large range in these estimates.
Similar annual denitrification fluxes of 5.0 and 4.8 kg N ha1 were estimated at the intermediate and upper levels
respectively, farthest from the stream surface where the moisture status of the soil was not significantly different. Similar results have been reported for other riparian ecosystems of low or fluctuating moisture status or low nitrate (e.g. Robertson and Tiedje, 1984). Annual denitrification at the near-stream site was 71.7 kg N ha1,
about 15 times higher than the two sites higher up the slope. This is due to a single high denitrification rate measured at the near-stream site. If this value was ignored, the annual denitrification at the near stream site would still be four to five times higher than that at the intermediate and upper sites. However, comparison of results with other studies suggests that this point should not be ignored. This point corresponds to the denitrification rates expected at higher WFPS (> c.70%).
COMPARISON WITH OTHER STUDIES
Ashby et al. (1998) reported a laboratory study of denitrification and its controls in riparian soils of three catchments located in the Catskill mountains, USA. (Fig. 3a). The catchments were forested and the primary cover type was sugar maple, beech and yellow birch (Acer saccharum, Fagus grandifolia, Betula alleghaniensis). Denitrification measurements were made as part of two soil surveys: (1) a surface survey including three poorly-drained surface soils and (2) a riparian sequence survey including both surface and sub-surface soils from edge, stream-bank and upland locations. Denitrification rate was measured in the lab on intact soil cores (584) sampled on 12 dates from May through October 1994 and in April and June 1995.
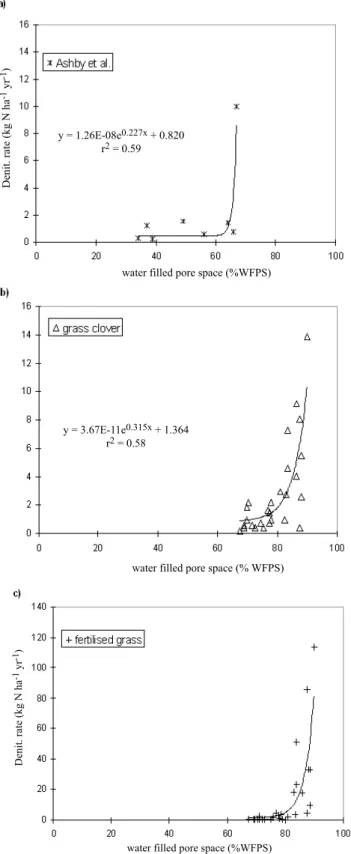
Fig. 3. Plot of total denitrification (kg N ha-1 yr-1) against water
filled pore space (%) (a) at the Chicheley site, (b) at the Ashby et al. (1998) site, (c) at the grass clover pasture in Ruz-Jerez et al. (1994) and (d) at the fertilised grass pasture described in Ruz-Jerez et al. (1994). Black curves are the exponential equations fitted to each dataset, equations and coefficients of determination are given on each plot.
Hydrological controls on denitrification in riparian ecosystems Figure 3a presents the median (25th and 75th percentiles)
denitrification rate for each one of the eight soil types in relation to the mean water-filled pore space. Soil samples that were collected in the spring, late summer and autumn of 1994 were incubated at 8° to 11°C, whereas those collected in the summer of 1994 and 1995 were incubated at room temperature (21° to 24°C). Volumetric soil moisture and denitrification rates were highest in seep and toeslope (saturated soils at the base of the slope) soils and lowest in upland soils. The soil moisture as % WFPS was related significantly to the denitrification rate (p = 0.008). Ashby et al. reported higher denitrification rates following precipitation but the limited data did not allow them to create any models.
Ruz-Jerez et al. (1994) reported a long-term measurement of denitrification in contrasting pastures: unfertilised perennial ryegrass/white clover (Fig. 3b) and fertilised ryegrass sward receiving 400 kg N ha1 yr1 (Fig. 3c). In
this experiment, total denitrification was determined using the soil core incubation system under field conditions (Ryden et al., 1987). The measurements took place between 12 September 1989 and 31 May 1991. The soil temperature during the denitrification study ranged from 10° to 24°C. Ruz-Jerez et al. (1994) observed a marked seasonal variation in denitrification, with the highest rates in late autumn were reported during spring and summer when temperatures were highest and soil moisture below field capacity. The results showed that when the soil moisture content was above field capacity for an extended period, denitrification rates increased. Another indication that the soil moisture played a significant role in controlling the rate of denitrification was that the emission rate dropped when the soil moisture content fell below the field capacity in late winter. The absolute rate of denitrification was much higher in the fertilised ryegrass pasture, probably due to the greater amount of nitrate available at the fertilised pasture (Ruz-Jerez et al., 1994).
The results from the studies by Ashby et al. (1998) in forests, Ruz-Jerez et al. (1994) in fertilised and unfertilised pasture, and at Chicheley (Fig 2b) in semi-natural streambank vegetation, measured at different temperatures, all show an exponential correlation between denitrification rate and water filled pore space, with a threshold WFPS at 6585%. Results from the present experiment at an undisturbed intact field site are similar to those of the other studies on soil cores incubated either in the lab or the field. The main difference between the studies is in the absolute rate of denitrification: it is about 20 times higher for Chicheley and the fertilised grass than for the two unfertilised sites. The difference in denitrification rates between the two sites from Ruz-Jerez et al. (1994) is a result
of the higher concentrations of nitrate in the fertilised system. This is also the case at the Chicheley site which drains an agricultural field receiving large amounts of fertilisers, so that nitrate concentrations are not limiting. Ashby et al. (1998) observed relatively low denitrification rates in relation to rates measured in other hardwood forests due to the soil characteristics (well-drained upland soils with shallow O horizons).
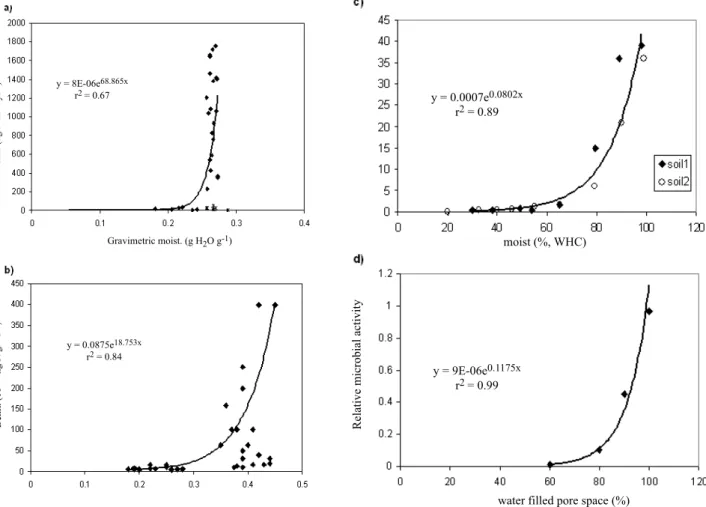
Four other studies of denitrification used parameters that could not be converted easily into either denitrification rate or water-filled pore space but are nonetheless useful for this data compilation. Henault and Germon (2000) presented a study of NEMIS, a predictive model of denitrification on the field scale, and the three-year database associated with the model development (Fig. 4a). The study site was a field in Citeaux, France that had been cultivated for more than 50 years. During the experiment, the field was cropped with winter wheat in 1991 (fertilisation 170 kg N ha1), spring
barley in 1992 (fertilisation 100 kg N ha1) and winter wheat
again in 1993 (fertilisation 170 kg N ha1). Denitrification
was measured in the laboratory on untreated soil cores and cores subjected to various treatments including addition of 500 ml of deionised water over 24 h followed by drainage over 24 h, addition of 500 ml of a 0.1 M KNO3 solution
(drop by drop over 24 h followed by drainage for 24 h) and addition of a series of nitrate solutions (500 ml) of increasing concentrations (0 to 0.1 M) without drainage. The incubations were carried out at 20 °C. The denitrification rates from the untreated cores ranged between 2.19 kg N ha1 yr1 and 32.8 kg N ha1 yr1. The denitrification rates
measured on the wetted cores (either water, or different concentrations of KNO3) were higher than those on untreated
cores on each occasion, ranging from 7.3 to 1825 kg N ha1 yr-1.
Figure 4a shows the relationship between denitrification rates and gravimetric moisture content from this study. The data show a moisture threshold at 25% (w/w) below which denitrification rates are very low and above which most measurements show high denitrification rates. An exponential relationship is fitted to these data. There are a few cases of low denitrification rates (below 73 kg N ha1
yr1) at moisture values above 25%. These were from the
zero nitrate addition wetted cores. It is possible that in these cores nitrate was too limiting for denitrification to occur.
Ettema et al. (1999) studied the response to surface nitrogen input of a poorly-drained riparian soil and the temporal changes in denitrification rates. The experiment was carried out in a 50-year-old riparian forest bordering a small stream, at the University of Georgia Coastal Plain Experimental Station in the Little River Watershed, USA (Fig. 4b). Denitrification rates were measured on soil
Fig. 4. (a) Denitrification rates (kg N ha-1 yr-1) versus gravimetric soil moisture (g H
2O g-1) from Henault and Germon (2000). An exponential
curve is fitted to the data (t), excluding points corresponding to gravimetric moistures above 0.25 with denitrification rates below 73 kg N ha-1
yr-1 (*), wetted cores with lowest nitrate contents, (b) Denitrification rates (10-12 kg N g-1 d-1) versus gravimetric soil moisture (g H
2O g-1) from
Ettema et al. (1999). The bold curve is fitted to the sites where oxidisable C is not limiting. (c) Denitrification rates (10-12 kg N g-1 d-1) versus
soil water holding capacity (%) from Bollman and Conrad (1998) and (d) Relationship between water filled pore space and relative microbial activity (interpreted as rate of denitrification by Mosier et al., 2002) from Linn and Doran (1984). a) to d) Black curves are exponential equations fitted to each dataset. Equations and coefficients of determination are given on each plot.
increments (2.5 cm diameter) from microcosms receiving different levels of N-addition and incubated at the ambient water content. Incubations were carried out in the laboratory at 25 °C. Soil moisture was determined gravimetrically. An exponential curve was fitted to those sites where the authors suggested oxidisable C was not limiting (Fig. 4b). Mean rates of denitrification in the control microcosms were ten-fold higher in the soils located closest to the stream with significantly higher moisture levels. N-addition hardly affected the low rates of the zone farthest from the stream, but significantly increased the rates measured at the near-stream zone (wetter sites).
Bollman and Conrad (1998) studied the influence of oxygen availability on N2O release by denitrification in soils
(Fig. 4c). They used sieved soil samples and it was not
possible to calculate the soil volumetric moisture content or water filled pore space. Instead, water holding capacity (WHC, defined in Appendix 1) is used. The soil samples were incubated at 25 °C. The two soils were agricultural soils, a luvisol (loamy silt) cropped with wheat (soil 1) and a cambisol (sandy silt) cropped with barley (soil 2). Again, denitrification rates were exponentially related to soil moisture contents, with a threshold at approximately 70% WHC. Both soils behaved similarly and so only one exponential curve has been fitted to the two.
Finally, Mosier et al. (2002) described the role of denitrification in the nitrogen economy of crop production and the environment in an overview of denitrification in soils and how to manage it. They presented a general relationship between soil water-filled pore space and
Hydrological controls on denitrification in riparian ecosystems microbial denitrification rates, adapted from Linn and Doran
(1984) who conducted a lab-incubation study (soil cores) to examine the effect of a range of WFPS values on soil microbial activity (Fig. 4d). The cores were incubated at 20 to 22 °C. Mosier et al. (2002) concluded that the relative activity of anaerobic denitrification is negligible at 60% water-filled pore space but increases with increasing water and reaches a maximum at saturation. Their general relationship also shows a threshold for denitrification at approximately 70% WFPS.
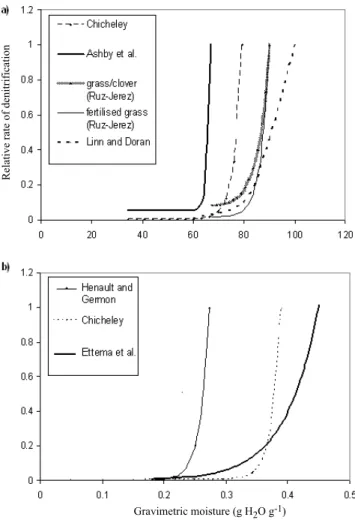
Even though the soil moisture characterisation differed between these experiments and the present study, as well as the previous studies described (Ashby et al., 1998 and Ruz-Jerez et al., 1994), all results agree that denitrification rates are related exponentially to soil moisture. In addition, comparable studies (Figs. 3 and 4) show approximately the same threshold values (6080% WFPS; 2530% gravimetric moisture) where denitrification rates increase exponentially. To compare the different exponential curves fitted to the different datasets considered in this study, the rates of denitrification were scaled to the maximum value measured (Fig. 5). In Figs. 5a and 5b all curves have a similar shape, showing negligible rates of denitrification until a threshold value of the water-filled pore space or gravimetric moisture is reached, above which denitrification increases sharply. This value ranges between 60 and 80% of water-filled pore space and (less clearly) 2040% of gravimetric moisture. The actual value within this range depends upon the complex interaction of factors, such as antecedent rainfall, water residence time, or soil texture. Figures 35 suggest, however, that moisture is the main driving force determining the potential for denitrification, whereas the absolute rate of denitrification is determined primarily by the available NO3
at the site and secondarily by temperature and DOC.
Conclusion
The result from a step-wise regression showed that the best model for denitrification in the riparian ecosystem included water-filled pore space and soil nitrate as the main explanatory variables. Denitrification rates measured in an intact riparian site at Chicheley brook were correlated exponentially to the water-filled pore space of the soil. This result is in agreement with studies from a wider variety of different ecosystems using soil cores incubated either in the field or the lab. All studies showed similar threshold values of soil moisture (6080% WFPS; 2040% gravimetric moisture), but different absolute rates of denitrification. The absolute rates were related to the soil NO3 concentration
fertilised sites showed denitrification rates approximately 20 times higher than unfertilised. This suggests that denitrification rates can be modelled relatively simply by using a general exponential relationship between denitrification rate and water-filled pore space (or volumetric/gravimetric water content) multiplied by a constant value depending upon the nitrogen status of the site. This study also showed that for soil volumetric water contents below 35%, gaseous N was emitted as 50% N2O
and 50% N2 at the lower, intermediate and upper levels above
the stream surface. Above this moisture level, the partition was 80% N2 and 20% N2O, 90% N2 and 10% N2O and 60%
Fig. 5. (a) Exponential relationships between the relative rate of denitrification (no unit) and the water-filled pore space (% WFPS) for the following studies: Chicheley, Ashby et al. (1998), a grass/ clover pasture (Ruz-Jerez et al., 1994), a fertilised grass pasture (Ruz-Jerez et al., 1994) and Linn and Doran (1984). The curves are redrawn from the exponentials fitted to the datasets from Figs. 2b, 3 a-d and 4c and the different absolute amounts of denitrification are scaled to the maximum value measured. (b) Exponential
relationships between the relative rate of denitrification (no unit) and the gravimetric moisture content (g H2O g-1) for the following
studies: Henault and Germon (2000), Ettema et al. (1999) and Chicheley. The curves are redrawn from the exponentials fitted to the datasets from Figs. 2b and 4 a and b and the different absolute amounts of denitrification were scaled to the maximum value measured.
N2 and 40% N2O, at the lower, intermediate and upper level
respectively. However, there was a high variability within these estimates. Based on this study, it is suggested that the denitrification equations in INCA should be modified so that the relationship between denitrification and soil moisture has an exponential form. It is also recommended that direct soil moisture measurements be substituted for the normalised soil moisture deficit currently used in INCA and that the soil moisture threshold be set at approximately 70%. This would constrain the model based on observed data.
Acknowledgements
This research is supported by the European Commission (Project EVK1-1999-00011), and the results are derived from collaborations between all project partners, listed on the project website: http://www.reading.ac.uk/INCA
References
Ashby, J.A., Bowden, W.B. and Murdoch, P.S., 1998. Controls on denitrification in riparian soils in headwater catchments of the hardwood forest in the Catskill Mountains, U.S.A. Soil Biol.
Biochem., 30, 853864.
Bollmann, A. and Conrad, R., 1998. Influence of O2 availability
on NO and N2O release by nitrification and denitrification in
soils. Global Change Biol., 4, 387396.
Bouwman, A.F., 1990. Soils and the greenhouse effect, Springer, New York, USA.103148.
Davidson, E.A., 1991. Fluxes of nitrous oxide and nitric oxide from terrestrial ecosystems. In: Microbial Production and
Consumption of Greenhouse gases: Methane, Nitrogen oxides and Halo-Methanes, J.E. Rogers and W.B. Whitman, (Eds.),
Amer. Soc. Microbiol., Washington, DC, USA. 219-235. Davidson, E.A. and Swank, W.T., 1986. Environmental parameters
regulating gaseous nitrogen losses from two forested ecosystems via nitrification and denitrification. Appl. Environ. Microbiol.,
52, 12871292.
Denmead, O.T., 1991. Sources and sinks of greenhouse gases in the soil-plant environment. Vegetatio, 91, 7386.
Ettema, C.H., Lowrance, R. and Coleman, D.C., 1999. Riparian soil response to surface nitrogen input: temporal changes in denitrification, labile and microbial C and N pools, and bacterial and fungal respiration. Soil Biol. Biochem., 31, 16091624. Groffman, P.M. and Tiedje, J.M., 1989. Denitrification in North
temperate forest soils: spatial and temporal patterns at the landscape and seasonal scales. Soil Biol. Biochem., 21, 613 620.
Groffman, P.M., Axelrod, E.A., Lemunyon, J.L. and Sullivan, W.M., 1991. Denitrification in grass and forest vegetated filter strips. J. Environ. Qual., 20, 671674.
Henault, C. and Germon, J.C., 2000. NEMIS, a predictive model of denitrification on the field scale. Eur. J. Soil Sci., 51, 257 270.
Hutchinson, G.L. and Mosier, A.R., 1981. Improved soil cover method for field measurements of nitrous oxide fluxes. Soil Sci.
Soc. Amer. J., 45, 311316.
Linn, D.M. and Doran, J.W., 1984. Effect of water-filled pore space on carbon dioxide and nitrous oxide production in tilled and non-tilled soils. Soil Sci. Soc. Amer. J., 48, 12671272. Machefert, S.E., Dise. N.B., Goulding, K.W.T. and Whitehead,
P.G., 2004. Nitrous oxide emissions from two riparian ecosystems: key controlling variables. Water Air Soil Pollut.:
Focus, 4, 427436.
Mogge, B., Kaiser, E.A. and Munch, J.C., 1998. Nitrous oxide emissions and denitrification N-losses from forest soils in the Bornhöved Lake region (Northern Germany). Soil Biol.
Biochem., 30, 703710.
Mosier, A.R., Doran, J.W. and Freney, J.R., 2002. Managing soil denitrification. J. Soil Water Conserv., 57, 505513.
Nommik, H., 1956. Investigations on denitrification in soil. Acta
Agr. Scand., 6, 195228.
Robertson, G.P. and Tiedje, J.M., 1984. Denitrification and nitrous oxide production in successional and old-growth Michigan forests. Soil Sci. Soc. Amer. J., 48, 383389.
Ruz-Jerez, B.E., White, R.E. and Ball, Roger, P., 1994. Long-term measurement of denitrification in three contrasting pastures grazed by sheep. Soil Biol. Biochem., 26, 2939.
Ryden, J.C, Skinner, J.H. and Nixon, D.J., 1987. Soil core incubation system for the field measurement of denitrification in grassland soils. Soil Biol. Biochem., 19, 753757.
Tiedje, J.M., 1994. Denitrifiers. In: Methods of Soil Analysis. Part
2. Microbiological and Biochemical Properties, R.W. Weaver,
J.S. Angle and P.S. Bottomley, (Eds.), Soil Sci. Soc. Amer., Madison, USA. 245267.
Wade, A.J., Durand, P., Beaujouan, V., Wessel, W.W., Raat, K.J., Whitehead, P.G., Butterfield, D., Rankinen, K. and Lepisto, A., 2002. A nitrogen model for European catchments: INCA, new model structure and equations. Hydrol. Earth Syst. Sci., 6, 559 582. (See also Errata. Hydrol. Earth Syst. Sci., 8, 858859.) Whitehead, P.G., Wilson, E.J. and Butterfield, D., 1998. A
semi-distributed Integrated Nitrogen model for multiple source assessment in Catchments (INCA): Part I model structure and process equations. Sci. Total Environ., 210/211, 547558. Wijler, J. and Delwiche, C.C., 1954. Investigations on the
denitrifying process in soil. Plant Soil, 5, 155169.
Yoshinari, T., Hynes, R. and Knowles, R., 1977. Acetylene inhibition of nitrous oxide reduction and measurement of denitrification and nitrogen fixation in soil. Soil Biol. Biochem.,