HAL Id: hal-00298169
https://hal.archives-ouvertes.fr/hal-00298169
Submitted on 18 Jan 2007HAL is a multi-disciplinary open access
archive for the deposit and dissemination of sci-entific research documents, whether they are pub-lished or not. The documents may come from teaching and research institutions in France or abroad, or from public or private research centers.
L’archive ouverte pluridisciplinaire HAL, est destinée au dépôt et à la diffusion de documents scientifiques de niveau recherche, publiés ou non, émanant des établissements d’enseignement et de recherche français ou étrangers, des laboratoires publics ou privés.
Thermal log analysis for recognition of ground surface
temperature change and water movements
M. Verdoya, P. Chiozzi, V. Pasquale
To cite this version:
M. Verdoya, P. Chiozzi, V. Pasquale. Thermal log analysis for recognition of ground surface temper-ature change and water movements. Climate of the Past Discussions, European Geosciences Union (EGU), 2007, 3 (1), pp.95-120. �hal-00298169�
CPD
3, 95–120, 2007
Thermal log analysis for recognition of ground surface temperature change M. Verdoya et al. Title Page Abstract Introduction Conclusions References Tables Figures ◭ ◮ ◭ ◮ Back Close
Full Screen / Esc
Printer-friendly Version Interactive Discussion
Clim. Past Discuss., 3, 95–120, 2007 www.clim-past-discuss.net/3/95/2007/ © Author(s) 2007. This work is licensed under a Creative Commons License.
Climate of the Past Discussions
Climate of the Past Discussions is the access reviewed discussion forum of Climate of the Past
Thermal log analysis for recognition of
ground surface temperature change and
water movements
M. Verdoya, P. Chiozzi, and V. Pasquale
Dipartimento per lo Studio del Territorio e delle Sue Risorse, Settore di Geofisica, Universit `a di Genova, Viale Benedetto XV 5, 16132 Genoa, Italy
Received: 22 December 2006 – Accepted: 8 January 2007 – Published: 18 January 2007 Correspondence to: M. Verdoya ([email protected])
CPD
3, 95–120, 2007
Thermal log analysis for recognition of ground surface temperature change M. Verdoya et al. Title Page Abstract Introduction Conclusions References Tables Figures ◭ ◮ ◭ ◮ Back Close
Full Screen / Esc
Printer-friendly Version Interactive Discussion
Abstract
A joint analysis of surface air temperature series recorded at meteorological stations and temperature-depth profiles logged in near-by boreholes was performed to estimate conditions existing prior to the beginning of the instrumental record in central-northern Italy. The adopted method considers conductive and advective heat transport in a hori-5
zontally layered medium and provides simultaneous estimates of the pre-observational temperatures and the Darcy velocities. The reconstruction of the ground surface tem-perature history using an inversion method was performed for boreholes where hy-drological disturbances to measured temperature logs were proved to be negligible. Both methods revealed generally coherent climatic changes in the whole investigated 10
area. Climatic conditions were generally warm and comparable with the reference pe-riod 1960–1990. The absence of the Little Ice Age in the middle ages seems to be a generic feature of the climate in central-northern Italy. Climate change of the 19th century was generally insignificant with well balanced periods of cold and warmth. The investigated area became significantly colder only at the end of the 19th century. Cool-15
ing culminated around 1950 when it was replaced by rapid warming. Recent warming was not inferred only for one of the investigated holes. This discrepancy can be at-tributed to local environmental conditions.
1 Introduction
The temperature variation at the Earth’s surface can, to some extent, propagate down-20
wards, sensibly affecting the underground temperature structure, which is mainly con-trolled by the terrestrial heat flow. Temperature-depth profiles measured within the uppermost hundred meters thus provide an archive of past climatic changes. Inversion of borehole geothermal data can reveal the ground surface temperature (GST) history (see e.g. Beltrami and Harris, 2001; Pasquale et al., 2005a, and references therein). 25
Another method to unravel the climate changes from geothermal data is based on the 96
CPD
3, 95–120, 2007
Thermal log analysis for recognition of ground surface temperature change M. Verdoya et al. Title Page Abstract Introduction Conclusions References Tables Figures ◭ ◮ ◭ ◮ Back Close
Full Screen / Esc
Printer-friendly Version Interactive Discussion
joint processing of surface air temperature (SAT) recorded at meteorological observa-tories and borehole temperature profiles to obtain the pre-observational mean temper-ature (POM), against which the recent climate changes can be referenced (Chisholm and Chapman, 1992; Harris and Chapman, 1998; Pasquale et al., 1998). This method is based on the hypothesis that, on the long temporal scale, the mean annual GST 5
tracks the mean annual SAT.
The foregoing past climate reconstruction techniques has been, so far, based on the assumption of negligible hydrological activity at the investigated boreholes, i.e. a pure conductive heat transfer. In practice, screening of the geothermal data is performed before processing, and only undisturbed data or thermal logs corrected for the hydro-10
logical disturbances are used for climatic reconstructions. Because of the general lack of satisfactory hydrological information in the majority of the borehole sites, the screen-ing procedure is not an easy task. Recent investigations (Ferguson et al., 2003; Reiter, 2005; Majorowicz and Safanda, 2005; Verdoya et al., 20071) recognised the strong correlation between SAT and GST variations, but also stressed the role of subsurface 15
flow, which may alter or mimic the climatically produced signal. Moreover, it was ar-gued that some of the previous GST reconstructions were carried out without sufficient justification of the absence of groundwater flow.
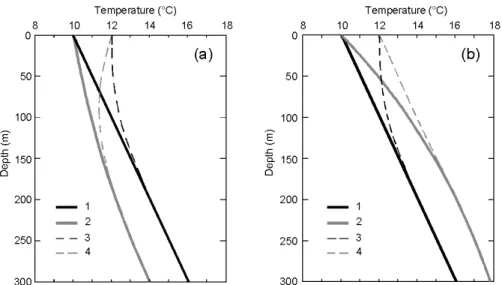
Figure 1 illustrates with a theoretical example how vertical flow in a permeable rock may disturb the conductive geotherm. Hydraulic disturbances may produce a distortion 20
of geotherms similar to that caused by a climatic change (see e.g. Bodri and Cermak 2005 for details). Recharge (downward ground water movement) results in concave upward temperature-depth profiles, while discharge (upward flow) creates an opposite effect. Relatively high Darcy velocities (±10−8m s−1) emphasize the effect of water flow. However, Lewis and Wang (1992), investigating a set of boreholes located in a 25
relatively small area (Lac Dufault, Canada), showed that even small water flows can produce large uncertainty in the inference of the onset of recent warming.
1
Verdoya, M., Chiozzi, P., Pasquale V., and Robbiano, F.: Inferring hydro-geothermal param-eters from advectively perturbed thermal logs, Int. J. Earth Sci., in review, 2007.
CPD
3, 95–120, 2007
Thermal log analysis for recognition of ground surface temperature change M. Verdoya et al. Title Page Abstract Introduction Conclusions References Tables Figures ◭ ◮ ◭ ◮ Back Close
Full Screen / Esc
Printer-friendly Version Interactive Discussion
Bodri and Cermak (2005) proposed a new method which incorporates advective dis-turbances due to vertical ground water flow in the usual conductive approach for POM estimates. A series of tests both on synthetic and field examples indicated that inclu-sion of advective heat transfer in the inference of the POM temperature can provide more reliable estimates, thus making possible to use for past temperature reconstruc-5
tions a vast amount of previously rejected temperature logs. Since no direct hydroge-ological information is often available for a geothermal borehole, the foregoing method can be also used for testing the magnitude of ground water flow.
In this work we apply such an advective/conductive approach for the past climate reconstruction to a set of temperature-depth profiles, which were rejected in previous 10
studies on climate change in central-northern Italy (Pasquale et al., 2000 and 2005a), because more or less affected by perturbations due to ground water. The identification of the past climate changes in this area by using only meteorological data is problematic because of the relative shortness of the time series, the sparse spatial arrangement of the existing SAT records and the possible presence of hidden heterogeneities in the 15
SAT series. Data from nearby boreholes not affected by groundwater disturbances were used for the verification of the obtained results.
2 Thermal records
The selected dataset consists of seven temperature–depth profiles recorded in bore-holes located in the Ligurian-Tyrrhenian side of the Apennines chain, Italy, four (GH9– 20
GH12) in the central sector and three (GH13–GH15) in the northern part. The bore-holes were drilled both for studies of surface heat-flow density and exploration of geothermal resources and water. They are situated in the vicinity of some boreholes (GH1, GH3 and GH4) unaffected by advective perturbations, which were analysed in previous papers (Pasquale et al., 2000; Bodri et al., 2003; Pasquale et al., 2005a). 25
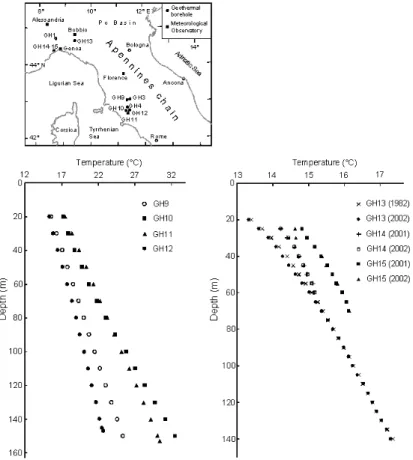
Table 1 shows geographic coordinates and date of logging of the boreholes. The temperature-depth distributions of the seven boreholes are shown in Fig. 2.
CPD
3, 95–120, 2007
Thermal log analysis for recognition of ground surface temperature change M. Verdoya et al. Title Page Abstract Introduction Conclusions References Tables Figures ◭ ◮ ◭ ◮ Back Close
Full Screen / Esc
Printer-friendly Version Interactive Discussion
2.1 Central sector
The boreholes GH9–GH12 were drilled in a region of remarkable interest for geother-mal energy, and characterized, on the regional scale, by high terrestrial heat flow values (>100 mW m−2). GH10–GH12 are very close one to each other and situated within a few kilometres from the well-known Larderello geothermal field. The hole GH9 is about 5
35 km far from the three hole cluster. The available temperature-depth profiles, to-gether with those previously analysed from boreholes GH3–GH4, form a robust dataset to characterize climatic changes in a relatively wide area of the central Tyrrhenian side. Temperatures were measured to a maximum depth of 155 m depth with a sampling interval of 10 m (Baldi et al., 1994). The holes GH9–GH11 penetrated clayey strata, 10
while the stratigraphy in the borehole GH12 consists of shales, limestones and marly limestones. High values of heat flow (80–160 mW m−2) were inferred in these bore-holes.
No hydrologeological information is available for the area surrounding the investi-gated holes. Thus, the preliminary considerations about the possible presence of 15
groundwater flow can be done only on the base of indirect information. The holes are located in a relatively elevated terrain. Water flow through pores and/or small frac-tures might be driven either by hydraulic head differences or free convection resulting from the 10–20 K temperature differences between the hole top and bottom (Fig. 2) that can produce variations in the fluid density of 2–4.5 kg m−3. Geothermal observations 20
and model calculations showed that such a flow is generally very slow, especially in clayey rocks, which are characterised by low hydraulic conductivity (see e.g. Bodri and D ¨ov ´enyi, 2004, and references therein).
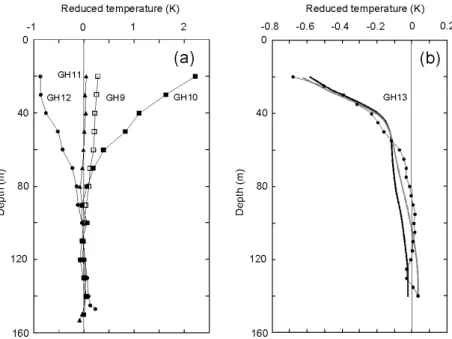
The temperature perturbations in the measured profiles caused by climate change were estimated from the analysis of the reduced temperatures, defined as the de-25
parture of the observed temperature-depth data from the steady-state conditions (e.g. Chisholm and Chapman, 1992). These departures decrease with depth, being the lowermost section of temperature-depth profiles assumed to be in thermal
CPD
3, 95–120, 2007
Thermal log analysis for recognition of ground surface temperature change M. Verdoya et al. Title Page Abstract Introduction Conclusions References Tables Figures ◭ ◮ ◭ ◮ Back Close
Full Screen / Esc
Printer-friendly Version Interactive Discussion
librium. Figure 3a shows reduced temperatures for the holes GH9–GH12 while Ta-ble 2 displays the parameters of the steady-state temperature field, calculated from the lowermost parts of the measured temperature logs by the standard linear regression technique.
Apparently, three boreholes denote recent warming, which seems clearer in the 5
borehole GH10, whereas the reduced temperature of GH12 shows cooling. Since climatic changes from different sites in a relatively small area are expected to be co-herent, the presence of hydrogeological disturbances is highly probable.
2.2 Northern sector
Borehole GH13 was drilled for heat flow studies within homogenous claystone strata. 10
Temperature was measured to 143 m depth with a 5 m reading interval with a preci-sion temperature acquisition system with a 4-wire shielded cable and equipped with a Pt-resistance sensor with a total system uncertainty of 0.01–0.03◦C. Since the first temperature logging in 1982, the hole was periodically monitored, and the last tem-perature profile was carried out in 2002 (Fig. 2). No appreciable temtem-perature variation 15
during this relatively long time period has been observed, and the data indicate recent cooling, which appears even more evident in the reduced temperature plot (Fig. 3b). Also the parameters extrapolated from the lowermost part of the measured tempera-ture logs are almost coinciding (To=13.54 and 13.56◦C, Go=27.05 and 26.75 mK m−1
for the 1982 and 2002 logs, respectively). 20
Boreholes GH14 and GH15 were logged both in April 2001 and January 2002 (Fig. 2). Temperatures were measured with the same equipment used for GH13, down to 60 and 70 m depth, respectively, with reading interval of 5 m. GH14 crossed mainly marls with a thin narrow layer of alternating marls and sandstones from 33 to 38 m depth. GH15 penetrated mostly conglomerates with an intercalated thin layer of marls 25
and sandstone between 28–30 m and serpentinite at 69 m depth. Both pairs of tem-perature logs coincide well, except for the uppermost part of the GH15 log, where temperatures recorded in January 2002 are lower, probably due to meteoric water
CPD
3, 95–120, 2007
Thermal log analysis for recognition of ground surface temperature change M. Verdoya et al. Title Page Abstract Introduction Conclusions References Tables Figures ◭ ◮ ◭ ◮ Back Close
Full Screen / Esc
Printer-friendly Version Interactive Discussion
filtration within the fractured conglomerate. Since both boreholes are very shallow, in principle only the most recent climatic signal can be recovered. Moreover, the steady-state surface temperature To and the unperturbed temperature gradient Go cannot be
extrapolated from the lower part of the measured temperature logs, but they must be estimated together with the other unknown parameters, namely the POM-value and 5
the Darcy velocity.
3 SAT data
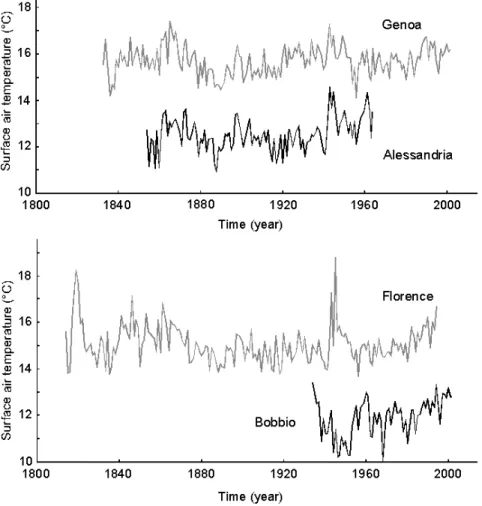
Four time series of annual surface air temperature (SAT) were used as forcing functions for estimating POMs as well as for the verification of the reconstructed GST histories (Fig. 4). The longest records are available for the stations located in Genoa (1833– 10
2002) and Florence (1814–1994). Shorter series were are available for Alessandria (1854–1964) and Bobbio (1934–2002). Details on data homogenisation, updating and improvement are scattered in several papers (see Pasquale et al., 2005a and refer-ences therein). We performed additional tests by means of diagrams of year-by-year variability (see Bodri and Cermak, 2003 for a description of the method). Variability 15
is sensitive to artificial changes, such as changes in observational procedures, station relocations, etc. (Moberg et al., 2000). Thus, variograms can be used as a diagnostic tool in searching for non-climatic biases in instrumental temperature series. At all me-teorological stations temperature oscillations are highly variable, warming and cooling trends often alternating. However, our analysis did not reveal any peculiarity, i.e. sud-20
den changes in the variogram trends that could be attributed to non-climatic effects. A slight decrease in temperature variability since 1950s is common, and it was observed in many European SAT series (Moberg et al., 2000; Bodri and Cermak, 2003).
Generally temperature measurements at a given meteorological station are repre-sentative of an extensive area. Thus, POMs can be estimated from SAT data recorded 25
at observatories which need not to be so close to the investigated boreholes. However, in the Italian peninsula, the barrier effect of the N–S trending Apennines ridge and the
CPD
3, 95–120, 2007
Thermal log analysis for recognition of ground surface temperature change M. Verdoya et al. Title Page Abstract Introduction Conclusions References Tables Figures ◭ ◮ ◭ ◮ Back Close
Full Screen / Esc
Printer-friendly Version Interactive Discussion
destabilising effect of the Mediterranean Sea are the two main geographical factors that imply strong effects of the local air circulation, resulting in high spatial climate variability (Pasquale et al., 2005b).
According to Hansen and Lebedeff (1987), for station pairs with at least 50 years of common records, selected randomly among stations at latitudes between 23.6◦N 5
and 44.4◦N, and from 44.4◦N to 64.2◦N, the correlation coefficient of the annual mean temperature variation is larger than 0.5 if distances for each direction, defined by 45◦ intervals, are less than 750 and 1250 km, respectively. At middle and high latitudes the correlation approaches unity as the stations separation becomes small. In Italy the area size for which a given station data may provide significant information on tem-10
perature change is smaller and substantially depends on direction. The correlation between SAT series from Florence and Genoa (about 200 km apart) is 0.70. Alessan-dria, Bobbio and Genoa observatories are arranged as a triangle with 50–60 km long sides. Nevertheless, due to the position of the stations with respect to the Apennines watershed, the correlation of Genoa and Alessandria SAT series is 0.66 and only 0.21 15
for Genoa and Bobbio. This fact demonstrates the need of a careful choice for the SAT series to be used as forcing functions in POM calculations.
4 Climate change reconstructions
We used the approach described by Bodri and Cermak (2005) for the joint estimation of the POM temperature and the vertical velocity of fluid migration. The thermal effect 20
of flow is analysed in the 1-D case by taking into account both conductive and advec-tive heat transfer in a layered medium. The unknown parameters, POM temperature and fluid vertical velocity, can be obtained by comparing the reduced temperatures with synthetic temperature logs calculated using SAT record as an upper boundary condition. We used the steepest descent algorithm minimizing the sum of squared dif-25
ferences between measured and calculated reduced temperatures. The most reliable values of POM and ground water velocity are those corresponding to the minimum root
CPD
3, 95–120, 2007
Thermal log analysis for recognition of ground surface temperature change M. Verdoya et al. Title Page Abstract Introduction Conclusions References Tables Figures ◭ ◮ ◭ ◮ Back Close
Full Screen / Esc
Printer-friendly Version Interactive Discussion
mean square (rms) misfit.
The adopted method can be applied only if permeability does not exceed a criti-cal value of 1–5×10⁻¹⁵m2. At higher permeability, upward flow would cause surface warming-up, thus violating the chosen upper boundary condition. The flow velocity corresponding to the critical permeability can be easily estimated since it is linearly 5
scaled to surface hydraulic head. At hydraulic heads characteristic for the investigated area, the maximum flow velocities that could provide reliable POM values amount to 1–5×10⁻⁹m s−1.
For the boreholes where advective disturbances resulted of minor or negligible im-portance, we also reconstructed the GST history by means of the inversion method 10
described by Bodri and Cermak (1995), which is based on a 1-D purely conductive thermal regime in a heat-source free, layered medium. This method does not impose any explicit constraints on the GST history and assumes thermal properties and basal heat flow density to be known. The surface temperature history is approximated by a series of unequal time intervals of constant temperatures which represent unknowns 15
of the problem. The time discretization is performed with a resolution matrix, and the width of time steps generally increases going back in time. This allows the compen-sation of the decrease in resolution with time. Even a relatively complicated and long GST history can be approximated by a limited number of parameters, without losing details of the recent climate change.
20
4.1 POM temperatures and Darcy velocity
The POM analysis for boreholes GH9–GH12 was made by using the mean annual temperatures measured at the Florence meteorological station as representative SAT record. This time series shows warm conditions from 1814 to 1870, a cold period from 1880s to 1940s, and very high temperatures between 1940 and 1950, followed by a 25
short period (1953–1957) with the lowest temperatures. Since then, gradual warming has been occurring at a rate of 0.039 K yr−1. The mean temperature in the 1960–1990
reference period is 15.02◦C.
CPD
3, 95–120, 2007
Thermal log analysis for recognition of ground surface temperature change M. Verdoya et al. Title Page Abstract Introduction Conclusions References Tables Figures ◭ ◮ ◭ ◮ Back Close
Full Screen / Esc
Printer-friendly Version Interactive Discussion
Results of POM estimations for the four boreholes of the central sector of Italy are summarized in Table 2. Results show that the effect of water movement is almost neg-ligible in boreholes GH9 and GH11. Noticeable downward flow was inferred in GH10 and GH12. The pre-observational mean temperature estimated using a pure conduc-tive approach (POMc) is 0.52 K higher than that obtained with a conductive/advective
5
model (POMa). In the boreholes GH9 and GH11, the POMa values agree well with
those obtained assuming purely conductive heat transfer. The boreholes GH9–GH11 give mean temperatures prior to 1814 which are comparable with the average temper-ature of the reference period, i.e. long-term pre-observational conditions similar to the 1960–1990 decades.
10
Table 3 shows the POM temperatures obtained considering SAT data only since 1900. These results, representing the long-term pre-observational conditions before the beginning of the 20th century, are in substantial agreement with those obtained using the entire SAT time series, thus indicating that climatic conditions have been relatively constant throughout the 19th century. In other words, the 19th century does 15
not contain definite trends, with well balanced periods of cold and warmth.
The POM value for GH12 is more than 1◦C higher than that inferred for the other
boreholes independently on which SAT time series (Florence or Genoa) is adopted as a forcing function. This is probably due to a too high flow velocity (upward), which causes violation of the assumed upper boundary temperature conditions, rather than 20
a really occurred climatic change. The estimated fluid velocity is almost similar in both the SAT hypotheses. The largest differences were obtained for GH10 and GH12. This implies possible small variations of permeability with time which may either decrease or increase because of mineral precipitation or solutional phenomena (see e.g. Fetter, 1988 for a review).
25
POM calculations for borehole GH13 were based on the SAT time series from the nearby Bobbio observatory. The low correlation between the SAT records measured at Bobbio and Genoa and the position of the two stations, at the Ligurian coast and in the Apennines chain, respectively, imply large climatic differences and argue against the
CPD
3, 95–120, 2007
Thermal log analysis for recognition of ground surface temperature change M. Verdoya et al. Title Page Abstract Introduction Conclusions References Tables Figures ◭ ◮ ◭ ◮ Back Close
Full Screen / Esc
Printer-friendly Version Interactive Discussion
use of the longer Genoa SAT series as forcing function for GH13. POM was estimated both for the 1982 and 2002 borehole temperature log.
For a conductive/convective thermal regime, the estimated POM, representing the long-term surface temperature before 1934, is 12.03±0.02◦C for the 1982 thermal log and 12.57±0.05◦C for the most recent record. The reference mean temperature 5
(1970–2000) for the Bobbio series is 12.25◦C. This implies that the long-term temper-atures before 1930s was from slightly lower to similar to the last 30 year average. The 1934–1950, 1950–1970 and 1970–1990 mean SATs at Bobbio were 11.50, 11.66 and 12.00◦C, respectively. Thus, significant cooling occurred between 1934 and 1950, and since 1970 the temperature achieved almost the same level of the period prior to 1934. 10
Moreover, our calculations indicate only a slight upward flow for the borehole GH13, at a rate of 0.14–0.21×10⁻⁹m s−1. This conclusion is corroborated by the POM estimated with a purely conductive approach, which gives a long-term average of 11.99±0.03◦C and 12.02±0.04◦C for the 1982 and 2002 thermal logs, respectively.
These POM values fall within the error bars or are very close to values calculated 15
using the conductive/advective analysis. The observed reduced temperature are well matched by the temperature calculated both with the pure conductive and the conduc-tive/advective approach (Fig. 3b), and rms misfits are low (0.056 and 0.038 K, respec-tively).
POM calculations for the boreholes GH14 and GH15 were made on basis of the 2002 20
thermal logs. The SAT records of the meteorological observatory of Genoa located in the vicinity of these boreholes were used as a forcing function. The rms misfit for the borehole GH14 is low (0.06 K). However, our POM estimates give a very high value (16.50◦C) that implies a temperature prior to 1833 of 0.68 K higher to the average (15.82◦C) of the period 1970–2000. Even if such a POM is well comparable to that 25
inferred by Pasquale et al. (2000) from a nearby borehole, the inferred Darcy velocity is so high (–2.02×10⁻⁸m s−1) and the depth of the borehole so shallow that this result should be treated with caution.
Calculations for the borehole GH15 give a non-unique solution with rms minima cor-105
CPD
3, 95–120, 2007
Thermal log analysis for recognition of ground surface temperature change M. Verdoya et al. Title Page Abstract Introduction Conclusions References Tables Figures ◭ ◮ ◭ ◮ Back Close
Full Screen / Esc
Printer-friendly Version Interactive Discussion
responding to high flow velocity (>10−9m s−1). This result agree with the temperature fluctuations observed between the 2001 and 2002 thermal logs and points to the pos-sibility of intensive water flow which may render our approach inapplicable.
4.2 GST histories
Figure 5 shows GST histories obtained from inversion of the thermal logs of the holes 5
GH9, GH11 and GH13, in which the effect of water movement is practically negligi-ble. The results are compared with previous reconstructions obtained by Pasquale et al. (2005a) for neighbouring holes (GH1, GH3, and GH4) with another inversion tech-nique.
The GST histories of GH9 and GH11 show a similar trend. Because of the rela-10
tively shallow depth of the measured temperature logs, climatic changes cannot be resolved before 1500 AD. The boreholes recorded a warm period from 1700 to 1850, followed by cooling from 1890 to 1970. The temporary temperature increase in 1940s, clearly visible in the Florence SAT records, was probably too short to be resolved with inversion. Before the 18–19th century, temperatures were generally higher and sim-15
ilar to conditions occurred in the 1960-1990 reference period. This corroborates the results obtained with the POM technique. The more recent climatic changes shown by the GST history curves, i.e. a rapid warming detected in all boreholes since about 1950–1970, are coherent with the temperature increase observed in Florence.
Figure 5 also shows a comparison of the GST histories obtained from the logs 20
recorded in 1982 and 2002 in the borehole GH13 with that inferred by Pasquale et al. (2005a) for the borehole GH1 which is about 50 km apart. High coincidence of GSTs reconstructed from “old” and “new” temperature logs significantly increases the confi-dence of the reconstructed climatic histories. The three boreholes show a coherent climatic signal until 1950, namely slightly colder conditions before the 16–17th century, 25
a temperature increase of 0.4–0.6 K until 1880, followed by cooling. The warmer cli-mate inferred for the period before the second half of the 20th century is in agreement
CPD
3, 95–120, 2007
Thermal log analysis for recognition of ground surface temperature change M. Verdoya et al. Title Page Abstract Introduction Conclusions References Tables Figures ◭ ◮ ◭ ◮ Back Close
Full Screen / Esc
Printer-friendly Version Interactive Discussion
with the POM results for the same borehole. After 1940–1950, the GST histories of GH13 and GH1 show an opposite trend. Cooling continues in the former borehole, whereas a warming was inferred in the latter.
5 Discussion and conclusions
Hydraulic disturbances in the temperature-depth profiles recorded in boreholes can be 5
of help in groundwater studies for the estimation of flow parameters (see e.g. Ander-son, 2005). Conversely, a significant number of available borehole temperature data has been so far considered of no use for studies on climatic changes, because they were suspected of being biased by groundwater flow. This severe selection reduced noticeably the number of boreholes suitable for processing and resulted in numerous 10
“blanks” in the climatic change maps, even in areas where extensive borehole logging was performed.
Kohl (1998) made a first attempt to include also boreholes disturbed by water circula-tion in the climate studies by taking into account the combined effect of conductive heat transfer and advection in a transient state. He demonstrated that, with the exception of 15
some extreme cases, such as strong topography change or advection, the climatic sig-nal cannot be totally masked by hydraulic flow and can be successfully recovered from the temperature logs. On the other hand, if thermal data are affected by advection, the paleoclimate reconstructions from a purely conductive approach may be seriously biased even in the case of a strong climatic signal (Lewis and Wang, 1992).
20
The analysis technique adopted in this paper provides further constraints to the cli-matic reconstruction in central-northern Italy using a set of temperature logs more or less affected by perturbations due to water circulation. The method used for the POM estimation is applicable for low-medium permeability and for relatively small hydraulic gradients, i.e. Darcy velocities of about 10−9m s−1. These values are well below the 25
velocity obtained for the borehole GH15, whose POM temperature may be thus by 1–1.5 K above its true value.
CPD
3, 95–120, 2007
Thermal log analysis for recognition of ground surface temperature change M. Verdoya et al. Title Page Abstract Introduction Conclusions References Tables Figures ◭ ◮ ◭ ◮ Back Close
Full Screen / Esc
Printer-friendly Version Interactive Discussion
On the other hand, the method of joint estimation of POM-temperature and vertical velocity of ground water permits also the recognition of possible hydraulic disturbances from the analysis of precision temperature logs in areas where no hydrogeological information is available. The used 1-D mathematical treatment might seem an over-simplification. A uniform, vertical flow is common in actual hydrogeological systems 5
only at recharge and discharge areas, and the fluid velocity can be also a function of depth. Reiter (2001) showed the need of considering the effect of 2-D movement in the analysis of the steady-state temperature profiles to estimate groundwater velocities.
However, most of the heat transfer in hydrogeological systems is due to vertical ad-vection/conduction (Domenico and Palciauskas, 1973), and a horizontal flow is not a 10
first-order concern in the POM estimation. In low porosity environments with insignif-icant fracturing, the horizontal and vertical fluid soaking is expected to occur at rates of the same order of magnitude. On the other hand, in an almost flat layered medium the horizontal temperature gradients are considerably lower than the geothermal gradi-ents. Accordingly, horizontal flow rates must be proportionally larger than vertical flow 15
rates to have similar impact in the advective term of the heat transfer equation. Thus, the POM estimates correspond to the real values in areas with principally vertical flow, and may differ by two to three-tenth of degree in areas where a significant horizontal velocity component exists (Bodri and Cermak, 2005).
Our climatic reconstructions deduced with the POM technique argue against a clear 20
evidence of the Little Ice Age in the central sector of Italy. This find a confirmation also in the GST curves obtained for boreholes GH9 and GH11. In the area under investigation, only the temperature decrease in the 19th century could be related to this period. The same result was also obtained with the analysis of a different set of boreholes by Bodri et al. (2003) and Pasquale et al. (2005a). The high coherence of the 25
GST histories reconstructed for the Ligurian-Tyrrhenian side implies that this feature is typical for the whole investigated area and does not represent an artefact of the GST inversion.
The set of tree-rings reconstructions of the middle-ages temperature including the 108
CPD
3, 95–120, 2007
Thermal log analysis for recognition of ground surface temperature change M. Verdoya et al. Title Page Abstract Introduction Conclusions References Tables Figures ◭ ◮ ◭ ◮ Back Close
Full Screen / Esc
Printer-friendly Version Interactive Discussion
Marseille-Rome-Alps area revealed at least six episodes, two-three decade long, with oscillating climatic conditions from 1600 to 1800 AD (Serre-Bachet, 1994). The periods 1600–1630, 1650–1685 and 1710–1740 were characterized by warm to very warm climate. Because of the well known decrease in resolution of the GST method into the past (e.g. Bodri and Cermak, 1995 and references therein), well balanced temperature 5
variations can result in smoothed GST curves (Fig. 5).
On a shorter time scale, SAT oscillations may be not properly archived in the ground temperatures. This seems to occur for the results of inversion of the borehole GH13. The SAT time series of Bobbio shows cooling trend of –0.14 K yr−1until 1950, and slight warming (0.017 K yr−1) since then. This warming did not represent one way story, but 10
was accompanied by a number of provisional returns to colder conditions. This kind of cyclic signal can hardly be recovered from inversion (Pasquale et al., 2005a). The SAT series from Alessandria and Genoa also exhibit a cold episode between 1940 and 1960 with cooling rates comparable to Bobbio (i.e.: –0.13 K yr−1). However, the subsequent warming at these sites was rather constant (0.016 K yr−1 in Genoa). The 15
observed discrepancy in the GST histories and in the SAT series can be generally due to a variety of factors, such as variations of the agricultural activity or vegetation cover and urbanization in the surroundings of the borehole site. The borehole GH13 located in a rural area, and except for the last twenty years, no detailed information is available about changes in land use. However, regional scale records exhibit a general 20
tendency to a strong reduction of cultivated areas and, consequently, an increase in natural vegetation, which might explain the different evolution of the local climate.
In conclusion, the application of the conductive/advective analysis for POM estima-tions shows that method allows the possibility to include some of the previous rejected temperatures logs available for central-northern Italy for the paleoclimate analysis. This 25
significantly increases the geothermal database suitable for the climate reconstruc-tion and thus ensures more detailed knowledge of the past climate changes in the areas were independent climatic information is not available. The obtained results suggest that even advectively distorted borehole temperature log may still contain a
CPD
3, 95–120, 2007
Thermal log analysis for recognition of ground surface temperature change M. Verdoya et al. Title Page Abstract Introduction Conclusions References Tables Figures ◭ ◮ ◭ ◮ Back Close
Full Screen / Esc
Printer-friendly Version Interactive Discussion
valuable signal, which can be used in paleoclimate reconstruction to assess the POM-temperatures. Moreover, when independent hydrogeological information is not avail-able, it can help to objectively distinguish boreholes characterised by a purely con-ductive thermal regime, whose temperature log can be subsequently inverted for the reconstruction of the GST history.
5
The results obtained for the set of boreholes scattered in the Ligurian-Tyrrhenian side of the Apennines chain indicate that the 19th century does not contain definite trends, with periods of cold and warmth well balanced in the long time scale. A similar result was obtained for borehole GH1 (Pasquale et al., 2005a). The “quiet” 19th century (at least after 1814) is probably characteristic for the whole Ligurian-Tyrrhenian side. 10
Our paleoclimatic reconstructions indicated warmer conditions preceding the period of meteorological observations in the area and comparable with the reference period of 1960–1990, cooling that began since 1850 and continued up to 1950, and warming since then. This general climatic course appears to be common for the whole central-northern Italy. Generally, cold climate is characteristic only for the mid 19th – mid 15
20th centuries. The apparent absence of the cold period in the middle ages, Little Ice Age, can be attributed to high variability in the area under investigation. This variability results also from independent climatic proxies such as tree-ring reconstructions. It is also appears that the recent climatic episodes have partly a local origin and can obscure the changes forced by the regional atmospheric circulation.
20
Acknowledgements. We thank L. Bodri for her fundamental contribution to an earlier version of
the manuscript and S. Bellani for making available original temperature logs.
References
Anderson, M. P.: Heat as a ground water tracer, Ground Water, 43(6), 951–968, 2005.
Baldi, P., Bellani, S., Ceccarelli, A., Fiordalisi, A., Squarci, P., and Taffi, L.: Nuovi dati geotermici
25
nelle aree a Sud-Est ed a Sud del campo geotermico di Travale (Toscana), Atti del 13◦ Convegno GNGTS, CNR, Roma, 211–221, 1994.
CPD
3, 95–120, 2007
Thermal log analysis for recognition of ground surface temperature change M. Verdoya et al. Title Page Abstract Introduction Conclusions References Tables Figures ◭ ◮ ◭ ◮ Back Close
Full Screen / Esc
Printer-friendly Version Interactive Discussion
Beltrami, H. and Harris, R. H. (Eds.): Inference of climate change from geothermal data (Spe-cial Issue), Global Planet. Change, 29, 149–348, 2001.
Bodri, L., Chiozzi, P., Pasquale, V., and Verdoya, M.: Last 1000 years climate reconstruction inferred from geothermal measurements in Italy, Proceedings of the 2nd Int. Conf. European Soc. for Environmental History, Prague 2003, 16–22, 2003.
5
Bodri, L. and Cermak, V.: Climate changes in the last millennium inferred from borehole tem-peratures: results from the Czech Republic – part I, Global Planet. Change, 11, 111–125, 1995.
Bodri, L. and Cermak, V.: High frequency variability in recent climate and the north Atlantic oscillation, Theor. Appl. Climatol., 74, 33–40, 2003.
10
Bodri, L. and Cermak, V.: Borehole temperatures, climate change and pre-observational sur-face air temperature mean: allowance for hydraulic conditions, Global Planet. Change, 45, 265–27, 2005.
Bodri, L. and D ¨ov ´enyi, P.: Climate change of the last 2000 years inferred from borehole tem-peratures: data from Hungary, Global Planet. Change, 41, 121–133, 2004.
15
Chisholm, T. J. and Chapman, D. S.: Climate change inferred from analysis of borehole tem-peratures: an example from western Utah, J. Geophys. Res., 97, 14 155–14 175, 1992. Domenico, P. A. and Palciauskas V. V.: Theoretical analysis of forced convective heat transfer
in regional ground-water flow, Geol. Soc. Am. Bull., 84, 3803–3814, 1973.
Ferguson, G., Woodbery, A. D., and Matile, G. L. D.: Estimating deep recharge rates beneath
20
an interlobate moraine using temperature logs, Ground Water, 41, 640–646, 2003. Fetter, C. W.: Applied Hydrology, 2nd Edition, Macmillan New York, 592, 1988.
Hansen J. and Lebedeff, S.: Global trends of measured surface air temperature, J. Geophys. Res., 92, 13 345–13 372, 1987.
Harris, R. N. and Chapman, D. S.: Geothermics and climate change: Part 2. Joint analysis of
25
borehole temperature and meteorological data, J. Geophys. Res., 103, 7371–7383, 1998. Kohl, T.: Paleoclimatic temperature signals – can they be washed out?, Tectonophysics, 291,
225–234, 1998.
Lewis, T. J. and Wang, K.: Influence of terrain on bedrock temperatures, Global Planet. Change, 98, 87–100, 1992.
30
Majorowicz, J. and Safanda, J.: Measured versus simulated transients of temperature logs – a test borehole climatology, J. Geophys. Eng., 2, 1–8, 2005.
Moberg, A., Jones, P. D., Barriendos, M., Bergstr ¨om, H., Camuffo, D., Cocheo, C., Davies, T.
CPD
3, 95–120, 2007
Thermal log analysis for recognition of ground surface temperature change M. Verdoya et al. Title Page Abstract Introduction Conclusions References Tables Figures ◭ ◮ ◭ ◮ Back Close
Full Screen / Esc
Printer-friendly Version Interactive Discussion
D., Demar ´ee, G., Martin-Vide, J., Maugeri, M., Rodriguez, R., and Verhoeve, T.: Day-to-day temperature variability trends in 160- to 275-year-long European instrumental records, J. Geophys. Res., 105, 22 849–22 868, 2000.
Pasquale, V., Verdoya, M., and Chiozzi, P.: Climate change from meteorological observations and underground temperatures in Northern Italy, Stud. Geophys. Geod., 42, 30–40, 1998.
5
Pasquale, V., Verdoya, M., Chiozzi, P., and Safanda, J.: Evidence of climate warming from underground temperatures in NW Italy, Global Planet. Change, 25, 215–222, 2000.
Pasquale, V., Verdoya, M., Chiozzi, P., Bodri, L., and Bellani, S.: Temperature signal in the underground for climate history reconstruction in Italy, Global Planet. Change, 47, 36-50, 2005a.
10
Pasquale, V., Verdoya, M., and Chiozzi P.: Orographic influence on the central-northern Italy climate from underground temperatures, Croatian Meteorol. J., 30, 669–671, 2005b.
Reiter, M.: Using precision temperature logs to estimate horizontal and vertical groundwater flow components, Water Resour. Res., 37, 663–674, 2001.
Reiter, M.: Possible ambiguities in subsurface temperature logs – consideration of groundwater
15
flow and groundsurface temperature change, Pure Appl. Geophys., 162, 343–355, 2005. Serre-Bachet, F.: Middle ages temperature reconstructions in Europe, a Focus on Northeastern
Italy, Clim. Change, 26, 213–224, 1994.
CPD
3, 95–120, 2007
Thermal log analysis for recognition of ground surface temperature change M. Verdoya et al. Title Page Abstract Introduction Conclusions References Tables Figures ◭ ◮ ◭ ◮ Back Close
Full Screen / Esc
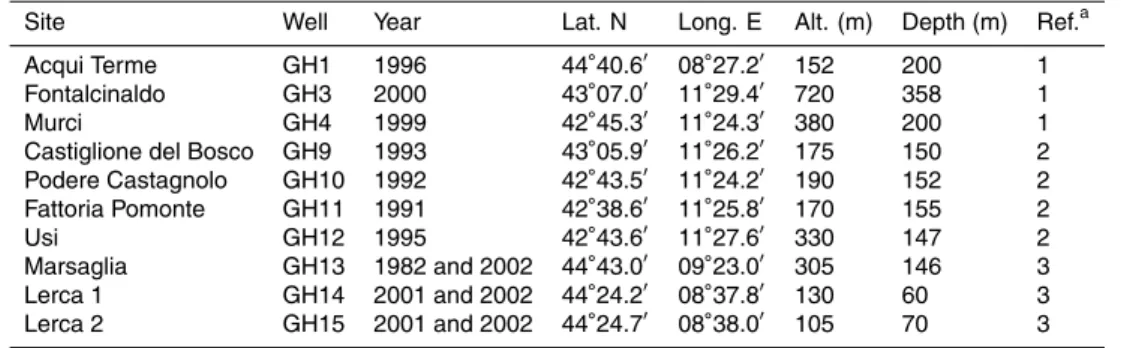
Printer-friendly Version Interactive Discussion Table 1. List of the boreholes located in Fig. 2 together with time of the temperature
measure-ments.
Site Well Year Lat. N Long. E Alt. (m) Depth (m) Ref.a
Acqui Terme GH1 1996 44◦40.6′ 08◦27.2′ 152 200 1
Fontalcinaldo GH3 2000 43◦07.0′ 11◦29.4′ 720 358 1
Murci GH4 1999 42◦45.3′ 11◦24.3′ 380 200 1
Castiglione del Bosco GH9 1993 43◦05.9′ 11◦26.2′ 175 150 2
Podere Castagnolo GH10 1992 42◦43.5′ 11◦24.2′ 190 152 2 Fattoria Pomonte GH11 1991 42◦38.6′ 11◦25.8′ 170 155 2 Usi GH12 1995 42◦43.6′ 11◦27.6′ 330 147 2 Marsaglia GH13 1982 and 2002 44◦43.0′ 09◦23.0′ 305 146 3 Lerca 1 GH14 2001 and 2002 44◦24.2′ 08◦37.8′ 130 60 3 Lerca 2 GH15 2001 and 2002 44◦24.7′ 08◦38.0′ 105 70 3 a
1, Pasquale et al. (2005a); 2, Baldi et al. (1994); 3, this paper.
CPD
3, 95–120, 2007
Thermal log analysis for recognition of ground surface temperature change M. Verdoya et al. Title Page Abstract Introduction Conclusions References Tables Figures ◭ ◮ ◭ ◮ Back Close
Full Screen / Esc
Printer-friendly Version Interactive Discussion Table 2. Pre-observational mean temperatures before the year 1814 for pure conductive
ap-proach (POMc) and for conductive and advective approach (POMa) and the corresponding
ground water velocity v (negative value corresponds to upward flow).
Borehole To(◦C) G o(mK m−1) POMc(◦C) POMa(◦C) v (10−9m s−1) GH9 13.7 77.3 15.01 15.07 –0.03 GH10 12.3 134.5 15.17 14.65 0.28 GH11 15.4 97.7 15.03 15.00 0.01 GH12 15.2 49.2 16.02 16.77 –0.79
To, temperature at zero depth, Go, temperature gradient
CPD
3, 95–120, 2007
Thermal log analysis for recognition of ground surface temperature change M. Verdoya et al. Title Page Abstract Introduction Conclusions References Tables Figures ◭ ◮ ◭ ◮ Back Close
Full Screen / Esc
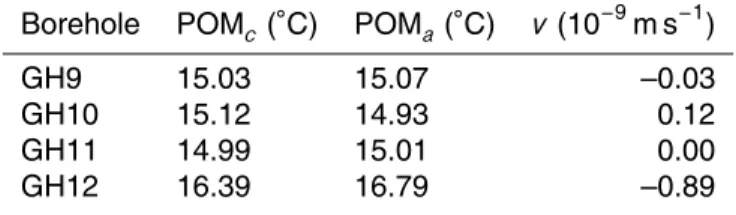
Printer-friendly Version Interactive Discussion Table 3. The same as Table 2, with POM temperatures before 1900.
Borehole POMc( ◦ C) POMa( ◦ C) v(10−9m s−1) GH9 15.03 15.07 –0.03 GH10 15.12 14.93 0.12 GH11 14.99 15.01 0.00 GH12 16.39 16.79 –0.89 115
CPD
3, 95–120, 2007
Thermal log analysis for recognition of ground surface temperature change M. Verdoya et al. Title Page Abstract Introduction Conclusions References Tables Figures ◭ ◮ ◭ ◮ Back Close
Full Screen / Esc
Printer-friendly Version Interactive Discussion Fig. 1. Models of temperature-depth profiles illustrating deviations from a pure conductive
geotherm caused by a GST change combined with downward (a) and upward (b) ground wa-ter flow. Thermal regimes: 1) conductive, 2) advective, 3) conductive climatically perturbed, 4) advective plus climatic effect. Model parameters: thermal diffusivity 31.5 m2yr−1, ther-mal conductivity 2.5 W m−1K−1, conductive temperature gradient 20 mK m−1, Darcy velocity 2.0×10⁻⁹m s−1(negative upward), porosity 1%. The climate perturbation is produced by a 2 K increase of GST occurred 100 years ago.
CPD
3, 95–120, 2007
Thermal log analysis for recognition of ground surface temperature change M. Verdoya et al. Title Page Abstract Introduction Conclusions References Tables Figures ◭ ◮ ◭ ◮ Back Close
Full Screen / Esc
Printer-friendly Version Interactive Discussion Fig. 2. Location of borehole sites and meteorological stations in the central-northern Italy,
and temperature-depth distributions of the boreholes. The position of boreholes analysed in previous studies (GH0–GH4) is also shown.
CPD
3, 95–120, 2007
Thermal log analysis for recognition of ground surface temperature change M. Verdoya et al. Title Page Abstract Introduction Conclusions References Tables Figures ◭ ◮ ◭ ◮ Back Close
Full Screen / Esc
Printer-friendly Version Interactive Discussion Fig. 3. Reduced temperatures for boreholes GH9–GH12 (a) and GH13 (b). The best fit
cal-culated temperatures are shown for GH13: black curve, pure conductive; grey curve, conduc-tive/advective approach.
CPD
3, 95–120, 2007
Thermal log analysis for recognition of ground surface temperature change M. Verdoya et al. Title Page Abstract Introduction Conclusions References Tables Figures ◭ ◮ ◭ ◮ Back Close
Full Screen / Esc
Printer-friendly Version Interactive Discussion Fig. 4. Mean annual SAT at meteorological stations of Florence, Genoa, Alessandria and
Bobbio.
CPD
3, 95–120, 2007
Thermal log analysis for recognition of ground surface temperature change M. Verdoya et al. Title Page Abstract Introduction Conclusions References Tables Figures ◭ ◮ ◭ ◮ Back Close
Full Screen / Esc
Printer-friendly Version Interactive Discussion Fig. 5. GST histories for boreholes GH9, GH11 and GH13. Results for GH1, GH3 and GH4
from Pasquale et al. (2005a) are shown for comparison.