HAL Id: hal-02167392
https://hal.archives-ouvertes.fr/hal-02167392
Submitted on 7 Sep 2020
HAL is a multi-disciplinary open access archive for the deposit and dissemination of sci-entific research documents, whether they are pub-lished or not. The documents may come from
L’archive ouverte pluridisciplinaire HAL, est destinée au dépôt et à la diffusion de documents scientifiques de niveau recherche, publiés ou non, émanant des établissements d’enseignement et de
A Compilation of Silicon and Thirty One Trace
Elements Measured in the Natural River Water
Reference Material SLRS-4 (NRC-CNRC)
Delphine Yeghicheyan, Jean Carignan, Michel Valladon, Martine Le Coz,
Florence Le Cornec, Maryse Castrec-Rouelle, Michel Robert, Luc Aquilina,
Emmanuel Aubry, Carine Churlaud, et al.
To cite this version:
Delphine Yeghicheyan, Jean Carignan, Michel Valladon, Martine Le Coz, Florence Le Cornec, et al.. A Compilation of Silicon and Thirty One Trace Elements Measured in the Natural River Water Reference Material SLRS-4 (NRC-CNRC). Geostandards Newsletter, Wiley, 2001, 25 (2-3), pp.465-474. �10.1111/j.1751-908X.2001.tb00617.x�. �hal-02167392�
A
COMPILATION OF SILICIUM AND THIRTY ONE TRACE ELEMENTS MEASURED IN THE NATURAL RIVER WATER STANDARDSLRS-4
(NRC-CNRC)
Delphine Yeghicheyan1, Jean Carignan1, Michel Valladon2, Martine Bouhnik Le Coz3, Florence Le Cornec4, Maryse Castrec-Rouelle5, Michel Robert6, Luc Aquilina3, Emmanuel
Aubry5, Carine Churlaud6, Aline Dia3, Samuel Deberdt2, Bernard Dupré2, Rémi Freydier2, Gérard Gruau3, Odile Hénin3, Anne-Marie de Kersabiec5, Joël Macé3, Luc Marin1, Nicole
Morin3, Patrice Petitjean3 and Elodie Serrat3
1: CNRS-CRPG, Service d’Analyse des Roches et des Minéraux (SARM), 15, rue Notre Dame des Pauvres, BP 20, 54501 Vandoeuvre-lès-Nancy, France. e-mail: yeghi@crpg.cnrs-nancy.fr
2: Laboratoire de Géochimie, 38 rue des Trente-Six-Ponts, 31400 Toulouse Cédex, France. e-mail: valladon@lucid.ups-tls.fr
3: Géosciences Rennes, bd du Général Leclerc 35045 Rennes Cédex, France. e-mail: Martine.Bouhnik-Le-Coz@univ-rennes1.fr
4: IRD, Laboratoire des Formations Superficielles, 32 avenue Henri Varagnat, 93143 Bondy Cedex France. e-mail: Florence.le_Cornec@bondy.ird.fr
5: Laboratoire de Géochimie et Métallogénie, Université Pierre et Marie Curie, casier 124, Tour 26/16, 4 Place Jussieu, 75252 Paris Cédex, 05 France. e-mail: Maryse.CASTREC@cicrp.jussieu.fr
6: Centre Commun d’Analyses, Université de La Rochelle, 5 perspective de l’Océan, 17000 La Rochelle, France. e-mail: mrobert@univ-lr.fr
Keywords : river water reference material, ICP-MS, rare earth elements, trace elements The natural river water standard SLRS-4 (NRC-CNRC) has been routinely analysed for major
(Inductively Coupled Plasma-Mass Spectrometry). For silicium and thirty one trace elements (rare earth elements, Ag, B, Br, Cs, Ga, Ge, Li, P, Pd, Rb, Se, Th, Ti, Tl, W, Y and Zr), no certified values are assigned by NRC-CNRC. We propose some compilation values and related uncertainties according to the results obtained by the different laboratories.
Mots-clés : standard d’eau de rivière, ICP-MS, terres rares, éléments en traces
Le standard d’eau de rivière SLRS-4 (NRC-CNRC) est analysé régulièrement comme contrôle qualité par six laboratoires français étudiant les éléments majeurs et en traces dans les solutions naturelles. La plupart des mesures sont réalisées par ICP-MS (Inductively Coupled Plasma Mass-Spectrometry). Le silicium et 31 éléments en traces (terres rares, Ag, B, Br, Cs, Ga, Ge, Li, P, Pd, Rb, Se, Th, Ti, Tl, W, Y and Zr) ne sont pas certifiés par NRC-CNRC. Nous proposons des valeurs de compilation pour ces éléments ainsi que les
The natural river water standard SLRS-4 (prepared by the National Research Council-Conseil National de Recherches Canada) is widely used to control routine analysis by
geochemists and hydrogeologists. However, some trace elements, useful to trace sources and geochemical processes, have not been assigned certified values. The six participating French laboratories (The Service d’Analyse des Roches et des Minéraux of Nancy, the Geosciences laboratory of Rennes, the Laboratoire de Géochimie of Toulouse, the Laboratoire de
Géochimie et Métallogénie of the UPMC Paris, the Laboratoire des Formations Superficielles of IRD Bondy and the Centre Commun d’Analyses of La Rochelle) analysed routinely SLRS-4 by ICP-MS, ICP-AES and AAS as a control for the analysis of major and trace elements in water samples. In addition to the certified elements by NRC-CNRC and according to the aim of laboratories, uncertified elements are also measured in the reference water. Nor proficiency tests, neither interlaboratory schemes have been elaborated for this paper. The presented compilation only gathers two years of individual routine results and working values for uncertified elements are proposed.
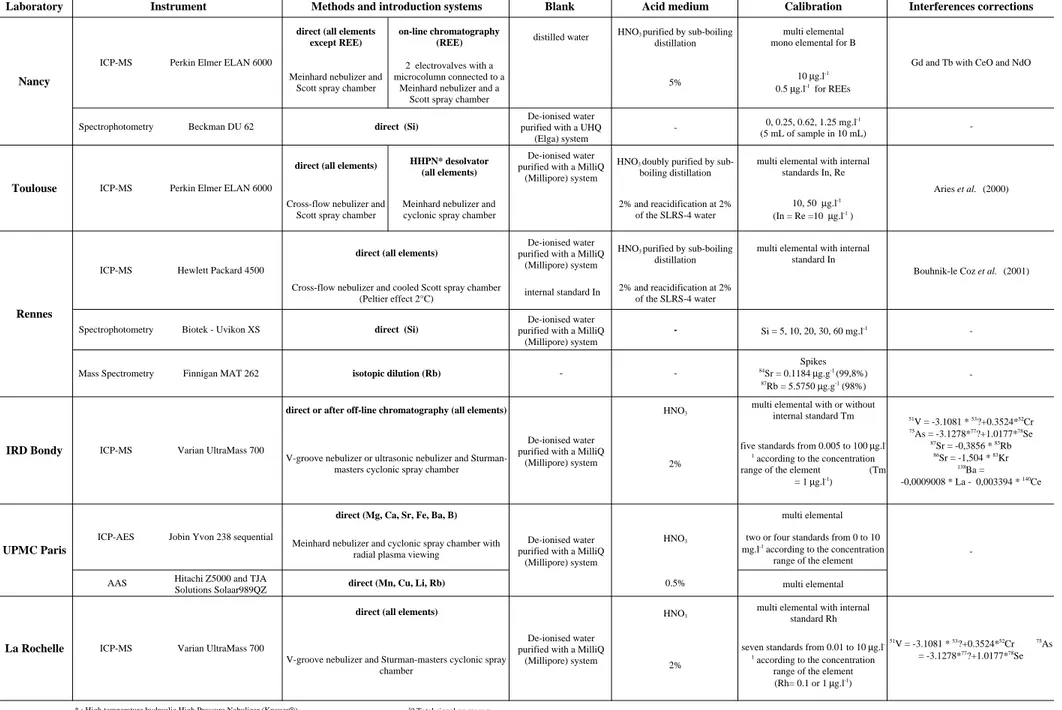
I. Instrumentation and statistical treatements
The equipment of each laboratory is reported in Table 1. Except for the UPMC laboratory, which used AAS and AES, all the other laboratories used quadrupole ICP-MS. The Rennes and Nancy laboratories also performed complementary analyses of Rb and Si using respectively isotope dilution TIMS and spectrophotometry. The instrument operating
substracted blanks, the acid molarity of the analysed solutions and the calibration methods were specific for each laboratory. A desolvator (High temperature hydraulic High Pressure Nebulizer) is used by the laboratory of Toulouse for some trace elements. This method was described in Jakubowski et al. (1992) and Berndt et al. (1996). The on-line liquid
chromatography used by the team of Nancy is described in detail in this volume (Carignan et
al., 2001). Oxides and doubly charged ions were less than 3% and the different laboratories
have applied oxide and hydroxide interference corrections (Le Cornec et al., 1999; Aries et
al., 2000; Bouhnik-Le Coz et al., 2001). Wavelengths without spectral interferences were
used by the UPMC Paris laboratory with the optical techniques. Some of these corrections are reported in Table 1.
Calibrations were done using synthetic multi elemental solutions except for B concentration measurements performed in Nancy, for which this laboratory used a mono elemental B standard solution, as described in Rose et al. (2000). Some laboratories corrected the instrumental drift by adding an internal standard to samples such as In (Rennes), In and Re (Toulouse), Tm (IRD Bondy) and Rh (La Rochelle). When no internal standard is used (Nancy and IRD Bondy), the eventual drift is controlled by measuring the standard solution
every 4-5 samples. Blanks and acids are consigned in Table 1: blanks are acidified with HNO3
to reach 2 molar for Nancy (Carignan et al., 2001) and 0.1 to 0.5 molar for other laboratories.
The Rennes laboratory added HNO3 in samples to reach pH 1 (instead of pH 1.6 reported by
NRC-CNRC for SLRS-4) because they observed a more stable signal for all elements in these conditions. Table 2 summarises isotopes and internal standards measured by the different
teams. When several isotopes were measured, we choose the isotope with the smallest
standard deviation after verifying the absence of interferences. For lead, 208
Pb was used for the compilation.
Laboratories have preliminary rejected the outliers by their own methods. Two of them (UPMC Paris, La Rochelle) eliminate values out of the individual mean value ± 2 sd (standard deviation). The Dixon and Grubbs tests at 95% confidence level (Miller &
Miller,1993 ; Prichard, 1995; Feinberg, 1996) have been applied by the others. The analysis of variance (ANOVA) calculations (Neuilly and Cetama, 1993) were also performed between the Nancy, Toulouse, Rennes and the IRD Bondy results in order to validate the compilation. Detailed data were not available for the others.
The aim of this paper is not to certified elemental concentrations in SLRS-4, but to document the homogeneity of results obtained from different laboratories, using different techniques, and to eventually propose working values for uncertified elements. The
compilation data (mean and standard deviation) were then calculated from the average values of each laboratory without taking into account the different number of results and the
individual incertainties (no weight applied). In general, an individual mean was rejected to the compilation when it is out of the overall average ± twice the compiled standard deviation (95% of confidence limits). The same calculations were performed for certified elements in order to assess the quality of laboratories analysis.
II. Results and discussion
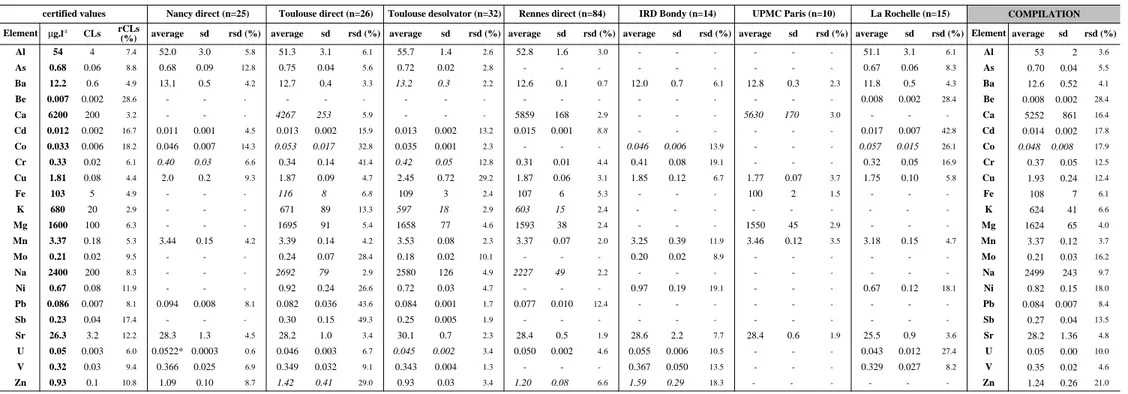
Certified values
Table 3 reports average concentrations obtained by the different laboratories for elements having certified concentrations in SLRS-4. The compilation data represent the artithmetic mean calculated from values reported by each laboratory. Except for few ones, most elements fall within the certified confidence limits if we take into account the individual and the compiled incertainties. Uncorrected/corrected polyatomic interferences on Ca, Cr, Fe, K, Na, Zn) or possible contamination for elements like Cd and Zn might explain the outliers and some high standard deviations.
Elements like Co, Cr and Fe are known to be easily interfered by ArO species (Date and Gray, 1989, Reed et al., 1994, May and Wiedmeyer, 1998). The sulfur and ArO species on Zn might explain the high values obtained by the participants except with the desolvation method. In the case of Ca, the use of both techniques, ICP-MS and ICP-AES confirmed a lower value than that obtained by NRC-CNRC with ICP-AES and FAAS and it should be interesting to re-evaluate the Ca concentration by other laboratories.
Individual laboratories obtained 83% of values for certified elements within the NRC-CNRC confidence limits and 95% of compiled data fall within these limits. This insures the proficiency of the participating laboratories for results on the other elements and validates our mode of calculations for uncertified elements.
Uncertified values
Average concentrations obtained by the laboratories are reported in Tables 4 and 5.
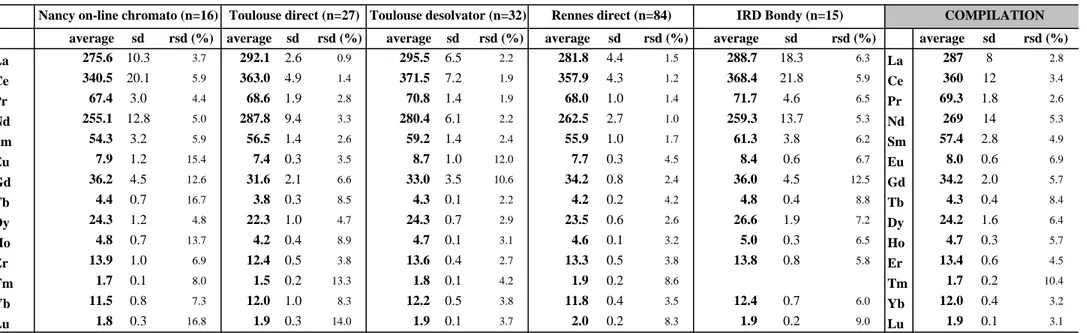
Rare Earth Elements
Results for Rare Earth Elements (REEs) are shown in Table 4. For all REEs, the relative standard deviation (rsd) obtained for the compilation values ranges from 3% to 10%
for concentrations varying between 360 ng.l-1
for Ce to 1.7 ng.l-1
for Tm suggesting a fairly good homogeneity of the results between laboratories and techniques. The rsd values are not correlated with the concentration, the highest values being affected to the middle REEs and Tm. The high standard deviation for Tm is due to the low Tm concentration yielded by Toulouse direct introduction method, which is 20% lower than the mean obtained by the other laboratories. Higher variations for the middle REEs between laboratories may in part
explained by the fact that these elements are interfered by Light REEs (LREEs) and Ba oxides for which the corrections (or no correction) introduce some noise. The low values of Heavy REEs (HREEs), except for Yb and Lu, reported by Toulouse with its direct introduction method may result from the LREEs corrections applied by this laboratory (Ariès et al., 2000). This is supported by the fact that this laboratory yielded values closer to the compilation by using the desolvation technique, which generate a very low oxide formation. High values for Gd and Dy reported by the IRD Bondy may be explained by the fact that this laboratory for
these elements applied no oxide corrections. However, Nancy did correct for Gd and obtained similar value and did not correct for Dy and obtained lower value.
The REE patterns normalised to concentrations of the upper crust (Taylor and McLennan, 1985) for each laboratory are reported in Figure 1. The REE patterns display a LREE enrichment relative to the Heavy REEs and an important negative Ce anomaly. The general pattern may reflect the composition of lithologies along the flow path of the river (Brookins, 1989; Verplanck et al., 2001). The Ce anomaly is commonly observed for river
waters and is probably due to the redox conditions and the trapping of CeIV
by the Fe and Mn oxides (Fleet, 1984; Brookins, 1988).
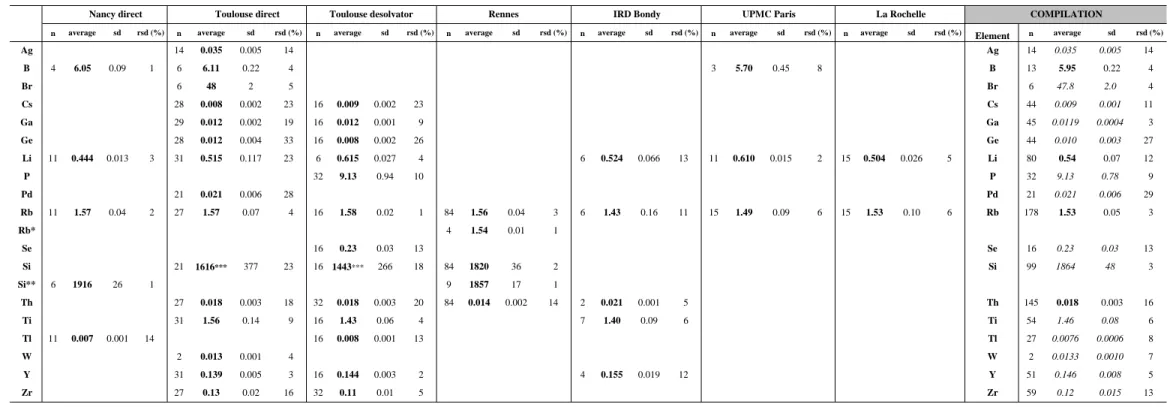
II.b.2 Other elements
Eighteen other elements having no certified values were analysed. Results are reported in Table 5. Six elements (B, Li, Th, Rb and Si) were determined by at least 3 different
laboratories or methods (Figure 2). All the available data for B, Li, Th and Rb were used for the compilation values, including complementary data by ID-TIMS for Rb. Figure 2 shows that results from the different laboratories are within error except for Li (Nancy). Nancy and
Toulouse (desolvator) reported the two extrem Li concentrations of 0.444±0.013 µg.l-1 and
0.615±0.027 µg.l-1
respectively and La Rochelle reported intermediate concentrations of
0.504±0.026 µg.l-1. These results might be explained by some bias in the calibration between
laboratories. Si concentration was measured by two techniques : ICP-MS and
spectrophotometry whereas Si concentrations determined by ICP-MS from Toulouse are lower and less reproducible (rsd of ~ 20% compared to ~ 1% obtained by spectrophotometry). The Si value measured in SLRS-4 is closed to the estimated determination limit of the ICP-MS method for this element. The high Si background contribution observed by the Toulouse team in that concentration range certainly leads to inaccurate correction and explains the heterogeneity of the results. Therefore, we decided to exclude Si values reported by Toulouse from the compilation calculations.
Three other trace elements (Ti, Tl, Y) were analysed by two laboratories (Table 5). Results for these elements are, within error, identical between the two laboratories.
All other trace elements reported in Table 5 (Ag, Br, Cs, Ga, Ge, W, Zr, P, Pd, Se) were analysed only by the Toulouse laboratory. In all cases, when these elements were analysed by the two nebulisation systems, an identical concentration, within error, was obtained (Table 5).
III. Conclusion
We report a compilation of concentrations for uncertified elements in the natural river water standard SLRS-4 (NRC-CNRC) from two years of routine analysis in six different French laboratories. These reported coherent results for REE concentrations, with rsd for the compilation values ranging from 3% to 10%. Eight elements (Li, Th, Rb, B, Ti, Tl, Y, Si) analysed at least by two laboratories yielded compilation values having rsd ranging from 3%
to 16%. Fourteen other trace elements concentrations were reported, but with a more restrictive number of results.
References
Aries S., Valladon M., Polvé M. and Dupré B. (2000)
A routine method for oxide and hydroxide interference corrections in ICP-MS chemical analysis of environmental and geological samples. Geostandards Newsletter 24,1, 19-31.
Berndt T H. and Yanez J.(1996)
High temperature hydraulic high-pressure nebulization: a recent nebulization principle for sample introduction. Journal of Analytical Atomic Spectrometry, 11, 703-712.
Bouhnik-Le Coz M., Petitjean P., Serrat E. and Gruau G. (2001)
Validation d’un protocole permmettant le dosage simultané des cations majeurs et traces dans les eaux douces naturelles par ICP-MS. Les Cahiers Techniques, Ed. Géosciences Rennes, 1, 82 pp.
Brookins D.G. (1988)
Eh-pH Diagrams for Geochemists. Springer-Verlag Pubs., New-York, 176 pp.
Brookins D.G. (1989)
Aqueous geochemistry of rare earth elements. In P. Ribbe Ed., Geochemisrty and mineralogy of Rare Earth Elements,, Mineralogical Society of America, Reviews in Mineralogy 21, 201-223.
Carignan J., Hild P., Mevelle G., Morel J. and Yeghicheyan D. (2001)
Routine analysis of trace elements in geological samples using finjection and low-pressure on-line liquid chromatography ICP-MS: a study of geostandards BR, DR-N, UB-N,
Date A.R. and Gray A.L. (1989)
Applications of inductively coupled plasma mass spectrometry. Blackie Ed., New York, 254 pp.
Feinberg M. (1996)
La validation des méthodes d’analyse : une approche chimiométrique de l’assurance qualité au laboratoire. Masson, Paris, 397 pp.
Fleet A.J. (1984)
Aqueous and sedimentary geochemistry of rare earth elements. In: P. Henderson Ed., Rare Earth Elements Geochemistry. Elsevier Science Pubs, Amsterdam, 343-373.
Jakubowski N., Feldmann I. and Stuewert D.(1992)
Analytical improvement of pneumatic nebulization in ICP-MS by desolvatation. Spectrochimica Acta 47B,1,107-118.
Le Cornec F., Gerard M. and Giffard I. (1999)
Preconcentration and determination by ICP-MS of rare earth elements and some metal ions in water samples. 99 European Winter Conference on Plasma Spectrochemistry (Pau), abstract volume, 133.
May T.W. and Wiedmeyer R.H. (1998)
A table of polyatomic interferences in ICP-MS. Atomic Spectroscopy 19, 150-155.
Statistics for analytical chemistry. 3rd
ed., Ellis Horwood PTR Prentice Hall, New York, 233 pp.
Neuilly M. and Cetama (1993)
Modélisation et estimation des erreurs de mesures. Lavoisier Ed., Paris, 644 pp.
Prichard F.E., Crosby N.T., Day J.A., Hardcastle W.A., Holcombe D.G. and Treble R.D. (1995)
Quality in the analytical chemistry laboratory. In Analytical Chemistry by Open Learning. John Wiley and Sons Ed., 307 pp.
Reed N.M., Cairns R.O. and Hutton R.C. (1994)
Characterization of polyatomic ion interferences in inductively coupled plasma mass spectrometry using a high resolution mass spectrometer. Journal of Analytical Atomic Spectrometry 9, 881-896.
Rose E.F., Carignan J. and Chaussidon M. (2000)
Transfert of atmospheric Boron from oceans to continents : an investigation using
precipitation waters and epiphytic lichens. AGU and Geochemical Society publication, G3 1, 15 pp.
Taylor S.R. and McLennan S.M. (1985)
The continental crust : its composition and evolution. Blackwell, Oxford, 460pp.
Verplanck P.L., Antweiler R.C., Nordstrom D.K. and Taylor H.E. (2001)
Figure caption
Figure 1: Upper crust-normalized REEs patterns of the river water standard SLRS-4 obtained by the different laboratories. n=number of results. Upper crust data from Taylor and
McLennan (1985).
Figure 2 : Average concentrations of B (a), Li (b), Si (c), Th (d) and Rb (e) determined by each participating laboratory in the river water standard SLRS-4. The compilation values are displayed in the legend. Full line : compilation value. Shaded area : standard deviation of the compilation value. desolv.: desolvator. spectrophoto.: spectrophotometry. ID-TIMS : isotope dilution-TIMS.
2 10
-64 10
-66 10
-68 10
-610
-5La Ce Pr Nd
Sm Eu Gd Tb Dy Ho Er Tm Yb Lu
direct Toulouse (n=27) desolvator Toulouse (n=32)on-line chromatography Nancy (n=16) direct Rennes (n=84)
direct IRD Bondy (n=15)
4.5 5 5.5 6 6.5 7 Compilatiion value B=5.95±0.22 B (microgram.l -1 )
a
Nancy Toulouse UPMC - Paris 1.3 1.4 1.5 1.6 1.7 1.8 Compilation value Rb=1.53±0.05 Rb (microgram.l -1 ) Nancy Toulouse Toulouse (desolv.) IRD - Bondy UPMC - Paris La Rochelle Rennes Rennes (ID-TIMS)e
0.01 0.015 0.02 0.025 0.03 Compilation value Th=0.018±0.003 Th (microgram.l -1 ) Toulouse Toulouse (desolv.) Rennes IRD - Bondyd
0.3 0.4 0.5 0.6 0.7 0.8 Compilation value Li = 0.54±0.07 Li (microgram.l -1 ) Nancy Toulouse Toulouse (desolv.) IRD - Bondy UPMC - Paris La Rochelleb
1000 1200 1400 1600 1800 2000 2200 Compilation value Si=1864±48 Si (microgram.l -1 ) Toulouse Toulouse (desolv.)Rennes Rennes(spectrophoto.)
c
Nancy (spectrophoto.)
Table 1: Instrumentation and procedures of the participating laboratories.
Laboratory Blank Acid medium Calibration Interferences corrections
direct (all elements except REE)
on-line chromatography
(REE) distilled water
HNO3 purified by sub-boiling
distillation
multi elemental mono elemental for B
Meinhard nebulizer and Scott spray chamber
2 electrovalves with a microcolumn connected to a
Meinhard nebulizer and a Scott spray chamber
5% 10 µg.l
-1
0.5 µg.l-1 for REEs
Spectrophotometry Beckman DU 62
De-ionised water purified with a UHQ
(Elga) system
- 0, 0.25, 0.62, 1.25 mg.l
-1
(5 mL of sample in 10 mL)
-direct (all elements) HHPN* desolvator (all elements)
De-ionised water purified with a MilliQ
(Millipore) system
HNO3 doubly purified by
sub-boiling distillation
multi elemental with internal standards In, Re
Cross-flow nebulizer and Scott spray chamber
Meinhard nebulizer and cyclonic spray chamber
2% and reacidification at 2% of the SLRS-4 water
10, 50 µg.l-1
(In = Re =10 µg.l-1 )
De-ionised water purified with a MilliQ
(Millipore) system
HNO3 purified by sub-boiling
distillation
multi elemental with internal standard In
internal standard In 2% and reacidification at 2% of the SLRS-4 water
Spectrophotometry Biotek - Uvikon XS
De-ionised water purified with a MilliQ
(Millipore) system
- Si = 5, 10, 20, 30, 60 mg.l-1
-Mass Spectrometry Finnigan MAT 262 -
-Spikes 84 Sr = 0.1184 µg.g-1 (99,8%) 87Rb = 5.5750 µg.g-1 (98%) -HNO3
multi elemental with or without internal standard Tm
2%
five standards from 0.005 to 100 µg.l -1
according to the concentration range of the element (Tm
= 1 µg.l-1)
multi elemental
two or four standards from 0 to 10 mg.l-1 according to the concentration
range of the element
AAS Hitachi Z5000 and TJA
Solutions Solaar989QZ 0.5% multi elemental
direct (Si) Nancy
ICP-MS Perkin Elmer ELAN 6000
Aries et al. (2000)
Bouhnik-le Coz et al. (2001)
-51V = -3.1081 * 53?+0.3524*52Cr 75As = -3.1278*77?+1.0177*78Se 87Sr = -0,3856 * 85Rb 86Sr = -1,504 * 83Kr 138Ba = -0,0009008 * La - 0,003394 * 140Ce De-ionised water purified with a MilliQ
(Millipore) system
HNO3
Instrument
direct (all elements)
V-groove nebulizer or ultrasonic nebulizer and Sturman-masters cyclonic spray chamber Cross-flow nebulizer and cooled Scott spray chamber
(Peltier effect 2°C) ICP-MS
direct (Si)
Methods and introduction systems
direct or after off-line chromatography (all elements) isotopic dilution (Rb)
Meinhard nebulizer and cyclonic spray chamber with radial plasma viewing
UPMC Paris
direct (Mg, Ca, Sr, Fe, Ba, B)
direct (Mn, Cu, Li, Rb) Jobin Yvon 238 sequential
ICP-AES
Gd and Tb with CeO and NdO
IRD Bondy ICP-MS Varian UltraMass 700
Rennes Toulouse
ICP-MS Hewlett Packard 4500 Perkin Elmer ELAN 6000
De-ionised water purified with a MilliQ
Table 2: Isotopes used for ICP-MS, wavelenght used for ICP-AES and AAS
by the participating laboratories. Internal standards isotopes are in bold faces.
Isotopes wavelenght (nm)
Nancy Toulouse Rennes IRD Bondy La Rochelle UPMC Paris
Ag 107 Al 27 27 27 27 As 75 75 75 B 10, 11 11 249.773 Ba 138 137, 138 137 137, 138 137 455.403 Be 9 Br 35 Ca 43 44 422.673 Cd 114 114 111 111 Ce 140 140 140 140 Co 59 59 59 59 Cr 53 52, 53 53 52 52 Cu 63 63, 65 65 65 65 324.8 Cs 133 Dy 164 162, 163 163 163 Er 166 166, 167 166 166 Eu 153 151, 153 153 151, 153 Fe 57 57 238.21 Ga 69, 71 Gd 158 156, 157, 158 158 157 Ge 70, 74 Ho 165 165 165 165 In 115 115 K 39 39 La 139 139 139 139 Li 7 7 7 7 670.8 Lu 175 175 175 175 Mg 24 24 280.27 Mn 55 55 55 55 55 280.1 Mo 95 95, 98 Na 23 23 Nd 142 143, 146 146 146 Ni 60, 62 60 60 P 31 Pb 208 204, 206, 207, 208 206, 207, 208 Pd 105 Pr 141 141 141 141 Rb 85 85 85 85 85 780 Re 187 Rh 103 Sb 121 Se 77, 78 Si 29 29 Sm 152 147, 152 147 147 Sr 88 86, 88 88 86, 87 88 421.552 Tb 159 159 159 159 Th 232 232 Ti 47, 49 47 Tl 205 205 Tm 169 169 169 169 U 238 238 238 238 238 V 51 51 51 51 W 184
Table 3 : Average concentration values (µg.l-1
), standard deviation and relative standard deviation of certified elements in the river water standard SLRS-4.
Element µg.l-1
CLs rCLs (%) average sd rsd (%) average sd rsd (%) average sd rsd (%) average sd rsd (%) average sd rsd (%) average sd rsd (%) average sd rsd (%) Element average sd rsd (%) Al 54 4 7.4 52.0 3.0 5.8 51.3 3.1 6.1 55.7 1.4 2.6 52.8 1.6 3.0 - - - 51.1 3.1 6.1 Al 53 2 3.6 As 0.68 0.06 8.8 0.68 0.09 12.8 0.75 0.04 5.6 0.72 0.02 2.8 - - - 0.67 0.06 8.3 As 0.70 0.04 5.5 Ba 12.2 0.6 4.9 13.1 0.5 4.2 12.7 0.4 3.3 13.2 0.3 2.2 12.6 0.1 0.7 12.0 0.7 6.1 12.8 0.3 2.3 11.8 0.5 4.3 Ba 12.6 0.52 4.1 Be 0.007 0.002 28.6 - - - 0.008 0.002 28.4 Be 0.008 0.002 28.4 Ca 6200 200 3.2 - - - 4267 253 5.9 - - - 5859 168 2.9 - - - 5630 170 3.0 - - - Ca 5252 861 16.4 Cd 0.012 0.002 16.7 0.011 0.001 4.5 0.013 0.002 15.9 0.013 0.002 13.2 0.015 0.001 8.8 - - - 0.017 0.007 42.8 Cd 0.014 0.002 17.8 Co 0.033 0.006 18.2 0.046 0.007 14.3 0.053 0.017 32.8 0.035 0.001 2.3 - - - 0.046 0.006 13.9 - - - 0.057 0.015 26.1 Co 0.048 0.008 17.9 Cr 0.33 0.02 6.1 0.40 0.03 6.6 0.34 0.14 41.4 0.42 0.05 12.8 0.31 0.01 4.4 0.41 0.08 19.1 - - - 0.32 0.05 16.9 Cr 0.37 0.05 12.5 Cu 1.81 0.08 4.4 2.0 0.2 9.3 1.87 0.09 4.7 2.45 0.72 29.2 1.87 0.06 3.1 1.85 0.12 6.7 1.77 0.07 3.7 1.75 0.10 5.8 Cu 1.93 0.24 12.4 Fe 103 5 4.9 - - - 116 8 6.8 109 3 2.4 107 6 5.3 - - - 100 2 1.5 - - - Fe 108 7 6.1 K 680 20 2.9 - - - 671 89 13.3 597 18 2.9 603 15 2.4 - - - - - - - - - K 624 41 6.6 Mg 1600 100 6.3 - - - 1695 91 5.4 1658 77 4.6 1593 38 2.4 - - - 1550 45 2.9 - - - Mg 1624 65 4.0 Mn 3.37 0.18 5.3 3.44 0.15 4.2 3.39 0.14 4.2 3.53 0.08 2.3 3.37 0.07 2.0 3.25 0.39 11.9 3.46 0.12 3.5 3.18 0.15 4.7 Mn 3.37 0.12 3.7 Mo 0.21 0.02 9.5 - - - 0.24 0.07 28.4 0.18 0.02 10.1 - - - 0.20 0.02 8.9 - - - Mo 0.21 0.03 16.2 Na 2400 200 8.3 - - - 2692 79 2.9 2580 126 4.9 2227 49 2.2 - - - Na 2499 243 9.7 Ni 0.67 0.08 11.9 - - - 0.92 0.24 26.6 0.72 0.03 4.7 - - - 0.97 0.19 19.1 - - - 0.67 0.12 18.1 Ni 0.82 0.15 18.0 Pb 0.086 0.007 8.1 0.094 0.008 8.1 0.082 0.036 43.6 0.084 0.001 1.7 0.077 0.010 12.4 - - - Pb 0.084 0.007 8.4 Sb 0.23 0.04 17.4 - - - 0.30 0.15 49.3 0.25 0.005 1.9 - - - Sb 0.27 0.04 13.5 Sr 26.3 3.2 12.2 28.3 1.3 4.5 28.2 1.0 3.4 30.1 0.7 2.3 28.4 0.5 1.9 28.6 2.2 7.7 28.4 0.6 1.9 25.5 0.9 3.6 Sr 28.2 1.36 4.8 U 0.05 0.003 6.0 0.0522* 0.0003 0.6 0.046 0.003 6.7 0.045 0.002 3.4 0.050 0.002 4.6 0.055 0.006 10.5 - - - 0.043 0.012 27.4 U 0.05 0.00 10.0 V 0.32 0.03 9.4 0.366 0.025 6.9 0.349 0.032 9.1 0.343 0.004 1.3 - - - 0.367 0.050 13.5 - - - 0.329 0.027 8.2 V 0.35 0.02 4.6 Zn 0.93 0.1 10.8 1.09 0.10 8.7 1.42 0.41 29.0 0.93 0.03 3.4 1.20 0.08 6.6 1.59 0.29 18.3 - - - - - - Zn 1.24 0.26 21.0
n= number of results sd : standard deviation rsd : relative standard deviation * n=3 - : no measurement available italics : outside the certified confidence limits CLs : 95% confidence limits rCLs : relative confidence limit
COMPILATION
Table 4 : Average concentration values (ng.l-1
), standard deviation and relative standard deviation of REEs in the river water standard SLRS-4.
average sd rsd (%) average sd rsd (%) average sd rsd (%) average sd rsd (%) average sd rsd (%) average sd rsd (%) La 275.6 10.3 3.7 292.1 2.6 0.9 295.5 6.5 2.2 281.8 4.4 1.5 288.7 18.3 6.3 La 287 8 2.8 Ce 340.5 20.1 5.9 363.0 4.9 1.4 371.5 7.2 1.9 357.9 4.3 1.2 368.4 21.8 5.9 Ce 360 12 3.4 Pr 67.4 3.0 4.4 68.6 1.9 2.8 70.8 1.4 1.9 68.0 1.0 1.4 71.7 4.6 6.5 Pr 69.3 1.8 2.6 Nd 255.1 12.8 5.0 287.8 9.4 3.3 280.4 6.1 2.2 262.5 2.7 1.0 259.3 13.7 5.3 Nd 269 14 5.3 Sm 54.3 3.2 5.9 56.5 1.4 2.6 59.2 1.4 2.4 55.9 1.0 1.7 61.3 3.8 6.2 Sm 57.4 2.8 4.9 Eu 7.9 1.2 15.4 7.4 0.3 3.5 8.7 1.0 12.0 7.7 0.3 4.5 8.4 0.6 6.7 Eu 8.0 0.6 6.9 Gd 36.2 4.5 12.6 31.6 2.1 6.6 33.0 3.5 10.6 34.2 0.8 2.4 36.0 4.5 12.5 Gd 34.2 2.0 5.7 Tb 4.4 0.7 16.7 3.8 0.3 8.5 4.3 0.1 2.2 4.2 0.2 4.2 4.8 0.4 8.8 Tb 4.3 0.4 8.4 Dy 24.3 1.2 4.8 22.3 1.0 4.7 24.3 0.7 2.9 23.5 0.6 2.6 26.6 1.9 7.2 Dy 24.2 1.6 6.4 Ho 4.8 0.7 13.7 4.2 0.4 8.9 4.7 0.1 3.1 4.6 0.1 3.2 5.0 0.3 6.5 Ho 4.7 0.3 5.7 Er 13.9 1.0 6.9 12.4 0.5 3.8 13.6 0.4 2.7 13.3 0.5 3.8 13.8 0.8 5.8 Er 13.4 0.6 4.5 Tm 1.7 0.1 8.0 1.5 0.2 13.3 1.8 0.1 4.2 1.9 0.2 8.6 Tm 1.7 0.2 10.4 Yb 11.5 0.8 7.3 12.0 1.0 8.3 12.2 0.5 3.8 11.8 0.4 3.5 12.4 0.7 6.0 Yb 12.0 0.4 3.2 Lu 1.8 0.3 16.8 1.9 0.3 14.0 1.9 0.1 3.7 2.0 0.2 8.3 1.9 0.2 9.0 Lu 1.9 0.1 3.1
n = number of results sd : standard deviation rsd : relative standard deviation
IRD Bondy (n=15) COMPILATION Nancy on-line chromato (n=16) Toulouse direct (n=27) Toulouse desolvator (n=32) Rennes direct (n=84)
Table 5 : Proposed mean concentration values (µg.l-1
), number of measurements, standard deviation and relative standard deviation of uncertified elements in the river water standard SLRS-4.
n average sd rsd (%) n average sd rsd (%) n average sd rsd (%) n average sd rsd (%) n average sd rsd (%) n average sd rsd (%) n average sd rsd (%) Element n average sd rsd (%)
Ag 14 0.035 0.005 14 Ag 14 0.035 0.005 14 B 4 6.05 0.09 1 6 6.11 0.22 4 3 5.70 0.45 8 B 13 5.95 0.22 4 Br 6 48 2 5 Br 6 47.8 2.0 4 Cs 28 0.008 0.002 23 16 0.009 0.002 23 Cs 44 0.009 0.001 11 Ga 29 0.012 0.002 19 16 0.012 0.001 9 Ga 45 0.0119 0.0004 3 Ge 28 0.012 0.004 33 16 0.008 0.002 26 Ge 44 0.010 0.003 27 Li 11 0.444 0.013 3 31 0.515 0.117 23 6 0.615 0.027 4 6 0.524 0.066 13 11 0.610 0.015 2 15 0.504 0.026 5 Li 80 0.54 0.07 12 P 32 9.13 0.94 10 P 32 9.13 0.78 9 Pd 21 0.021 0.006 28 Pd 21 0.021 0.006 29 Rb 11 1.57 0.04 2 27 1.57 0.07 4 16 1.58 0.02 1 84 1.56 0.04 3 6 1.43 0.16 11 15 1.49 0.09 6 15 1.53 0.10 6 Rb 178 1.53 0.05 3 Rb* 4 1.54 0.01 1 Se 16 0.23 0.03 13 Se 16 0.23 0.03 13 Si 21 1616*** 377 23 16 1443*** 266 18 84 1820 36 2 Si 99 1864 48 3 Si** 6 1916 26 1 9 1857 17 1 Th 27 0.018 0.003 18 32 0.018 0.003 20 84 0.014 0.002 14 2 0.021 0.001 5 Th 145 0.018 0.003 16 Ti 31 1.56 0.14 9 16 1.43 0.06 4 7 1.40 0.09 6 Ti 54 1.46 0.08 6 Tl 11 0.007 0.001 14 16 0.008 0.001 13 Tl 27 0.0076 0.0006 8 W 2 0.013 0.001 4 W 2 0.0133 0.0010 7 Y 31 0.139 0.005 3 16 0.144 0.003 2 4 0.155 0.019 12 Y 51 0.146 0.008 5 Zr 27 0.13 0.02 16 32 0.11 0.01 5 Zr 59 0.12 0.015 13
n = number of results sd : standard deviation rsd : relative standard deviation italics : compilation value from less than 3 different laboratories
COMPILATION