HAL Id: hal-02630231
https://hal.inrae.fr/hal-02630231
Submitted on 27 May 2020HAL is a multi-disciplinary open access
archive for the deposit and dissemination of sci-entific research documents, whether they are pub-lished or not. The documents may come from teaching and research institutions in France or abroad, or from public or private research centers.
L’archive ouverte pluridisciplinaire HAL, est destinée au dépôt et à la diffusion de documents scientifiques de niveau recherche, publiés ou non, émanant des établissements d’enseignement et de recherche français ou étrangers, des laboratoires publics ou privés.
Modeling runoff and erosion risk in a small steep
cultivated watershed using different data sources: from
on-site measurements to farmers’ perceptions
Brice Auvet, Bruno Lidon, Budi Kartiwa, Yves Le Bissonnais,
Jean-Christophe Poussin
To cite this version:
Brice Auvet, Bruno Lidon, Budi Kartiwa, Yves Le Bissonnais, Jean-Christophe Poussin. Modeling runoff and erosion risk in a small steep cultivated watershed using different data sources: from on-site measurements to farmers’ perceptions. Hydrology and Earth System Sciences Discussions, European Geosciences Union, 2015, 12 (9), pp.9701-9740. �10.5194/hessd-12-9701-2015�. �hal-02630231�
HESSD
12, 9701–9740, 2015Modeling runoff and erosion risk in a small steep cultivated watershed B. Auvet et al. Title Page Abstract Introduction Conclusions References Tables Figures J I J I Back Close
Full Screen / Esc
Printer-friendly Version Interactive Discussion Discussion P a per | Discussion P a per | Discussion P a per | Discussion P a per |
Hydrol. Earth Syst. Sci. Discuss., 12, 9701–9740, 2015 www.hydrol-earth-syst-sci-discuss.net/12/9701/2015/ doi:10.5194/hessd-12-9701-2015
© Author(s) 2015. CC Attribution 3.0 License.
This discussion paper is/has been under review for the journal Hydrology and Earth System Sciences (HESS). Please refer to the corresponding final paper in HESS if available.
Modeling runo
ff and erosion risk in
a small steep cultivated watershed using
di
fferent data sources: from on-site
measurements to farmers’ perceptions
B. Auvet1, B. Lidon2, B. Kartiwa3, Y. Le Bissonnais4, and J.-C. Poussin5
1
IRD G-eau, CIRAD, ENS, IRSTEA, B.P. 5095, 34196 Montpellier Cedex 5, France
2
CIRAD G-Eau, IRSTEA, B.P. 5095, 34196 Montpellier Cedex 5 France
3
IAHRI, Jl. Tentara Pelajar No. 1A, P.O. Box 830, Kampus Penelitian Pertanian, Cimanggu Bogor 16111 – Jawa Barat, Indonesia
4
INRA Lisah, 2 place Viala, 34060 Montpellier Cedex 2, France
5
IRD G-eau, IRSTEA, B.P. 5095, 34196 Montpellier, Cedex 5, France
Received: 23 June 2015 – Accepted: 20 August 2015 – Published: 25 September 2015 Correspondence to: B. Auvet (brice.auvet@ird.fr)
HESSD
12, 9701–9740, 2015Modeling runoff and erosion risk in a small steep cultivated watershed B. Auvet et al. Title Page Abstract Introduction Conclusions References Tables Figures J I J I Back Close
Full Screen / Esc
Printer-friendly Version Interactive Discussion Discussion P a per | Discussion P a per | Discussion P a per | Discussion P a per | Abstract
This paper presents an approach to model runoff and erosion risk in a context of data scarcity, whereas the majority of available models require large quantities of physical data that are frequently not accessible. To overcome this problem, our approach uses different sources of data, particularly on agricultural practices (tillage and land cover)
5
and farmers’ perceptions of runoff and erosion. The model was developed on a small (5 ha) cultivated watershed characterized by extreme conditions (slopes of up to 55 %, extreme rainfall events) on the Merapi volcano in Indonesia.
Runoff was modelled using two versions of STREAM. First, a lumped version was used to determine the global parameters of the watershed. Second, a distributed
ver-10
sion used three parameters for the production of runoff (slope, land cover and rough-ness), a precise DEM, and the position of waterways for runoff distribution. This in-formation was derived from field observations and interviews with farmers. Both sur-face runoff models accurately reproduced runoff at the outlet. However, the distributed model (Nash–Sutcliffe = 0.94) was more accurate than the adjusted lumped model (N–
15
S= 0.85), especially for the smallest and biggest runoff events, and produced accurate spatial distribution of runoff production and concentration.
Different types of erosion processes (landslides, linear inter-ridge erosion, linear ero-sion in main waterways) were modelled as a combination of a hazard map (the spatial distribution of runoff/infiltration volume provided by the distributed model), and a
sus-20
ceptibility map combining slope, land cover and tillage, derived from in situ observations and interviews with farmers. Each erosion risk map gives a spatial representation of the different erosion processes including risk intensities and frequencies that were val-idated by the farmers and by in situ observations. Maps of erosion risk confirmed the impact of the concentration of runoff, the high susceptibility of long steep slopes, and
25
revealed the critical role of tillage direction.
Calibrating and validating models using in situ measurements, observations and farmers’ perceptions made it possible to represent runoff and erosion risk despite the
HESSD
12, 9701–9740, 2015Modeling runoff and erosion risk in a small steep cultivated watershed B. Auvet et al. Title Page Abstract Introduction Conclusions References Tables Figures J I J I Back Close
Full Screen / Esc
Printer-friendly Version Interactive Discussion Discussion P a per | Discussion P a per | Discussion P a per | Discussion P a per |
initial scarcity of hydrological data. Even if the models mainly provided orders of mag-nitude and qualitative information, they significantly improved our understanding of the watershed dynamics. In addition, the information produced by such models is easy for farmers to use to manage runoff and erosion by using appropriate agricultural prac-tices.
5
1 Introduction
Soil erosion and surface runoff are frequent phenomena but their form, intensity, and ef-fects on agricultural land in tropical regions vary considerably (Randrianarijaona, 1983; Roose and Ndayizigiye, 1997; Vezina et al., 2006). Modeling is one way to better un-derstand these processes. Runoff and erosion at the watershed scale can be modelled
10
using different approaches. Non-distributed models estimate both runoff and sediment yield but only at the outlet, while distributed models represent their spatial distribution and account for watershed heterogeneity (Dlamini et al., 2010) especially heterogene-ity due to agricultural practices. Distributed models require additional distributed data for their calibration, but simulated sediment yield is nevertheless subject to significant
15
error (López-Vicente et al., 2013). For model extension, the size of the watershed is a key factor for agriculture practices (Valentin et al., 2008). As far as temporal dynamics are concerned, event models of erosion can cope with the brief intense production of runoff.
The impact of agricultural practices on erosion has mostly been studied at the plot
20
scale and mainly concerned sheet or inter-ridge erosion (DeLaune and Sij, 2012). At the scale of small watersheds, runoff interconnects the different plots and its spatial distribution has major effects on other forms of erosion (linear erosion, landslides). In small watersheds, distributed models are consequently required and data collection also concerns farmers’ practices (Barnaud et al., 2005), which are difficult to measure
25
HESSD
12, 9701–9740, 2015Modeling runoff and erosion risk in a small steep cultivated watershed B. Auvet et al. Title Page Abstract Introduction Conclusions References Tables Figures J I J I Back Close
Full Screen / Esc
Printer-friendly Version Interactive Discussion Discussion P a per | Discussion P a per | Discussion P a per | Discussion P a per |
The collection of data on topography, rainfall, soil properties and land cover, soil wa-ter content, runoff flow, sediment yield, etc. is a major concern for model calibration and validation. In the frequent situations when on-site measurements are lacking, one solu-tion consists in using data or empirical laws from similar situasolu-tions (Evrart et al., 2009), which however, raises transposition issues. Another solution consists in diversifying the
5
sources of on-site data through quantitative measurements, qualitative observations, and interviews with local people (Etienne, 2011). For instance, farmers can provide useful information about a study site, their plots, and their farming practices that can be compared with on-site observations and satellite images. In addition, building mod-els intended to be useful to stakeholders requires their involvement in the modeling
10
process (Furlan et al., 2012). The stakeholders should already be involved in identify-ing the issues and in selectidentify-ing the output form of the model, as well as in collectidentify-ing data for model calibration and validation. When this approach is used, the models will be more easily appropriated by stakeholders and used as support for discussion and negotiation as appropriate for the Panta Rhei decade “focus on hydrological systems
15
as a changing interface between environment and society” (Montanari et al., 2013), The aim of the present study was to model runoff and erosion risks in a small steep cultivated watershed located on the slope of the Merapi volcano (Java), where avail-able input data is very scarce. In these extreme topographic conditions, farmers per-ceive runoff and erosion via their impact on agriculture, and try to deal with them using
20
agricultural practices based on their own experience and on traditional knowledge. The aim of our model was therefore to help the local farmers improve management of runoff and erosion in the watershed.
HESSD
12, 9701–9740, 2015Modeling runoff and erosion risk in a small steep cultivated watershed B. Auvet et al. Title Page Abstract Introduction Conclusions References Tables Figures J I J I Back Close
Full Screen / Esc
Printer-friendly Version Interactive Discussion Discussion P a per | Discussion P a per | Discussion P a per | Discussion P a per |
2 Material and method
2.1 Study site
Java is located in tropical area with high precipitation, and in a subduction area where volcanic reliefs are dominant. Most cultivable land is already cropped and extreme agriculture has taken over the steep slopes of volcanoes. Frequent intense rainfall
5
events cause serious runoff, and erosion is thus a major concern for extreme agri-culture (Turkelboom et al., 2008).
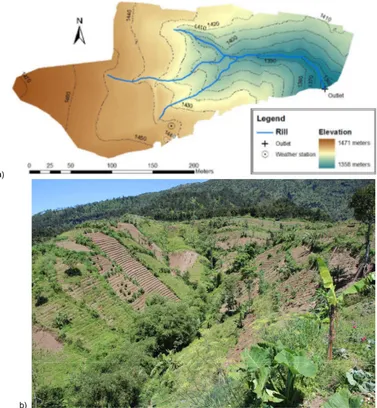
The Gumuk watershed is an example of extreme agriculture. It is located on the east-south-eastern slope of the Merapi volcano. The coordinates of the outfall are 7◦32033.2120300S and 110◦2902.048600E and an elevation of 1471 m a.s.l. The
water-10
shed (Fig. 1) is approximately 400 m long and 150 m wide and covers 4.5 ha. The watershed is very steep: the average slope is 23◦ and 20 % of the area has a slope steeper than 40◦. The steepest slopes are concentrated in the centre of the watershed (Fig. 1a).
The watershed substratum is an andesitic lava flow covered by ash and pyroclastic
15
deposits. Deposition, driven by the volcano activity, and erosion, driven by intense rain-fall events, has shaped the geological structure of the watershed. Soils are andosols mainly composed of deposits with very low organic matter content. They are very rich in crystalline materials due to their young age.
Agriculture uses most of the watershed for cultivation on terraces whose steep slopes
20
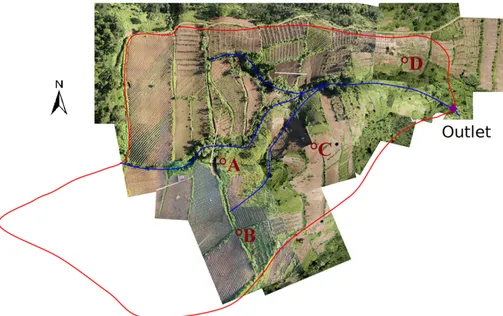
can reach 50◦(Fig. 1b). The watershed comprises more than 80 plots ranging from 50 to 700 m2 in size (Fig. 2). Most of the plots are ridged to give a preferential direction to the flow, and are drained by ditches. The land cover varies over the course of the year depending on the cropping system. Typically, maize is cultivated at a low planting density at the beginning of the rainy season (October to January) followed by market
25
gardening of different vegetables in the same field (December to March). Tobacco is then cultivated from February until the end of the rainy season (mid-June) in almost
HESSD
12, 9701–9740, 2015Modeling runoff and erosion risk in a small steep cultivated watershed B. Auvet et al. Title Page Abstract Introduction Conclusions References Tables Figures J I J I Back Close
Full Screen / Esc
Printer-friendly Version Interactive Discussion Discussion P a per | Discussion P a per | Discussion P a per | Discussion P a per |
all the plots and harvested during the first month of the dry season. No new crop is planted during the dry season, which lasts from June to October.
In 2012, 1700 mm of rain was measured at the local weather station. Only ten days of heavy rainfall accounted for 663 mm (38 % of total rainfall) and only 12 mm of rain fell during the dry season. The data collection campaign ended in July 2013. The weather
5
in 2012 and 2013 was compared to long term data from neighbouring weather stations. Weather stations at Boyolali (20 km from Gumuk, alt. 400 m), Yogyakarta (32 km from Gumuk, alt. 100 m) and Surakarta (40 km from Gumuk, alt. 100 m) are located at lower altitudes in the same valley. Due to the impact of relief on the weather, they are not representative of the study site. Farmers were questioned instead. They qualified the
10
weather in 2012, especially the rain (total amount or extreme events), as a “typical”. Farmers cited the length of the rainy season, i.e., the exact starting and ending dates, as the main inter-annual weather variability. Indeed, the length of the rainy season determines the agricultural calendar and the water resource. Farmers described the 2012 rainy season as starting “on time”, and the 2013 rainy season as being one month
15
longer, as it ended at the beginning of July whereas it usually ends at the beginning of June. Extreme rainfall events in 2012 were described as “typical” in terms of number and intensity. The rainfall events in 2012 produced runoff that triggered erosion, which, in turn, had a major impact on agricultural activities. Runoff and erosion were therefore also considered to be “typical” by the farmers.
20
2.2 Analysis of rainfall–runoff data
Rainfall was measured in a receptacle with 0.2 mm capacity at one minute intervals by a pluviometer that was an integral part of an automatic weather station (Vantage Pro2 – Davis). The weather station was located on the top of the watershed (see Fig. 1a). Runoff was measured at the outlet by measuring the level of water at a gauging station
25
that had been converted to measure discharge using rating tables calibrated in the laboratory.
HESSD
12, 9701–9740, 2015Modeling runoff and erosion risk in a small steep cultivated watershed B. Auvet et al. Title Page Abstract Introduction Conclusions References Tables Figures J I J I Back Close
Full Screen / Esc
Printer-friendly Version Interactive Discussion Discussion P a per | Discussion P a per | Discussion P a per | Discussion P a per |
The aim of data analysis was to identify the rainfall events that produced runoff. Monitoring began in September 2011 and ended in March 2013. Fifty-six days with runoff were counted at the outlet, but rainfall and runoff data were only both correct on 29 days. The start and end of a rainfall event were defined as a period of three minutes with rainfall intensity equal to or greater than 0.1 mm h−1(5 min moving average). Data
5
analysis was limited to runoff produced by a single rainfall event. For these events, the antecedent precipitation index (API: Descroix et al., 2002) was calculated at a one-minute time step for a period of 24 h. The API was defined as follows (Eq. 1) where t is the time in minutes before the beginning of the rainfall event and pt is precipitation during this minute:
10 API= 1440 X t=1 ptat (1)
The recession factor (a) of API was determined as 0.9984023. It corresponds to 90 % infiltration of rain 24 h before the main rainfall event, due to the high hydraulic conduc-tivity of soils.
The total amount of rain and the duration of the rainfall events were also calculated.
15
The total volume of runoff associated with a given rainfall event corresponded to the output flow between the beginning and end of runoff.
2.3 Runoff modeling based on STREAM model
The STREAM model (Souchère et al., 1998, 2003; Cerdan et al., 2002) uses a raster approach to calculate the spatial distribution of runoff volume at the time scale of a
rain-20
fall event based on the hydrological process and expert rules. STREAM architecture is separated into two components: the production of runoff and the transport of the runoff water.
HESSD
12, 9701–9740, 2015Modeling runoff and erosion risk in a small steep cultivated watershed B. Auvet et al. Title Page Abstract Introduction Conclusions References Tables Figures J I J I Back Close
Full Screen / Esc
Printer-friendly Version Interactive Discussion Discussion P a per | Discussion P a per | Discussion P a per | Discussion P a per | Lumped version
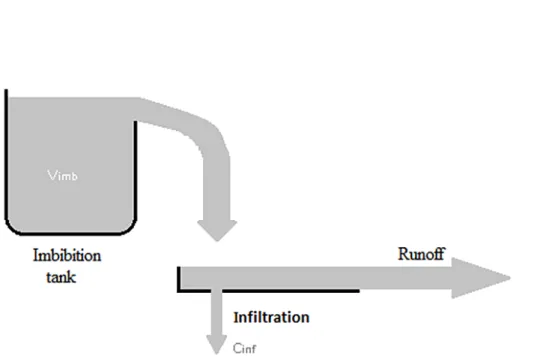
The lumped version (Fig. 3) considers the watershed to be homogeneous. We only fo-cused on total runoff volume at the outlet using the characteristics of the rainfall event. This version therefore only used production components. The STREAM production component is based on physical processes instead of multivariate adaptive regression
5
splines (Sharda et al., 2006). Rain fills the imbibition tank until it overflows; runoff cor-responds to this overflow minus the infiltration volume, which is derived from the soil infiltration capacity and the duration of the rainfall event. The initial filling of the imbi-bition tank depends on the API. Four levels of imbiimbi-bition capacity were distinguished corresponding to four categories of API.
10
Equation (2) represents the runoff volume production V (in cubic meters) per unit of surface area (S in thousands of square meters) as a result of the rain (R in mm) minus the imbibition volume (Vimb in mm) per unit surface area and the infiltration capacity (Cinfin mm h−1) times the duration (D in hours) of the rainfall event.
V
S = R − Vimb− Cinf× D (2)
15
Development of a spatially distributed runoff model
Modelling runoff in Gumuk watershed aimed to spatially distribute the lumped version. The raster grid is based on a digital elevation model of the watershed. In each cell, runoff production is determined with the same architecture as in the lumped model (see Fig. 3). The runoff volume produced in each pixel is then transported to one of the eight
20
neighbors following the steepest slope. The natural flow direction can be modified by humans (through soil tillage and water channels) leading to preferential flow directions. In the absence of soil tillage, the flow direction follows the natural slope. The map of flow accumulation enables evaluation of the runoff volume transiting each pixel.
Based on the characteristics of the Gumuk watershed (slope variability, size of plots,
25
HESSD
12, 9701–9740, 2015Modeling runoff and erosion risk in a small steep cultivated watershed B. Auvet et al. Title Page Abstract Introduction Conclusions References Tables Figures J I J I Back Close
Full Screen / Esc
Printer-friendly Version Interactive Discussion Discussion P a per | Discussion P a per | Discussion P a per | Discussion P a per |
centimetres using more than 2000 elevation measurements with D-GPS and a Leica total station. Main waterways, water channels, terraces and border of plots were also mapped.
The runoff production component of STREAM was adapted to the specificity of the study site. Based on field observations and interviews with the farmers, the slope,
5
vegetal cover, soil roughness and tillage direction were identified as main factors influ-encing runoff production and flow direction. These four characteristics were then used to build a decision table to determine the imbibition volume and infiltration capacity at plot scale: the values of these two parameters were estimated on the basis of the aver-age imbibition volume and infiltration capacity determined by the lumped model. Data
10
at plot scale (soil properties, slope, vegetal cover, soil roughness, tillage direction, wa-terways) resulting from observations or collected in interviews with farmers were used to build decision tables to determine the imbibition volume and infiltration capacity of each plot according to its characteristics. Imbibition volumes without antecedent rainfall were determined from the combination of the infiltration capacity and the antecedent
15
rainfall. Assuming that the antecedent rainfall filled the imbibition tank to capacity and that filling was homogeneous across the watershed, the imbibitions volume for each pixel was determined using the same framework as for infiltration capacity.
2.4 Calibration and validation of the runoff models
The STREAM versions (lumped and distributed) of runoff were both calibrated with 13
20
rainfall–runoff events and validated with nine other events. The quality of the simulated runoff volumes was measured using the Nash–Sutcliffe coefficient (Nash and Sutcliffe, 1970) and the average quadratic error.
The map of runoff accumulation simulated with the distributed model version for each rainfall–runoff event was compared with field observations and information gathered in
25
HESSD
12, 9701–9740, 2015Modeling runoff and erosion risk in a small steep cultivated watershed B. Auvet et al. Title Page Abstract Introduction Conclusions References Tables Figures J I J I Back Close
Full Screen / Esc
Printer-friendly Version Interactive Discussion Discussion P a per | Discussion P a per | Discussion P a per | Discussion P a per |
2.5 Modeling erosion risks
Erosion is a major concern in agriculture in steep tropical landscapes (Vietnam, Vez-ina et al., 2006; Madagascar, Randrianarijaona, 1983; North Cameroon, Abbot et al., 2001; Rwanda, Roose and Ndayizigiye, 1997; Ethiopia, Nyssen et al., 2000; Thaïland, Forsyth, 1994; Malaisia, Midmore et al., 1996) and its spatial distribution is also a major
5
issue. Erosion events, particularly those caused by storms in tropical areas, cause ma-jor land degradation (Turkelboom et al., 2008). As our watershed only produced runoff during extreme rainfall events, we focused on the subsequent erosion events.
Distributed numerical erosion models require multiple calibration and validation data and have difficulty representing the different erosion processes (hysteresis issues)
10
(Giménez et al., 2012). There may also be significant errors in the location of ero-sion and in sediment yield simulated by distributed numerical eroero-sion models (Jetten et al., 2003; López-Vicente et al., 2013). On the other hand, the farmers’ representation of erosion is more concerned with agricultural problems (sediment losses, destruction of the crop) at plot scale than at watershed scale. For these reasons, we decided to
fo-15
cus on the farmers’ representations of erosion and on the location of erosion patterns within the watershed. Rather than computing sediment losses, we decided to model the different erosion risks and to build accurate maps of these risks in the watershed.
Modeling erosion risk is based on hazard vulnerability analysis (Turner et al., 2003; Prasannakumar et al., 2011). Hazard and vulnerability are specific to each type of
ero-20
sion the farmers described as being one of the major ones during the survey, namely: linear erosion in plots and waterways, and landslides. For both types of erosion risk, the vulnerability was constrained by the erosion susceptibility. Peak discharge determines linear erosion (Souchère et al., 2003), but the STREAM model only calculates runoff accumulation as the total volume of the event. For a small watershed (less than a few
25
dozen hectares) with short rainfall–runoff events (a few hours or less), we assumed the runoff volume is a good indicator of the intensity of runoff flow.
HESSD
12, 9701–9740, 2015Modeling runoff and erosion risk in a small steep cultivated watershed B. Auvet et al. Title Page Abstract Introduction Conclusions References Tables Figures J I J I Back Close
Full Screen / Esc
Printer-friendly Version Interactive Discussion Discussion P a per | Discussion P a per | Discussion P a per | Discussion P a per |
For linear erosion (ephemeral rill intra-field and permanent gully extra-field), the haz-ard was evaluated as the runoff volume simulated by the STREAM model for a typical intense rainfall–runoff event. Simulated runoff volumes were classified in 3 or 5 (reg-ular) classes to build a hazard map. Linear erosion susceptibility was derived from vegetal cover and slope (Souchère et al., 2003). The combination of these two
charac-5
teristics at pixel scale was classified in four categories and resulted in a susceptibility map. The map of the risk of linear erosion was built using raster calculations (multipli-cation and categorization) combining the hazard and susceptibility maps.
For landslide, the hazard was evaluated as the combination of soil saturation (infil-trated volume) and overflow (runoff volume) (at plot scale). Landslide vulnerability is
10
related to vegetal cover, slope, and the difference in angle between the direction of tillage and of the slope. Landslide risks within the plot and at its border (where runoff has a major impact) were distinguished. The map of landside risk was built in the same way as linear erosion risk, by crossing the hazard and susceptibility maps.
2.6 Soil properties, vegetal cover and tillage
15
The soil composition was analysed by the regional agricultural service BPTP, in Yo-gyakarta. Thirteen soil samples were taken in different cultivated plots located in the watershed. The organic carbon of each sample was measured by spectrometry, while other analyses focused on hydrological soil properties (primary porosity, effective porosity, ineffective porosity and permeability). The national hydrological service IAHRI
20
conducted a field experiment to determine soil hydraulic conductivity using a perme-ameter disc. Measurements were taken in seven plots, some cultivated, some not, in March 2013.
The vegetal cover, soil tillage (type and azimuth direction) and roughness recorded during the last two cropping seasons (mid-April 2013 to end-June 2013) were precisely
25
mapped on the watershed. A total of 90 homogeneous plots were defined and these parameters were recorded in a GIS. Vegetal cover was classified in four categories in accordance with agricultural criteria: (i) “bare soil” with less than 20 % of the surface
HESSD
12, 9701–9740, 2015Modeling runoff and erosion risk in a small steep cultivated watershed B. Auvet et al. Title Page Abstract Introduction Conclusions References Tables Figures J I J I Back Close
Full Screen / Esc
Printer-friendly Version Interactive Discussion Discussion P a per | Discussion P a per | Discussion P a per | Discussion P a per |
covered by vegetation, corresponding to no crop or a weak crop cover with no weed infestation, (ii) “medium vegetal cover” with 20 to 70 % of the ground covered by vegeta-tion, corresponding to a weak crop with medium weed infestation or a dense crop with no weeds, (iii) “high vegetal cover” with more than 70 % of the ground covered by vege-tation, corresponding to a crop with high weed infesvege-tation, (iv) “very high vegetal cover”
5
where surface was completely covered by vegetation, corresponding to forest or uncul-tivated or abandoned plots. Roughness was classified in five categories in accordance with agricultural land preparation and height of ridges: (i) no roughness, (ii) natural small roughness (less than 5 cm), (iii) small roughness resulting from agricultural oper-ations (5 to 10 cm), (iv) medium roughness resulting from agricultural operoper-ations (more
10
than 10 cm), (v) high roughness resulting from agricultural operations (more than 10 cm and the presence of puddles after rainfall). Photos were taken of the vegetal cover and of the roughness categories to discuss the soil surface and vegetal cover in the plots with the farmers. The properties from 2012 to April 2013 were assessed in interviews with the farmers.
15
2.7 Field observations on runoff and erosion
Field surveys were conducted during rainfall events in May and June 2013 to assess the contribution of slope, tillage direction, roughness and vegetal cover to runoff and erosion in the plots. A sample of 18 plots with different slopes, tillage direction, rough-ness and vegetal cover were chosen. Observations were made during rainfall events to
20
compare runoff and erosion in the field to ensure the different factors involved in runoff production (occurrence and intensity) roughly corresponded and to identify the impact of each on erosion (change in the soil structure).
Observations were also made at four junctions (A, B, C, and D) in the upstream waterways (see Fig. 2) in order to roughly estimate the runoff flow and the contribution
25
of each upstream branch during intense rainfall events. The survey was not possible downstream in the main waterway because of the high runoff flow.
HESSD
12, 9701–9740, 2015Modeling runoff and erosion risk in a small steep cultivated watershed B. Auvet et al. Title Page Abstract Introduction Conclusions References Tables Figures J I J I Back Close
Full Screen / Esc
Printer-friendly Version Interactive Discussion Discussion P a per | Discussion P a per | Discussion P a per | Discussion P a per |
2.8 Interviews with farmers
The aim of the interviews with farmers was to gather two types of information. The first type concerned the farmer’s perception of runoff and erosion and what kind of model outputs farmers would consider useful. The second type concerned their agricultural practices and land management. Individual semi-open interviews were carried out with
5
a sample 19 farmers who cultivated 87 % of the total cropped area. Each farmer was interviewed in his/her field.
The first part of the interview concerned the farmer’s perception of runoff and erosion, the different types of erosion, their impacts on farming activities, and their main triggers. For each type of erosion, the farmer showed us the exact place where erosion occurred
10
in his/her field, its frequency and its intensity. The farmer also showed us the traces left by of erosion in the plot and qualified its intensity. In addition, the farmer located and qualitatively evaluated the concentration of runoff in the field during the 2012 and 2013 rainy seasons. The farmer’s answers were compared with field observations. This information was mapped and used to validate the runoff and erosion risk models.
15
The second part of the interview was directive and concerned the farmer’s crop and runoff management practices used in his/her plot in the 2012 and 2013 cropping seasons. The farmer described the tillage, weeding, agricultural calendar, weather and the differences between the current and the past cropping seasons. This information was compared with in situ observations and was used as model inputs.
20
3 Results
3.1 General watershed dynamics and lumped version
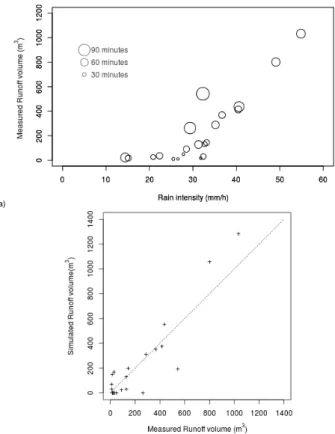
The measured runoff volume produced by the Gumuk watershed ranged from 10 to 1000 m3 depending on the intensity (rainfall amount and duration) of the rainfall event (Fig. 4a). Rainfall events with an intensity of less than 28 mm h−1 produced no runoff.
HESSD
12, 9701–9740, 2015Modeling runoff and erosion risk in a small steep cultivated watershed B. Auvet et al. Title Page Abstract Introduction Conclusions References Tables Figures J I J I Back Close
Full Screen / Esc
Printer-friendly Version Interactive Discussion Discussion P a per | Discussion P a per | Discussion P a per | Discussion P a per |
The volume of runoff produced by rainfall events whose intensity ranged from 28 to 43 mm h−1depended on the duration: only rainfall events that lasted more than 40 min produced runoff, and major runoff volumes resulted from intense rainfall events that lasted for more than an hour.
The lumped version of runoff correctly represented the general dynamics of the
Gu-5
muk watershed, especially for medium runoff volumes (between 100 and 500 m3). Av-erage infiltration capacity and avAv-erage imbibition volume without antecedent rainfall were determined to be 30 mm h−1and 10 mm, respectively. But the model clearly over-estimated high runoff volumes and was highly inaccurate for small volumes (Fig. 4b): simulated runoff volumes were either under- or over-estimated. The average error was
10
122 m3and the Nash–Sutcliffe coefficient was 0.85.
3.2 Decision tables in the distributed version and land cover scenarios
The field survey showed that the natural slope combined with the slope in the direction of tillage, and the vegetal cover were the main determining factors of runoff production Indeed, soil analyses revealed that the soil in the fields was homogeneous, i.e., andosol
15
mainly composed of ash deposits with little organic matter and no clay, characterized by high infiltration capacity and 20 % effective porosity. However, at the bottom of the valley in the main waterway, the lava substratum was visible at the surface and created in an impermeable a strip of soil about 1 m in width and 100 m in length. Five categories of average natural slope and slope in the tillage direction (less than 10◦, 10 to 15◦, 15 to
20
20◦, 20 to 25◦, and more than 25◦) were used as a slope index. The vegetal cover was classified in four categories and surface roughness (that included the height of ridges) in five categories.
The decision table used these three categorized factors to determine the infiltration capacity in each plot. Values were distributed around the average infiltration capacity
25
of the watershed (30 mm h−1) based on field observations and expert information (Ta-ble 1). Indeed, an increase in slope or a decrease in roughness or in the vegetal cover logically increased runoff, thereby reducing infiltration capacity.
HESSD
12, 9701–9740, 2015Modeling runoff and erosion risk in a small steep cultivated watershed B. Auvet et al. Title Page Abstract Introduction Conclusions References Tables Figures J I J I Back Close
Full Screen / Esc
Printer-friendly Version Interactive Discussion Discussion P a per | Discussion P a per | Discussion P a per | Discussion P a per |
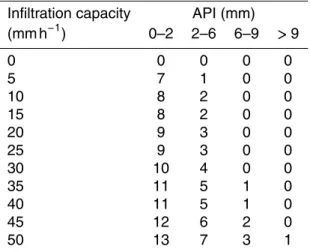
Imbibition volumes derived from infiltration capacities (Table 2). A plot with a high infiltration capacity also had a high imbibition volume, which decreased with antecedent rainfall. However the variability of imbibition volume was small (3 mm).
During calibration of the STREAM model (distributed version), only a few modifi-cations in the decision tables were required to obtain a satisfactory solution for the
5
simulated runoff at the outlet. The main modification was to reduce the variability of the imbibitions volume from 5 to 3 mm.
Interviews with the farmers and plot surveys revealed no significant differences in the location of each plot, nor in surface roughness and soil tillage direction, but did reveal changes in the vegetal cover due to changes in crop or weed infestation during the
10
rainy season. In the first part of the rainy season (from October to January) agriculture was extensive, with sparse crops and high weed density, resulting in high vegetal cover in the cultivated plots. In the second part of the rainy season (from February to mid-June) farmers plowed their plots in preparation for cultivating vegetables and tobacco, and controlled weeds, resulting in low vegetal cover or bare soil in the cultivated plots.
15
Two vegetal cover scenarios were therefore used: one using a vegetal cover (the one observed in the second part of the rainy season) that remained the same throughout the rainy season, and one that adapted the vegetal cover to the date of the rainfall– runoff event.
3.3 Runoff volume simulated at the outlet with the distributed model version
20
and non-linear response of the basin
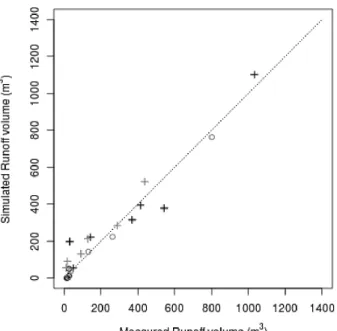
The runoff volume simulated with STREAM (distributed version) took into account the distribution of soil hydrologic properties and the vegetal cover (Fig. 5). Estimations computed with this distributed hydrological model were more accurate than with the lumped model. Using the same vegetal cover for all rainfall–runoff events, the average
25
error was 75 m3 and the Nash–Sutcliffe coefficient was 0.91. Taking changes in the vegetal cover into account slightly decreased the simulated runoff volume (less than 70 m3, which was within the initial average error). However, this increased the model
HESSD
12, 9701–9740, 2015Modeling runoff and erosion risk in a small steep cultivated watershed B. Auvet et al. Title Page Abstract Introduction Conclusions References Tables Figures J I J I Back Close
Full Screen / Esc
Printer-friendly Version Interactive Discussion Discussion P a per | Discussion P a per | Discussion P a per | Discussion P a per |
accuracy, as the average error decreased to 62 m3with a Nash–Sutcliffe coefficient of 0.94.
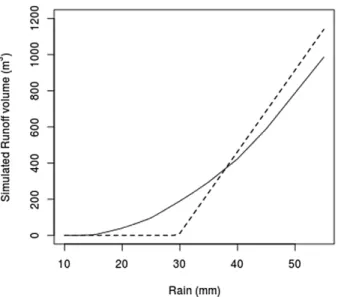
Both runoff model versions were used to simulate one-hour rainfall events of different intensity with a full imbibition tank (Fig. 6). The distributed version of STREAM showed a non-linear response of the basin corresponding to the spatial distribution of the
infil-5
tration capacity, especially due to the spatial distribution of slope. Low intensity rainfall events produced runoff only in the steepest plots, which were mostly located at the center of the watershed, where infiltration capacity was low. Increasing rainfall intensity produced runoff in plots with a less steep slope (that had a higher infiltration capac-ity) and hence increased runoff in the steepest plots. Under very intense rainfall (more
10
than 45 mm h−1) all the plots, including the flat plots located at the watershed border, were saturated and produced runoff: any millimeter per hour of rain above this thresh-old immediately produced runoff. This differential production of runoff was validated by our field observations during rainfall events. The steepest plots located in the center of watershed produced runoff even during short low intensity rainfall events, whereas
15
the flat fields located at the watershed border only produced runoff during long or high intensity rainfall events. The distributed version satisfactorily simulated this contrasted effect, which was not accounted for by the lumped version.
3.4 Spatial distribution of runoff
The distributed version simulated runoff production at the pixel scale and consequently
20
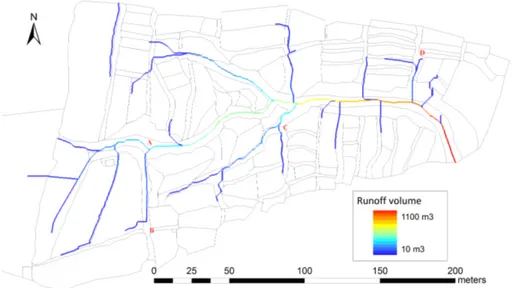
reproduced the spatial variability of runoff production at the basin scale (Fig. 7). The production of runoff was higher in the middle of the basin where the steepest plots are located. Agricultural practices impacted runoff through both vegetal cover and the tillage direction. However, variation in vegetal cover linked to the presence of a crop and weeds had less impact on runoff production than slope. Tillage direction influenced flow
25
HESSD
12, 9701–9740, 2015Modeling runoff and erosion risk in a small steep cultivated watershed B. Auvet et al. Title Page Abstract Introduction Conclusions References Tables Figures J I J I Back Close
Full Screen / Esc
Printer-friendly Version Interactive Discussion Discussion P a per | Discussion P a per | Discussion P a per | Discussion P a per |
of plots. Farmers’ interviews and field observations confirmed model predictions of runoff production.
The hydrographic network of the basin was highly developed and concentrated: sim-ulated results showed that three main branches (west of the watershed) contributed to the majority of runoff (700 m3 corresponding to 60 % of the total runoff volume), and
5
after their confluence, seven waterways accounted for 30 % of the total runoff volume (350 m3). Simulated runoff volumes in upstream waterway channels at point A, B, C and D were compared to observations made during intense rainfall events. For instance, runoff volumes at junction C simulated with a very intense rainfall event (50 mmh−1 during 56 min) were 122 m3coming from the west and 33 m3coming from south (see
10
Fig. 7). Our observation at junction C during similar rainfall events were in accordance with the simulated result: it showed that about three-quarters of runoff came from the west and one quarter from the south.
Different simulations identified the main impact of agricultural practices, i.e. tillage determined preferential flow direction and waterway channels drained the plots. These
15
anthropogenic practices were responsible for the high runoff concentration.
3.5 Farmers’ perception of erosion
The farmers distinguished between three types of erosion processes.
(i) Landslides were the most problematic for farmers because they destroyed the crop in their plot, reduced the cultivated area, and required earthworks to repair the damage.
20
Landslides destroyed not only the plot in which it started but also the plot located in the downstream deposition area. In the farmers’ opinions, there are two types of landslide: those caused by a rupture of the plot border and those that start inside the plot.
Linear erosion was a less serious problem for the farmers who described two phe-nomena: (ii) linear erosion of the inter-ridge inside the plots, caused by a rapid
concen-25
trated flow that could harm the crop and destabilize the plot, and (iii) linear erosion of the waterways between the plots, which can break through the man-made waterways and then overrun the plots, destroying the crop or causing landslides inside the plots.
HESSD
12, 9701–9740, 2015Modeling runoff and erosion risk in a small steep cultivated watershed B. Auvet et al. Title Page Abstract Introduction Conclusions References Tables Figures J I J I Back Close
Full Screen / Esc
Printer-friendly Version Interactive Discussion Discussion P a per | Discussion P a per | Discussion P a per | Discussion P a per |
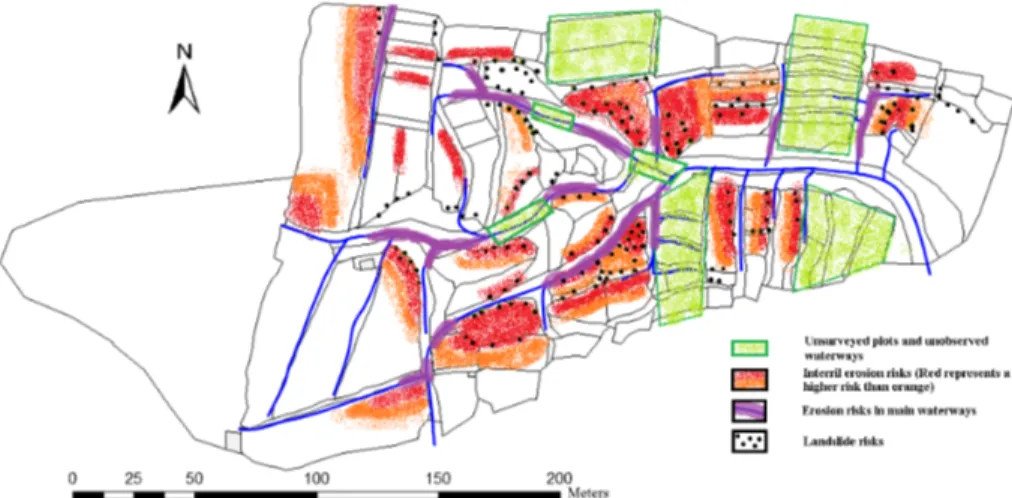
Farmers connected the intensity and frequency of erosion events: the location with the most intense erosion was also the place where erosion occurred most frequently. The map in Fig. 8 presents the information provided by the farmers and our observa-tions of erosion features in the plots.
3.6 Mapping erosion risks
5
Maps of erosion susceptibility and risk were created for the three types of erosion phenomena described by the farmers: landslides, linear erosion within the plots, and linear erosion in the waterways.
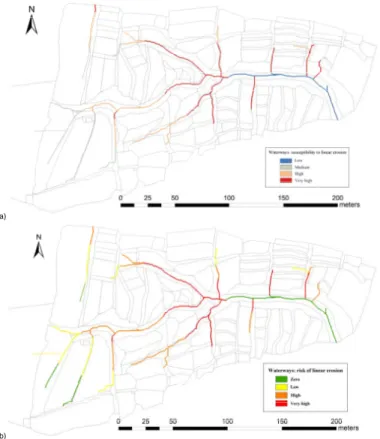
Concerning the risk of linear erosion in the permanent gully outside the field (Fig. 9) susceptibility was zero in the main waterway because it was located on andesite lava
10
(Fig. 9a). Susceptibility was higher in the other waterways because they were located on andosol, which is mainly composed of ash deposits. In addition, susceptibility to linear erosion was connected with the steepness of the slope of the waterway. Com-bining the susceptibility map with the hazard map (runoff volume distribution) resulted in a risk map (Fig. 9b). Erosion risk was high in the three main tributary waterways
15
where runoff volume was high, but it was also very high in very steep secondary wa-terways where the runoff volume was low. Field observations during intense rainfall events confirmed the location of erosion risk in the waterways (see Fig. 8). Field obser-vations also showed that the places with high risk (see Fig. 8) corresponded to a steep waterway or high runoff flow. In addition, observations at point A during intense rainfall
20
events showed that erosion led to a digging of the existing waterway channel.
Concerning linear erosion in the transient intra-field rill (Fig. 9) the main factor in-fluencing susceptibility was slope, which can be tempered by tillage across the natural slope and vegetal cover. Susceptibility was consequently high in steep areas, and these were quite widely distributed in the basin (Fig. 9a). The main risk of linear erosion
in-25
side the plots was concentrated in the center of the basin where runoff production was higher (Fig. 9b). The map shows increasing risk of erosion caused by the accumulation of runoff downstream (green to yellow to red). Comparing field observations and
infor-HESSD
12, 9701–9740, 2015Modeling runoff and erosion risk in a small steep cultivated watershed B. Auvet et al. Title Page Abstract Introduction Conclusions References Tables Figures J I J I Back Close
Full Screen / Esc
Printer-friendly Version Interactive Discussion Discussion P a per | Discussion P a per | Discussion P a per | Discussion P a per |
mation collected in interviews with the farmers (see Fig. 8) confirmed the location of the risk of linear erosion in the plots. Places with high, medium and low linear erosion risk described by the farmers (Fig. 8) corresponded to those predicted by the risk model.
Susceptibility to landslides was concentrated in steep areas, which are mainly lo-cated in the center of the basin (Fig. 11a). Flat plots lolo-cated at the edge of the basin
5
were less susceptible. Plots located on the banks of the main waterways were uniformly highly susceptible in steep areas but only slightly susceptible elsewhere. Hazard (infil-tration and runoff) concentrated the risk in the center of the basin (Fig. 11b). Only a few plots were subject to high risk of landslide, but in these plots the risk was nevertheless severe. All five landslides that occurred during our field observations happened in this
10
highly risky area. Moreover, except for two plot borders, the locations of the landslides described by the farmers (Fig. 8) corresponded to highly risky areas on the simulated risk map.
Erosion maps revealed the major impact of tillage direction on the different erosion risks. The risk of linear erosion inside the plot decreased if the slope in the tillage
direc-15
tion was less than the natural slope. But if it was too flat (perpendicular to the natural slope), the risk of landslide in the plot increased. Tillage direction determined runoff direction and concentration and therefore influenced the hazard maps (runoff and infil-tration). It consequently increased the risk of erosion in the plot or in the waterway that received the runoff flow. Moreover, linear erosion in waterways created deep gullies
20
with instable flanks, and, as a consequence, increased the risk of soil losses (which can lead to landslides) at the plot borders.
4 Discussion
4.1 Watershed response
Intense tropical rainfall events produce flash runoff in steep micro-watersheds in
In-25
HESSD
12, 9701–9740, 2015Modeling runoff and erosion risk in a small steep cultivated watershed B. Auvet et al. Title Page Abstract Introduction Conclusions References Tables Figures J I J I Back Close
Full Screen / Esc
Printer-friendly Version Interactive Discussion Discussion P a per | Discussion P a per | Discussion P a per | Discussion P a per |
is quite simple, uses few parameters and satisfactorily simulates runoff production at watershed scale. The distributed STREAM model uses qualitative or quantitative vari-ables classified in 4 or 5 categories based on simple field observations and farmers’ interviews. Accounting for the spatial distribution of hydrological properties increases the quality of the runoff simulations, as shown by Turkelboom et al. (2008). The expert
5
based distributed model with only a few infiltration capacity classes was consequently more accurate than the adjusted linear lumped model in simulating runoff in this steep cultivated watershed.
The STREAM model predicted total event runoff accumulation without taking the temporal dynamics of runoff during the rainfall events into consideration. This can have
10
a major impact on erosion assessment because peak discharge plays a determining role in the evaluation of linear erosion in the waterways. However, runoff models that represent peak discharge require a lot of spatially distributed data, which, in our case, were not available. Moreover, as Gumuk is a very small watershed (4.5 ha), short in-tense rainfall events (less than 2 h) produced short runoff events (less than 4 h), and
15
total runoff volume at outlet was therefore a good indicator of the intensity of runoff flow (an affine regression between total runoff and peak flow on 9 events gave a positive relation withr2 = 0.81). However modeling longer runoff events in a larger watershed would require taking temporal dynamics into account (Morgan et al., 1998).
4.2 Spatial distribution of runoff production and accumulation
20
Runoff production was modeled using a limited number of input parameters. Based on field observations and laboratory experiments, the soil parameters in the watershed were considered to be homogenous. However, a more detailed analysis could reveal some heterogeneity of the soil hydrodynamic properties, and could also reveal the con-tribution of soil variability to the variability of runoff production. This soil heterogeneity
25
could be then added in the STREAM model through the properties of plots.
Human activities can greatly modify runoff concentration pathways (Souchere et al., 1998; Moussa et al., 2002). In this study site, which is characterized by small size, high
HESSD
12, 9701–9740, 2015Modeling runoff and erosion risk in a small steep cultivated watershed B. Auvet et al. Title Page Abstract Introduction Conclusions References Tables Figures J I J I Back Close
Full Screen / Esc
Printer-friendly Version Interactive Discussion Discussion P a per | Discussion P a per | Discussion P a per | Discussion P a per |
slope variability, and the effect of many human actions on the topography (construction of waterways, terraces, and ridges), runoff circulation was not clear. A high resolu-tion DEM was therefore required to simulate the flow direcresolu-tions at plot and waterway scales. A precise description of the topography was possible because the watershed is small. In a larger watershed, remote sensing could be used to produce a DEM, but
5
its precision would not be sufficient to represent the impact of farmers’ practices on the distribution of runoff.
Precipitation was considered to be homogeneous throughout the watershed, but in fact, the relief and the wind may have a major impact on the distribution of precipitation within the watershed. A better representation of rainfall distribution would require
sev-10
eral weather stations (for instance on both banks of the main stream) and a distributed model of precipitation.
4.3 Validation of distributed runoff model
Measurements of runoff accumulation in plots, and in natural and human-made water-ways made it possible to quantitatively validate the runoff model. However, these
mea-15
surements are delicate and time consuming and their coherence at different scales is not guaranteed (Le Bissonnais et al., 1998). The low accuracy measurements made during the present study could only be used for the purpose of comparison and to give an order of magnitude. The use of farmers’ knowledge on runoff concentration and pro-duction in their plots was also delicate, mainly because perceptions may vary between
20
farmers and differ from scientific measures and observations. However, interviews con-ducted with the farmers in their fields enabled us to compare and calibrate farmers’ perceptions with our own observations. The validation of runoff estimated by the dis-tributed STREAM model was not based on accurate measures but on the consistency of the simulated results, field observations, and farmers’ knowledge. Nevertheless, the
25
distributed runoff model enabled us to understand the runoff distribution within the wa-tershed. It showed how the farmers managed runoff, built ridges and water channels
HESSD
12, 9701–9740, 2015Modeling runoff and erosion risk in a small steep cultivated watershed B. Auvet et al. Title Page Abstract Introduction Conclusions References Tables Figures J I J I Back Close
Full Screen / Esc
Printer-friendly Version Interactive Discussion Discussion P a per | Discussion P a per | Discussion P a per | Discussion P a per |
to control the runoff that accumulated in their plots and to redirect the runoff flow away from the downstream plots.
Quantitative validation of the distributed runoff model would require measurements of runoff flow inside fields and waterways.
4.4 Erosion models
5
Susceptibility to erosion did not account for the impacts of erosion (or resilience to ero-sion) like vulnerability studies (Leone and Vinet, 2006). Including vulnerability would require assessing the impacts of erosion in the short term (on farm income) and in the long term (loss of arable land). An erosion event could have a cascade of conse-quences and the different forms of erosion were not independent. For instance, field
10
observations revealed that linear erosion in waterways could cause a landslide, a small landslide could cause a bigger one during the following rainfall event, and an erosion event could modify both the topography and the vegetal cover. Assessing these cumu-lated risks would require other field surveys and further interviews with farmers.
Quantitative validation of the erosion risk models would require measurements of
15
sediment yield and topography in different locations inside the plots and in waterways. One of the main difficulties would be identifying the contribution of the different forms of erosion to sediment yields using isotopic C-137 or granulometry, for instance. It would require long term on-site measurements that are both technically difficult and expensive.
20
Qualitative validation of erosion risk maps was based on our field observations and farmers’ interviews. Field observations concerned only the current cropping season, and the farmers provided historical information. The information provided by the farm-ers about the preceding cropping season had to be checked and harmonized by com-paring it to field observations and using photos of traces of erosion. More complex
25
physically-based models would be extremely difficult to calibrate and validate because of the lack of data and due to the specificities of the watershed: marked variability in slope and the impacts of agricultural practices and topography that can differ from year
HESSD
12, 9701–9740, 2015Modeling runoff and erosion risk in a small steep cultivated watershed B. Auvet et al. Title Page Abstract Introduction Conclusions References Tables Figures J I J I Back Close
Full Screen / Esc
Printer-friendly Version Interactive Discussion Discussion P a per | Discussion P a per | Discussion P a per | Discussion P a per |
to year. Moreover, the simulated sediment yield would be the product of different forms of erosion.
5 Conclusions
The spatially distributed models (runoof and erosion risks) developed in this study used a variety of data sources for their calibration and validation when classical data were
5
missing. The distributed runoff model enabled us to build maps of three major forms of erosion risk. These models mainly provided an order of magnitude or qualitative re-sults. However they enabled a better understanding of phenomena, particularly their distribution. First, models enabled the researcher to locate erosion issues especially those combining forms of erosion that had not been identified during the field
obser-10
vations. The farmers confirmed the importance of those locations for the management of erosion. Second, models gave a distributed and global representation of erosion that differed from the farmers’ scale. The aim of the agricultural practices used by the farmers in their fields was managing runoff concentration, diverting flow from the main slope through tillage, and channelling the water in waterways. But the risk of erosion
15
increased with slope and runoff flow was therefore higher in downstream plots. Thus, managing erosion risk calls for coordination at basin or sub-basin scale. The modelling approach we developed was therefore an appropriate way to get round the lack of quantitative data.
Maps of erosion risks could be used to draw up plans for coordinated practices and
20
their location. Runoff models could be used to test the effect of these practices on runoff flow, the hazard part of erosion risk. Designing strategies to reduce erosion risks could be done classically by external experts (Turkelboom et al., 2008) or with the participation of farmers (Souchère et al., 2010; Furlan et al., 2012). The second approach would have the advantage of envisaging and discussing solutions that can
25
HESSD
12, 9701–9740, 2015Modeling runoff and erosion risk in a small steep cultivated watershed B. Auvet et al. Title Page Abstract Introduction Conclusions References Tables Figures J I J I Back Close
Full Screen / Esc
Printer-friendly Version Interactive Discussion Discussion P a per | Discussion P a per | Discussion P a per | Discussion P a per |
could be a support for reflection by the farmers: the maps we produced are accurate, simple, intuitive, and compatible with the farmers’ perceptions.
Acknowledgements. This research was funded by the project “Integrated and Participatory
Wa-ter Resources Management towards effective agricultural system in Klaten Regency” financed by Danone-Aqua and coordinated by CIRAD. We would like to thank the Balai Pengkajian and
5
Teknologi Pertanian of Yogyakarta (BPTP DIY) for their support in the field. We are very grate-ful to Pak Bruto and his wife for their warm welcome and their three month hospitality. We are deeply grateful to Putra Nasution for his help in the field and thank the inhabitants of Gumuk for their kindness and availability.
References
10
Abbot, J. I., Thomas, D. H., Gardner, A. A., Neba, S. E., and Khen, M. W.: Understanding the links between conservation and development in the bamenda highlands, Cameroon, World Dev., 29, 1115–1136, 2001.
Barnaud, C., Promburom, P., Bousquet, F., and Trébuil, G.: Companion modelling to facilitate collective land management by Akha villagers in Upper Northern Thailand, in: Sustainable
15
Use of natural Resources and Poverty Dialogue in Montane Mainland South East Asia (MM-SEA IV), 16–19 May 2005, Sapa, Vietnam, 2005.
Cerdan, O., Le Bissonnais, Y., Couturier, A., and Saby, N.: Modelling interrill erosion in small cultivated catchments, Hydrol. Process., 16, 3215–3226, 2002.
Colmar, A., Walter, C., Le Bissonnais, Y., and Daroussin, J.: Démarche de validation régionale
20
par avis d’experts d’un modèle d’estimation de l’aléa érosif, Etude et Gestion des Sols, 17, 19–32, 2010.
DeLaune, P. B. and Sij, J. W.: Impact of tillage on runoff in long term no-till wheat systems, Soil Till. Res., 124, 32–35, 2012.
Descroix, L., Nouvelot, J.-F., and Vauclin, M.: Evaluation of an antecedent precipitation index to
25
model runoff yield in the western sierra madre (north-west mexico), J. Hydrol., 263, 114–130, 2002.
Dlamini, P., Orchard, C., Jewitt, G., Lorentz, S., Titshall, L., and Chaplot, V.: Controlling factors of sheet erosion under degraded grasslands in the sloping lands of KwaZulu-Natal, South Africa, Agr. Water Manage., 98, 1711–1718, 2011.
HESSD
12, 9701–9740, 2015Modeling runoff and erosion risk in a small steep cultivated watershed B. Auvet et al. Title Page Abstract Introduction Conclusions References Tables Figures J I J I Back Close
Full Screen / Esc
Printer-friendly Version Interactive Discussion Discussion P a per | Discussion P a per | Discussion P a per | Discussion P a per |
Michel, E.: Companion Modelling, Quae, France, 368 pp., 2011.
Evrard, O., Cerdan, O., van Wesemael, B., Chauvet, M., Le Bissonnais, Y., Raclot, D., Van-daele, K., Andrieux, P., and Bielders, C.: Reliability of an expert-based runoff and erosion model: application of STREAM to different environments, Catena, 78, 129–141, 2009. Forsyth, T. J.: The use of cesium-137 measurements of soil erosion and farmers’ perceptions
5
to indicate land degradation amongst shifting cultivators in northern Thailand, Mt. Res. Dev., 14, 229–244, 1994.
Furlan, A., Poussin, J. C., Mailhol, J. C., Le Bissonnais, Y., and Gumiere, S. J.: Designing man-agement options to reduce surface runoff and sediment yield with farmers: an experiment in South-Western France, J. Environ. Manage., 96, 74–85, 2012.
10
Giménez, R., Casalí, J., Grande, I., Díez J., Campo, M. A., Álvarez-Mozos, J., and Goñi, M.: Factors controlling sediment export in a small agricultural watershed in Navarre (Spain), Agr. Water Manage., 110, 1–8, 2012.
Guzha, A. C.: Effects of tillage on soil microrelief, surface depression storage and soil water storage, Soil Till. Res., 76, 105–114, 2004.
15
Jetten, V., Govers, G., and Hessel, R.: Erosion models: quality of spatial predictions, Hydrol. Process., 17, 887–900, 2003.
Le Bissonnais, Y., Benkhadra, H., Chaplot, V., Fox, D., King, D., and Daroussin, J.: Crusting, runoff and sheet erosion on silty loamy soils at various scales and upscaling from m2to small catchments, Soil Till. Res., 46, 69–80, 1998.
20
Leone, F. and Vinet, F.: La vulnérabilité des sociétés et des territoires face aux menaces na-turelles, in: Analyses Géographiques, Coll. Géorisques, Publications de l’université Paul-Valéry Montpellier 3, 71 pp., 2006.
Liu, Y., Tao, Y., Wan, K. Y., Zhang, G. S., Liu, D. B., Xiong, G. Y., and Chen, F.: Runoff and nutrient losses in citrus orchards on sloping land subjected to different surface mulching
25
practices in the Danjiangkou Reservoir area of China, Agr. Water Manage., 110, 34–40, 2012.
López-Vicente, M., Navas, A., Gaspar, L., and Machín, J.: Advanced modelling of runoff and soil redistribution for agricultural systems: the SERT model, Agr. Water Manage., 125, 1–12, 2013.
30
Mathys, N., Brochot, S., Meunier, M., and Richard, D.: Erosion quantification in the small marly experimental catchments of Draix (Alpes de Haute Provence, France). Calibration of the ETC rainfall–runoff–erosion model, Catena, 50, 2–4, 2003.
HESSD
12, 9701–9740, 2015Modeling runoff and erosion risk in a small steep cultivated watershed B. Auvet et al. Title Page Abstract Introduction Conclusions References Tables Figures J I J I Back Close
Full Screen / Esc
Printer-friendly Version Interactive Discussion Discussion P a per | Discussion P a per | Discussion P a per | Discussion P a per |
Midmore, D. J., Jansen, H. G., and Dumsday, R. G.: Soil erosion and environmental impact of vegetable production in the cameron highlands, malaysia, Agr. Ecosyst. Environ., 60, 29–46, 1996.
Montanari, A., Young, G., Savenije, H. H. G., Hughes, D., Wagener, T., Ren, L. L., Koutsoyian-nis, D., Cudennec, C., Toth, E., Grimaldi, S., Blöschl, G., Sivapalan, M., Beven, K., Gupta, H.,
5
Hipsey, M., Schaefli, B., Arheimer, B., Boegh, E., Schymanski, S. J., Di Baldassarre, G., Yu, B., Hubert, P., Huang, Y., Schumann, A., Post, D. A., Srinivasan, V., Harman, C., Thomp-son, S., Rogger, M., Viglione, A., McMillan, H., Characklis, G., Pang, Z., and Belyaev, V.: Panta Rhei – Everything Flows: change in hydrology and society – the IAHS scientific decade 2013–2022, Hydrolog. Sci. J., 58, 1256–1275, 2013.
10
Morgan, R. P. C., Quinton, J. N., Smith, R. E., Govers, G., Poesen, J. W. A., Auerswald, K., Chisci, G., Torri, D., and Styczen, M. E.: The European Soil Erosion Model (EUROSEM): a dynamic approach for predicting sediment transport from fields and small catchments, Earth Surf. Proc. Land., 23, 527–544, 1998.
Moussa, R., Voltz, M., and Andrieux, P.: Effects of the spatial organization of agricultural
man-15
agement on the hydrological behaviour of a farmed catchment during flood events, Hydrol. Process., 16, 393–412, 2002.
Nash, J. and Sutcliffe, J.: River flow forecasting through conceptual models. Part I: A discussion of principles, J. Hydrol., 10, 282–290, 1970.
Nyssen, J., Poesen, J., Haile, M., Moeyersons, J., and Deckers, J.: Tillage erosion on slopes
20
with soil conservation structures in the ethiopian highlands, Soil Till. Res., 57, 115–127, 2000.
Prasannakumar, V., Vijith, H., Abinod, S., and Geetha, N.: Estimation of soil erosion risk within a small mountainous sub-watershed in Kerala, India, using Revised Universal Soil Loss Equation (RUSLE) and geo-information technology, Geosci. Front., 3, 209–215, 2012.
25
Randrianarijaona, P.: The erosion of Madagascar, the Indian Ocean, Ambio, 12, 308–311, 1983.
Rijsdijk, A., Bruijnzeel, L. S., and Prins, T. M.: Sediment yield from gullies, riparian mass wasting and bank erosion in the upper konto catchment, East Java, Indonesia, Geomorphology, 87, 38–52, 2007.
30
Roose, E. and Ndayizigiye, F.: Agroforestry, water and soil fertility management to fight erosion in tropical mountains of Rwanda, Soil Technol., 11, 109–119, 1997.
HESSD
12, 9701–9740, 2015Modeling runoff and erosion risk in a small steep cultivated watershed B. Auvet et al. Title Page Abstract Introduction Conclusions References Tables Figures J I J I Back Close
Full Screen / Esc
Printer-friendly Version Interactive Discussion Discussion P a per | Discussion P a per | Discussion P a per | Discussion P a per |
Sharda, V. N., Patel, R. M., Prasher, S. O., Ojasvi, P. R., and Prakash, C.: Modeling runoff from middle Himalayan watersheds employing artificial intelligence techniques, Agr. Water Manage., 83, 233–242, 2006.
Souchère, V., King, D., Daroussin, J., Papy F, and Capillon, A.: Effects of tillage on runoff direc-tions: consequences on runoff contributing area within agricultural catchments, J. Hydrol.,
5
206, 256–267, 1998.
Souchère, V., Cerdan, O., Ludwig, B., Bissonnais, Y. L., Couturier, A., and Papy, F.: Modelling ephemeral gully erosion in small cultivated catchments, Catena, 50, 489–505, 2003.
Souchère V., Millair, L., Echeverria, J., Bousquet, F., Le Page, C., and Etienne, M.: Co-constructing with stakeholders a role-playing game to initiate collective management of
ero-10
sive runoff risks at the watershedscale, Environ. Modell. Softw., 25, 1359–1370, 2010. Turkelboom, F., Poesen, J., Ohler, I., and Ongprasert, S.: Reassessment of tillage erosion rates
by manual tillage on steep slopes in northern Thailand, Soil Till. Res., 51, 245–259, 1999. Turkelboom, F., Poesen, J., and Trébuil, G.: The multiple land degradation effects caused by
land-use intensification in tropical steeplands: a catchment study from northern Thailand,
15
Catena, 75, 102–116, 2008.
Turner, B., Kasperson, R., Matson, P., McCarthy, J., Corell, R., Christensen, L., Eckley, N., Kasperson, J., Luers, A., Martello, M., Polsky, C., Pulsipher, A., and Schiller, A.: A framework for vulnerability analysis in sustainability science, P. Natl. Acad. Sci. USA, 100, 8074–8079, 2003.
20
Valentin, C., Agus, F., Alamban, R., Boosaner, A., Bricquet, J. P., Chaplot, V., de Guzman, T., de Rouw, A., Janeau, J. L., Orange, D., Phachomphonh, K., Do Duy Phai, Podwojewsk, I. P., Ribolzi, O., Silvera, N., Subagyono, K., Thiébaux, J. P., Tran Duc Toan, and Vadari, T.: Runoff and sediment losses from 27 upland catchments in Southeast Asia: Impact of rapid land use changes and conservation practices, Agr. Ecosyst. Environ., 128, 225–238, 2008.
25
Van Dijk, A.: Water and sediment dynamics in bench-terraced agricultural steeplands in West Java, Indonesia, Ph.D. Thesis, Vrije Universiteit Amsterdam, ISBN 90-9016046-9, 2002. Vezina, K., Bonn, F., and Van, C. P.: Agricultural land-use patterns and soil erosion vulnerability
HESSD
12, 9701–9740, 2015Modeling runoff and erosion risk in a small steep cultivated watershed B. Auvet et al. Title Page Abstract Introduction Conclusions References Tables Figures J I J I Back Close
Full Screen / Esc
Printer-friendly Version Interactive Discussion Discussion P a per | Discussion P a per | Discussion P a per | Discussion P a per |
Table 1. Decision table for the infiltration capacity (mm h−1) according to the slope index, soil
surface roughness, and plant cover.
Slope index in degrees
Roughness Plant cover 0–10 10–15 15–20 20–25 > 25
zero Sparse crop with no weeds 35 25 15 5 5
Crop with some weeds 35 30 20 10 5
Crop with weed or grassland 40 35 25 15 10
Highly vegetated 40 35 30 25 15
low (natural) Sparse crop with no weeds 40 30 20 10 5
Crop with some weeds 40 35 25 15 10
Crop with weeds or grassland 40 35 30 20 15
Highly vegetated 45 40 35 25 20
medium Few crop with no weeds 40 35 25 15 5
(small rill) Crop with some weeds 40 35 30 20 10
Crop with weeds or grassland 45 40 35 25 20
Highly vegetated 45 40 35 30 25
strong Sparse crop with no weeds 40 35 25 15 10
(dug rill) Crop with some weeds 40 35 30 20 10
Crop with weeds or grassland 45 40 35 30 25
Highly vegetated 50 45 40 35 30
strong and Sparse crop with no weeds 40 35 30 20 15
irregular Crop with some weeds 40 35 30 25 20
Crop with weeds or grassland 45 45 40 35 30
HESSD
12, 9701–9740, 2015Modeling runoff and erosion risk in a small steep cultivated watershed B. Auvet et al. Title Page Abstract Introduction Conclusions References Tables Figures J I J I Back Close
Full Screen / Esc
Printer-friendly Version Interactive Discussion Discussion P a per | Discussion P a per | Discussion P a per | Discussion P a per |
Table 2. Decision table for determining the imbibition volume (mm) according to categories of
infiltration capacity and API.
Infiltration capacity API (mm)
(mm h−1) 0–2 2–6 6–9 > 9 0 0 0 0 0 5 7 1 0 0 10 8 2 0 0 15 8 2 0 0 20 9 3 0 0 25 9 3 0 0 30 10 4 0 0 35 11 5 1 0 40 11 5 1 0 45 12 6 2 0 50 13 7 3 1
HESSD
12, 9701–9740, 2015Modeling runoff and erosion risk in a small steep cultivated watershed B. Auvet et al. Title Page Abstract Introduction Conclusions References Tables Figures J I J I Back Close
Full Screen / Esc
Printer-friendly Version Interactive Discussion Discussion P a per | Discussion P a per | Discussion P a per | Discussion P a per | a) b)
Figure 1. (a) Topographic map of the Gumuk bassin and (b) photo taken from the south-east