HAL Id: hal-03122642
https://hal.umontpellier.fr/hal-03122642
Submitted on 27 Jan 2021
HAL is a multi-disciplinary open access
archive for the deposit and dissemination of
sci-entific research documents, whether they are
pub-lished or not. The documents may come from
teaching and research institutions in France or
abroad, or from public or private research centers.
L’archive ouverte pluridisciplinaire HAL, est
destinée au dépôt et à la diffusion de documents
scientifiques de niveau recherche, publiés ou non,
émanant des établissements d’enseignement et de
recherche français ou étrangers, des laboratoires
publics ou privés.
Phenetic and genetic structure of tsetse fly populations
(Glossina palpalis palpalis) in southern Ivory Coast
Dramane Kaba, Sophie Ravel, Geneviève Acapovi-Yao, Philippe Solano, Koffi
Allou, Henriette Bosson-Vanga, Laëtitia Gardes, Eliezer Kouakou N’Goran,
Christopher Schofield, Moussa Koné, et al.
To cite this version:
Dramane Kaba, Sophie Ravel, Geneviève Acapovi-Yao, Philippe Solano, Koffi Allou, et al.. Phenetic
and genetic structure of tsetse fly populations (Glossina palpalis palpalis) in southern Ivory Coast.
Parasites & Vectors, 2012, 5 (1), pp.153. �10.1186/1756-3305-5-153�. �hal-03122642�
R E S E A R C H
Open Access
Phenetic and genetic structure of tsetse fly
populations (Glossina palpalis palpalis) in
southern Ivory Coast
Dramane Kaba
1, Sophie Ravel
2, Genevi`eve Acapovi-Yao
3, Philippe Solano
4, Koffi Allou
3,
Henriette Bosson-Vanga
1, Laetitia Gardes
2, Eliezer Kouakou N’Goran
3, Christopher John Schofield
5,
Moussa Kon´e
1and Jean-Pierre Dujardin
6*Abstract
Background: Sleeping sickness, transmitted by G. p. palpalis, is known to be present in the Ivory Coast. G. p. palpalis
has recently been reported to occur in several places within the town of Abidjan, including: (i) the Banco forest, (ii) the Abobo Adjam´e University campus and (iii) the zoological park. Could these three places be treated sequentially, as separate tsetse populations, or should they be taken as one area comprising a single, panmictic population?
Methods: The amount of gene flow between these places provides strategic information for vector control. It was
estimated by the use of both microsatellite DNA and morphometric markers. The idea was to assess the interest of the faster and much less expensive morphometric approach in providing relevant information about population
structure. Thus, to detect possible lack of insect exchange between these neighbouring areas of Abidjan, we used both genetic (microsatellite DNA) and phenetic (geometric morphometrics) markers on the same specimens. Using these same markers, we also compared these samples with specimens from a more distant area of south Ivory Coast, the region of Aniassu´e (186 km north from Abidjan).
Results: Neither genetic nor phenetic markers detected significant differentiation between the three Abidjan G. p.
palpalis samples. Thus, the null hypothesis of a single panmictic population within the city of Abidjan could not be
rejected, suggesting the control strategy should not consider them separately. The markers were also in agreement when comparing G. p. palpalis from Abidjan with those of Aniassu ´e, showing significant divergence between the two sites.
Conclusions: Both markers suggested that a successful control of tsetse in Abidjan would require the three Abidjan
sites to be considered together, either by deploying control measures simultaneously in all three sites, or by a continuous progression of interventions following for instance the “rolling carpet” principle. To compare the geometry of wing venation of tsetse flies is a cheap and fast technique. Agreement with the microsatellite approach highlights its potential for rapid assessment of population structure.
Background
Tsetse flies (Diptera: Glossinidae) are the main vec-tors of trypanosomes (Kinetoplastida: Trypanosomati-dae), which cause human and animal trypanosomiases in subsaharan Africa. These diseases have a consider-able impact on public health and economic development
*Correspondence: dujardinbe@gmail.com
6IRD, UMR 5090 MIVEGEC, Avenue Agropolis, IRD, Montpellier, France Full list of author information is available at the end of the article
[1], although there are recent signs of a decline in inci-dence of the human disease following WHO-supported interventions based on case detection and treatment [2-4]. Vector control is an important complement to case detection and treatment, because reducing vector den-sity can rapidly halt human trypanosomiasis transmission [5,6]. Vector control also remains the only strategy able to protect humans from acquiring a new infection [7].
© 2012 Kaba et al.; licensee BioMed Central Ltd. This is an Open Access article distributed under the terms of the Creative Commons Attribution License (http://creativecommons.org/licenses/by/2.0), which permits unrestricted use, distribution, and reproduction in any medium, provided the original work is properly cited.
Kaba et al. Parasites & Vectors 2012, 5:153 Page 2 of 9 http://www.parasitesandvectors.com/content/5/1/153
Tsetse populations may be reduced using a variety of techniques, including insecticide impregnated traps and targets, live-baits, sequential aerial spraying, and sterile male release [8-13]. However, in many cases when the control efforts have been stopped, the tsetse populations tend to recover due to flies surviving the initial interven-tions, or migrant flies coming from untreated regions, or both.
This has fueled debate as to whether in some instances “eradication” (defined by FAO as the creation of a tsetse free zone) may be more cost-effective than “suppres-sion” where tsetse densities are reduced to a level min-imizing the risk of disease transmission. Decisions on eradication or suppression strategies will be facilitated when the population structure within the target region, in particular the degree of genetic isolation of the target population from adjacent populations is clearly under-stood [14]. For isolated populations, eradication may be the most cost-effective strategy, as reported for Glossina
austeni Newstead on Unguja Island, Zanzibar [9]. But for most mainland populations of tsetse, the geograph-ical limits of target tsetse populations are less easily defined. Application of techniques that can detect pop-ulation isolation such as molecular or morphometric markers can guide decisions on the choice of control strategies [15-17]. Human and animal trypanosomiasis transmitted by G. p. palpalis are known to be present in Ivory Coast [4,18] and G. p. palpalis has been reported to occur within the city of Abidjan [19,20]. Due to its potential danger as a vector of human and animal try-panosomiasis, the Ivorian authorities now seek to con-trol these tsetse flies in the affected area of Abidjan, which includes the Banco forest, the University of Abobo Adjam´e and the zoological park. Tsetse have been found to be present in low to high densities in these 3 sites, and were found infected by various trypanosome species [19].
To detect possible evidence of isolation between G. p.
palpalis populations in the three affected areas within Abidjan, we used both genetic (microsatellite DNA) and phenetic (geometric morphometrics) markers on the same specimens, and compared these populations to G. p.
palpalispopulations from another area of southern Ivory Coast in the region of Aniassu´e. The idea was to assess the interest of the faster and much less expensive morpho-metric approach in providing relevant information about population structure.
The expected outcome of this study was to help the national control program to decide which is the best strategy of vector control in the town of Abidjan: can these three localities be treated sequentially (i.e. are the tsetse populations isolated between the three sites), or should they be taken as one area comprising a single, panmictic population?
Results and discussion
Microsatellite DNA markers
Within sample analyses
For the total sample (n = 141) of genotyped tsetse, the seven microsatellite loci displayed 17 (Pgp1), 17 (PgP13), 14 (PgP24), 25 (B104), 19 (B110), 7 (C102), and 9 (GPCAG) alleles, respectively. The mean number of alle-les was 9.71 (Banco), 11 (University) and 10.85 (Zoo) in Abidjan, and 10.00 in Aniassu´e. Mean observed heterozy-gosities were 0.68, 0.76 and 0.77 for Banco, University and Zoo, respectively, and 0.70 in Aniassu´e (no significant difference).
Overall Fis values were 0.12, 0.09 and 0.05 for Banco, University, and Zoo, significant at p<0.0001, p<0.001, and p<0.05 respectively. In Aniassu´e, Fis was 0.15, p<0.0001. The heterozygote deficit was mainly due to two loci (PgP1 and B110) for the three populations of Abidjan (Figure 1). This suggested locus had specific technical problems (e.g. null alleles or short allele dominance), because when these loci were removed from the analysis, Fis values dropped to non-significant values (0.04, 0.00 and 0.03, respectively). Hence the null hypothesis of panmixia in Abidjan could not be rejected. In Aniassu´e, Fis on these 5 loci was 0.18 (p<0.0001), indicating consistant het-erozygote deficiency. The hethet-erozygote deficiency found in Aniassu´e confirmed earlier observations on G. p.
pal-palisin the forested areas of Ivory Coast, which attributed such deficiency to a combination of null alleles and genetic structuring at local scale due to Wahlund effects [21].
Genetic differentiation between samples
The mean Fst value for the 5 loci among the four pop-ulations was estimated at θ = 0.017 (CI95: 0.011 < θ < 0.023), p<0.0001. For the Abidjan samples it was θ = 0.007 (CI95: 0.00150 < θ < 0.01184) and was not significant, meaning that most of the differentiation was due to differ-ences between Aniassu´e and Abidjan. Looking at paired
Fstvalues between sites (Table 1) confirmed this, since the highest (and significant) values always included Aniassu´e. Within Abidjan, there was a slight but non-significant trend for the population of Banco to diverge (Fst=0.01, p<0.05) from those of University and Zoo, whereas the latter two were genetically similar.
Geometric morphometrics
Size: centroid size
The specimens from Aniassu´e were significantly smaller compared to those from Abidjan, whereas within Abidjan there was no significant size difference between flies from the three sites (Figure 2).
Shape variation
The first two discriminant factors derived from the shape variables showed that the polygon representing the
Figure 1 Fisstatistics for Glossina palpalis palpalis collected from sites of Abidjan. Fis statistics for Glossina palpalis palpalis collected from sites
of Abidjan. For each locus, the Fis mean value (circle) is presented with its standard deviation (vertical bar).
Aniassu´e population tended to separate from the Abidjan sites (Figure 3). The reclassification tree, based on all three of the discriminant factors, clearly separated the Aniassu´e sample from those from Abidjan (Figure 4).
The Mahalanobis distances between the Abidjan sam-ples (Table 1) were not significantly different, indicating an absence of shape differentiation, while the Maha-lanobis distances from Aniassu´e were significantly larger (p<0.007) (Table 1).
The validated reclassification scores confirmed this pat-tern, since Aniassu´e had the highest score (86%). However, in spite of the lack of significant differentiation within Abidjan, the reclassification score obtained for Banco (77%) was much higher than for the University (37%) and Zoo (33%), suggesting a relatively higher level of shape divergence in the Banco forest.
Correlation between metric and genetic distances was high. Regression of the Mahalanobis distances on the genetic distances indicated that 79% of the morphomet-ric variation could be explained by the genetic variation (Figure 5).
Table 1 Metric and genetic distances between sites
Population 1 Population 2 Mahalanobis Fst
Aniassu´e Banco 2.38 0.0221 Aniassu´e University 1.93 0.0328 Aniassu´e Zoo 1.98 0.0292 Banco University 1.3 0.0121 Banco Zoo 1.1 0.0113 University Zoo 0.31 -0.0034
Pairwise metric (Mahalanobis) and genetic (Fst) distances between Banco,
University, Zoo (Abidjan) and Aniassu ´e.
Genetic and morphometric differentiation
From an epidemiological point of view, our study aimed at knowing whether tsetse populations from three sites in Abidjan could be considered to be isolated from each other. Such information is relevant for designing an ade-quate tsetse control strategy. For example, an insecticide application could be sequential in case of separation between sites, working on each site separately without risk of reinvasion to the next, or it should simultaneously cover all three sites if no evidence for separation is found.
We used a population genetics approach [7] to analyse possible separation between the three Abidjan popula-tions, comparing genetic and phenetic markers. Thus, the study also tested the potential of geometric morphomet-rics as a possible surrogate for molecular markers.
Figure 2 Size variation of the wings. Variation of the centroid size of the wing of male Glossina palpalis palpalis according to localities. Anias, Aniassu´e. Each box shows the group median separating the 25th and 75th quartiles. Vertical bars under the boxes represent the wings. Units are pixels. P, percentile.
Kaba et al. Parasites & Vectors 2012, 5:153 Page 4 of 9 http://www.parasitesandvectors.com/content/5/1/153
Figure 3 Morphospace derived from the shape of the wings. Morphospace of the wings of male Glossina palpalis palpalis, the horizontal axis is the first discriminant factor, the vertical axis is the second one. Together, they contributed to of 99% of the total variation.
Figure 4 Classification tree based on the shape of the wings. Unrooted neighbor joining tree based on the Procrustes distances between G. p. palpalis wings from four localities.
Figure 5 Correlation between Fstand Mahalanobis distances.
Correlation between Fstand Mahalanobis distances. Coefficient of
determination is 79%. A, Aniassu´e; B, Banco; U, University; Z, Zoo.
Both the phenetic (geometric morphometrics) and genetic (microsatellite loci) markers showed no evidence for differentiation between G. p. palpalis from sites within Abidjan, but both markers agreed in showing strong differentiation between individuals from Aniassu´e and those from Abidjan.
Within Abidjan
At the scale of Abidjan, our data showed that males from the three sites showed no genetic differentiation, and accordingly had similar metric properties (size and shape). The microsatellite markers did not show any signifi-cant departure from the null hypothesis of panmixia, i.e. we did not observe any genetic differentiation between the 3 populations within Abidjan. There was however a slight, non significant trend for the population of Banco to diverge from the two others. A possible explanation is then a slow, on-going process for this population of Banco to have less genetic exchanges with the two others, due to urbanization which restricts tsetse movements. It may be possible, as observed in other studies in Burkina Faso, that the molecular markers used are not sensitive enough to detect it, since this is a recent, on-going phenomenon whereas what the molecular markers show is the result of a genetic history over several generations. This lack of sen-sitivity of molecular markers for recent genetic changes has already been observed in tsetse studies [22], and may be compensated by the use of morphometrics.
This idea is reflected by the much higher shape-based reclassification score obtained for Banco (77%), com-pared to the two other sites (37% and 33%). This indirect evidence for some morphometric specificity in the forest might be due to an environmental effect (“forest” versus “city”), although in tsetse most of the pre-imago devel-opment is relatively protected from external influences as tsetse larvae grow in the uterus of their mother during the three first stages, buffering morphometric variations against external influences [23].
Temperature and humidity do become influential fac-tors at the time when pupae are in the soil. The effect has been studied for size (not shape), indicating that higher temperatures tend to result in smaller individuals [23], whereas increasing humidity tends to result in larger indi-viduals [24]. It has been shown that the size of G. p.
palpalisin forested areas of Ivory Coast is governed by seasonal climatic effects [25]. In Abidjan, no size differ-ence was detected between sites, and given their proximity it seems likely that environmental factors acted uniformly on size.
Between Abidjan and Aniassu´e
By contrast, both molecular (microsatellite loci) and mor-phometric (centroid size and shape variables) data showed significant differences between tsetse from Abidjan and Aniassu´e. This was expected due to the geographic dis-tance between the two sites (186 km), to the differences of biotopes, and to the fact that the tsetse belt in South Ivory Coast is discontinuous as a consequence of anthropic pressure on habitats.
The tsetse from Aniassu´e were smaller than those from Abidjan. This was in agreement with both the slightly higher temperature [23] and dryer conditions [24,26] in Aniassu´e.
The differences between G. p. palpalis from Abidjan and Aniassu´e also involved shape, which may reflect genetic variations [23,27], especially when shape is allometry-free [28-30]. This was confirmed by differences found using microsatellite DNA markers. The parallel between phe-netic and gephe-netic markers applied to natural populations is not uncommon [30]; for G. p. gambiensis, a similar parallel was observed in natural populations of different biotopes from West Africa [31], Guinea [15], Burkina Faso [32] and Senegal [17]. Here, 79% of the variance in Mahalanobis distance could be “explained” by genetic variation (com-pared to 50% in study by [17]) study). This correlation does not imply a causal relationship, and could be attributed to both phenetic and genetic distances being related to geographical distances [33].
The heterozygote deficits found in Aniassu´e confirmed earlier observations on G. p. palpalis in the forested areas of Ivory Coast, which attributed such deficits to a combi-nation of null alleles and genetic structuring at local scale due to Wahlund effects [21].
Conclusions
How can the knowledge of population structure help to choose a control strategy? Since microsatellite and morphometric markers did not show significant differ-entiation between tsetse from the three sites in Abidjan, there would appear to be no significant barrier to gene flow at this scale. From a control perspective, this means that intervention against tsetse in any one site is likely
to face reinvasion from the other two. This is different from a similar study conducted on the Loos archipelago, Guinea, which showed that tsetse populations (G.
pal-palis gambiensis) were isolated from the mainland and structured according to the island [15,34], which then allowed a sequential control strategy to be implemented [16,35]. Successful control of tsetse in Abidjan however, would require all three sites to be considered together (Figure 6), either by deploying control measures simulta-neously in all three sites, or by a continuous progression of interventions - for example using barriers of impregnated traps and/or targets between sites (Figure 7) following the “rolling carpet” principle [36].
Methods
Study area
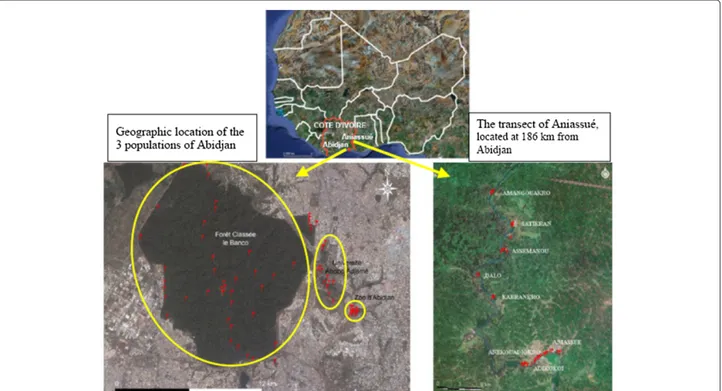
In Abidjan, the three study sites were the Banco for-est (Banco), the University of Abobo Adjam´e (University) and the zoological park (Zoo). The Banco forest is in the north-western part of the city of Abidjan, at 5°N latitude and 4°W longitude. East of Banco are two small relicts of the forest which have now been substantially degraded by urbanisation: the Abobo Adjam´e University and the zoo of Abidjan. These three sites, although geographically close (less than 500 meters between sites), are separated by roads and urbanisation (Figure 8). For comparison, another study site was chosen near the town of Aniassu´e, about 186 km from Abidjan, in the Department of Aben-gourou, where G. p. palpalis occurs along the Como´e river. This region is characterized by forest degraded by wood cutting, and also by food crops (banana, cassava) and old cocoa plantations.
Figure 6 Eradication strategy. Eradication strategy by controlling simultaneously the three sites. Blue dotted line: limits of the area to be treated simultaneously. Yellow curves: limits of target sites A: Relic forest of Anguededou not infested by tsetse flies.
Kaba et al. Parasites & Vectors 2012, 5:153 Page 6 of 9 http://www.parasitesandvectors.com/content/5/1/153
Figure 7 The “rolling carpet” principle. Eradication strategy in stages, site after site, but by creating barriers with traps or impregnated screens between Zoo and University (barrier C), University and Banco (barrier B), using the “rolling carpet” principle (Vreysen et al., 2007). The yellow arrow indicates the diection of the steps.
There is little temperature difference between Abidjan (from 24.2°C to 27.7°C) and Aniassu´e (from 24.3°C to 27.9°C), but relatively more variation in relative humidity (RH), which decreases from south (RH on average 90%) to north (RH between 60% and 70%). In both areas, there are two rainy and two dry seasons during a year [37].
Tsetse samples and microsatellite DNA markers
Tsetse flies were caught using Vavoua traps [38] in April 2007 in Aniassu´e and in October 2007 in Abidjan. In total from Abidjan 111 individual tsetse were analysed using microsatellite DNA markers: Banco (25 females (F), 11 males (M)); University (21 F, 17 M) and Zoo (21 F, 16 M). From Aniassu´e, 30 individuals were analysed (15 F and 15 M). Seven microsatellite markers were used (preceded by “X” for X-linked loci): Pgp1, XPgp13, Pgp24 [39], XB104, XB110, C102 (A. Robinson, FAO/IAEA, pers. com.) and GPCAG [40]. The samples were processed for Polymerase Chain Reaction (PCR) and genotyping on a 4300 DNA Analysis System from LI-COR (Lincoln, NE) as described in [34].
Population genetics analyses on molecular markers
Wright’s F-statistics [41], the parameters most widely used to describe population genetic structure, were initially defined for a three-level hierarchical population struc-ture (individuals, sub-populations, and total). In such a structure, three fixation indices or F-statistics can be defined.
Fisis a measure of the inbreeding of individuals (hence I) resulting from non-random union of gametes within each sub-population (hence S).
Fst quantifies the differentiation between subpopula-tions in the total population (hence S and T) as a measure of the relatedness between individuals resulting
Figure 9 Anatomical landmarks of the wing. Ten landmarks at the junction of different veins in the wing of Glossina palpalis palpalis. Scale indicates millimeters.
from non-random distribution of individuals between sub-populations, relative to the total population.
Fitis a measure of the inbreeding of individuals resulting both from non-random union of gametes within sub-populations, and from population structuring (deviation from panmixia of all individuals of the total population, hence I and T).
These F-statistics were estimated by Weir and Cocker-ham ’s unbiased estimators f (for Fis), θ (for Fst) and F (for
Fit) [42]. The significance of the F-statistics was tested by 1000 random permutations in each case. The significance of Fiswas tested by randomizing alleles between individu-als within sub-samples. The significance of Fstwas tested by randomizing individuals among sub-samples.
Geometric morphometrics analyses
The tsetse specimens used for geometric morphometrics constituted a subsample of those on which the molec-ular analyses were done. Out of the 141 flies used for microsatellites, 55 had non-damaged wings allowing mor-phometric analyses. The analyses were conducted only on males, and focused on the right wing, which was generally the wing in best conditions. A total of 55 right wings of
Table 2 Reclassification of tsetse individuals based on the shape of the wings
Populations Correctly assigned individuals
Aniassu´e 13 / 15 86%
Banco 7 / 9 77%
University 6 / 16 37%
Zoo 5 / 15 37%
Validated reclassification of tsetse individuals based on the shape of their wings.
G. p. palpalismales (M) were used, i.e. 9 from Banco, 16 from University, 15 from Zoo and 15 from Aniassu´e.
Wings were dry-mounted between two microscope slides and scanned at 1800 ppp at dimensions of 0.90 x 0.50 cm, using a multifunction scanner HP Deskjet F 2180. From this picture, the coordinates of 10 landmarks (LM) defined by vein intersections were recorded for each wing, by the same person in the same order (Figure 9). Repeatability was estimated at better than 80% (discussed elsewhere:[43]).
Raw coordinates were superimposed using the Gener-alized Procrustes Analysis (GPA) [44,45], producing one variable for size and 16 variables for shape.
The size variable was the isometric estimator known as centroid size (CS) derived from coordinate data and defined as the square root of the sum of the squared distances between the center of the configuration of land-marks, and each individual landmark [46]. Statistical sig-nificance for size comparisons was estimated by 1,000 permutation tests [47] with Bonferroni correction.
The 16 shape variables were the “partial warps” (PW). To circumvent the problem of small sample sizes rela-tive to the large number of shape variables (16 PW), we used the first 6 principal components of the PW (relative warps, RW) as input for discriminant analyses, as these represented 84% of the total variation and had the highest discriminatory power [48].
Mahalanobis distances [49] computed from these 6 RW were used to quantify shape divergence between groups (Figure 4) and the statistical significance was estimated by 1000 permutation tests [50] with Bonferroni correction.
Mahalanobis distances based re-classification scores were computed according to a validation procedure whereby each individual was assigned to its closest group
Kaba et al. Parasites & Vectors 2012, 5:153 Page 8 of 9 http://www.parasitesandvectors.com/content/5/1/153
without using that individual to help determine a group centre [33], although the computed shape variables did include that individual [43] (Table 2).
Software
Collections of anatomical landmarks of the wings, general Procrustes analysis (GPA), multivariate and discriminant analyses, were performed using the CLIC package [43], freely available at http://www.mpl.ird.fr/morphometrics/ clic/index.html. PHYLIP software with “neighbor” mod-ule [51] and NJPLOT [52] were used to build the clas-sification tree. The F-statistics from molecular data were estimated with Genetix [53] and Fstat 2.9.3.2 (updated from [54]). The overall G-test was used to estimate the significance of Fstwith Fstat [55].
Competing interests
The authors declare that they have no competing interests.
Authors’ contributions
Genetic techniques: SR, KA, LG, EKN’G, PS. Morphometric techniques: DK, HB-V, J-PD. Data analyses: DK, SR, PS, J-PD. Field collections: DK, MK, GA-Y. Text: DK, PS, J-PD, CJS. All authors read and approuved the final version of the manuscript.
Acknowledgements
We thank Prof. Mike Lehane for his kindly supporting the training of first author in geometric morphometrics. The following technicians contributed to this work: B. Coulibaly, F. Dofini, N’Dri Louis, K. Lohourignon and A. De marie Koffi. This study benefitted from the support of the LTTRN network, the EU INCO-DEV project N°031849 and the “Laboratoire mixte International sur les Maladies `a Vecteurs” (LAMIVECT, Bobo-Dioulasso, Burkina Faso).
Author details
1Institut Pierre Richet / Institut National de Sant´e Publique, BP V 47 Abidjan, C ˆote d’Ivoire.2IRD UMR 177, Laboratoire de Recherche et de Coordination sur les Trypanosomoses IRD-CIRAD, Campus International de Baillarguet, 34398 Montpellier cedex 5, France.3Laboratoire de Zoologie, Universit´e
d’Abidjan-Cocody, 22 BP 582, Abidjan 22, C ˆote d’Ivoire.4IRD/CIRDES, UMR 177 IRD/CIRAD INTERTRYP, BP 454, 01 Bobo-Dioulasso, Burkina Faso.5LSHTM (ITD), London WC1E7HT, UK.6IRD, UMR 5090 MIVEGEC, Avenue Agropolis, IRD, Montpellier, France.
Received: 7 March 2012 Accepted: 4 July 2012 Published: 30 July 2012
References
1. Louis FJ: Les raisons techniques de la r ´e ´emergence de la maladie du
sommeil. M´edecine Tropicale 2001, 61:425–431.
2. Schofield CJ, Kabayo JP: Trypanosomiasis vector control in Africa and
Latin America. Parasit Vectors 2008, 1:24 doi:10.1186/1756-3305-1-24.
3. Simarro PP, Jannin J, Cattand P: Eliminating Human African
Trypanosomiasis. Where do we stand and what comes next? PLOS Med 2008, 5:174–180. e55.
4. Simarro PP, Cecchi G, Paone M, Franco JR, Diarra A, Ruiz JA, F`evre EM, Courtin F, Mattioli RC, Jannin JG: The Atlas of human African
trypanosomiasis: a contribution to global mapping of neglected tropical diseases. Int J Health Geographics 2010, 9(57):pp18.
5. Rogers DJ: Tsetse population dynamics and distribution: a new
analytical approach. J Anim Ecol 1979, 48:825–849.
6. Laveissi`ere C, Penchenier L: Manuel de lutte contre la maladie du
sommeil. IRD Editions, Collection Didactiques 2005, 4:pp273.
7. Solano P, Ravel S, De Mee ˆus T: How can tsetse population genetics
contribute to African trypanosomiasis control? Trends Parasitol 2010, 26(5):255–263.
8. Challier A, Eyraud M, Lafaye A, Laveissi`ere C: Am ´elioration du
rendement du pi `ege biconique pour glossines (Diptera: Glossinidae) par l’emploi d’un c ˆone inf ´erieur bleu. Cah ORSTOM s´er Ent M´ed Parasitol 1977, 15:283–286.
9. Vreysen MJB, Saleh KM, Ali MY, Abdulla AM, Zhu ZR, Juma KG, Dyck VA, Msangi AR, Mkonyi PA, Feldmann FU: Glossina austeni (Diptera:
Glossinidae) eradicated on the island of Unguja, Zanzibar, using the Sterile Insect Technique. J Econ Entomol 2000, 93:123–135.
10. Cuisance D, Itard J, Solano P, Desquesnes M, Fr´ezil JL, Authi´e E:
Trypanosomoses. M ´ethodes de lutte. In Editions M´edicales
Internationales Tec et Doc. Principales maladies infectieuses et parasitaires du b´etail. Europe et R´egions chaudes, volume 1. Paris: Lavoisier; 2003:139–165.
11. Kgori PM, Modo S, Torr SJ: The use of aerial spraying to eliminate
tsetse from the Okavango Delta of Botswana. Acta Trop 2006, 99:
184–199.
12. Bouyer J, Solano P, Cuisance D, Itard J, Fr´ezil JL, Authi´e E: Control methods
in Trypanosomosis. In Infectious and Parasitic Diseases of Livestock. Edited
by Lef`evre P, BRUG C, Chermette J: Lavoisier Tec & Doc; 2010:Chap. 127. 13. Torr SJ, Solano P: Olfaction in Glossina-host interactions: a tale of two
tsetse. In Olfaction in vector hosts interactions: Ecology and control of vector borne diseases, Volume 2. Edited by Takken BKW. Wageningen University,
Netherlands, pp437; 2010:265–289.
14. Patterson JS, Schofield CJ: Preliminary study of wing morphometry in
relation to tsetse population genetics. S Afr J Sci 2005, 101:132–134.
15. Camara M, Caro-Ria ˜no H, Ravel S, Dujardin JP, Hervouet JP, de Meeus T, Kagbadouno MS, Bouyer J, Solano P: Genetic and morphometric
evidence for isolation of a tsetse (Diptera: Glossinidae) population (Loos islands, Guinea). J Med Entomol 2006, 43(5):853–860.
16. Kagbadouno M, Camara M, Bouyer J, Hervouet JP, Morifaso O, Kaba D, Jamonneau V, Solano P: Tsetse elimination: its interest and feasibility
in the historical sleeping sickness focus of Loos islands, Guinea. Parasite 2009, 16:29–36.
17. Solano P, Kaba D, Ravel S, Dyer N, Sall B, Vreysen MJB, Seck MT, Darbyshir H, Gardes L, Donnely MJ, De Mee ˆus T, Bouyer J: Population genetics as a
tool to select tsetse control strategies : suppression or eradication of Glossina palpalis gambiensis in the Niayes of Senegal. PLoS NTD
2010, 4(5):p.e692.
18. Kaba D, Dje NN, Courtin F, Oke E, Koffi M, Garcia A, Jamonneau V, Solano P: L’impact de la guerre sur l’ ´evolution de la THA dans le
centre-ouest de la C ˆote d’Ivoire. Trop Med Int Health 2006, 11:136–143.
19. Allou K, Acapovi-Yao G, Kaba D, Bosson-Vanga H, Solano P, N’goran KE:
Chorologie et infection par les trypanosomes de Glossina palpalis palpalis dans la for ˆet du Banco et ses reliques, Abidjan (C ˆote d’Ivoire). Parasite 2009, 16:289–295.
20. Keck N, Herder S, Kaba D, Solano P, Gomez J, Cuny G, Davoust B:
Epidemiology of canine trypanosomosis by cross-sectional study in a urban focus of C ˆote d’Ivoire. Parasite 2009, 16:305–308.
21. Ravel S, T DM, P DJ, Z´ez´e DG, Gooding RH, San´e B, Dusfour I, G C, Solano P:
Different genetic groups occur within Glossina palpalis palpalis in the sleeping sickness focus of Bonon, C ˆote d’Ivoire. Infection, Genet Evol 2007, 7:116–125.
22. Solano P, Ravel S, de Mee ˆus T: How can tsetse population genetics
contribute to African Trypanosomosis control? Trends Parasitol 2010, 26:255–263 doi:10.1016/j.pt.2010.02.006.
23. Glasgow JP: Selection for size in tsetse flies. J Anim Ecol 1961, 30:87–94. 24. Dejardin J, Maillot L: Biom ´etrie de la Glossine. Etude statistique des
mensurations de l’aile dans diverses communaut ´es (Glossina fuscipes quanzensis, Pires). Revue Elev M´ed. v´et Pays Trop 1947, 17:97–102.
25. San´e B, Solano P, Garcia A, Fournet F, Laveissi`ere C: Variation
intrasp ´ecifique de la taille des ailes et du thoraxe chez Glossina palpalis palpalis en zone foresti `ere de C ˆote d’Ivoire. Rev Elev V´et Pays Trop 2000, 53(3):245–248.
26. Rogers DJ, Randolph SE: Mortality rate and population density of
tsetse flies correlated with satellite imageryMortality rate and population density of tsetse flies correlated with satellite imagery. Nature 1991, 351:739–741.
27. Falconer DS: Introduction to quantitative genetics. Longman, London,
UK 1981, 2:pp340.
28. Dujardin JP, Le Pont F: Geographic variation of metric properties
29. Dujardin JP: Morphometrics applied to Medical Entomology. Infection,
Gen Evol 2008, 8:875–890.
30. Dujardin JP: Modern morphometrics of medically important insects. In Genetics and Evolution of Infectious diseases. Edited by Tibayrenc M: Elsevier; 2011:pp749. ISBN: 978-0-12-384890-1, Chapter 16, 473-501. 31. Solano P, De La Rocque S, Cuisance D, Geoffroy B, T DM, Cuny G, Duvallet
G: Intraspecific variability in natural populations of Glossina palpalis
gambiensis from West Africa, revealed by genetics and morphometrics analyses. Med Vet Entomol 1999, 13:401–407.
32. Bouyer J, Ravel S, Dujardin JP, de Meeus T, Vial L, Thevenon S, Guerrini L, Sidibe I, Solano P: Population structuring of Glossina palpalis
gambiensis (Diptera: Glossinidae) according to landscape
fragmentation in the Mouhoun river, Burkina Faso. J Med Entomology
2007, 44(5):788–795.
33. Manly BFJ: Multivariate Statistical Methods: A Primer. London: Chapman & Hall; 1986. pp159. ISBN 0-412-28620-3.
34. Solano P, Ravel S, Bouyer J, Camara M, Kagbadouno MS, Dyer N, Gardes L, Herault D, Donnelly MJ, De Mee ˆus T: Population structures of insular
and continental Glossina palpalis gambiensis in littoral Guinea. PLoS NTD 2009, 3(3):e392 doi:10.1371/journal.pntd.0000392.
35. Kagbadouno M, Camara M, Bouyer J, Courtin F, F OM, J SC, Solano P:
Progress towards the eradication of tsetse from the Loos islands, Guinea. Parasit Vectors 2011, 4(1):18.
36. Vreysen MJB, Robinson AS, Hendrichs J: Area-wide Control of Insect Pests:
From Research to Field Implementation. Edited by IAEA. Dordrecht, The
Netherlands: Springer; 2007.
37. Anonyme: D ´epartements et districts de C ˆote d’Ivoire. CECP, Groupe
Inter-Commun 2005:pp420.
38. Laveissi`ere C, Gr´ebaut P: Recherches sur les pi `eges `a glossines
(Diptera: Glossinidae). Mise au point d’un mod `ele ´economique : le pi `ege “Vavoua”. Trop Med Parasitol 1990, 41:185–192.
39. Luna C, Bonizzoni M, Cheng Q, Robinson AS, Aksoy L, Sand Zheng:
Microsatellite polymorphism in tsetse flies. J Med Entomol 2001, 38:376–381.
40. Baker MD, Krafsur ES: Identification and properties of microsatellite
markers in tsetse flies Glossina morsitans sensu lato (Diptera: Glossinidae). Mol Ecol Notes 2001, 1:234–236.
41. Wright S: The interpretation of population structure by F-statistics
with special regard to system of mating. Evolution 1965, 19:395–420.
42. Weir CC, B S, Cockerham: Estimating F-statistics for the analysis of
population structure. Evolution 1984, 38:1358–1370.
43. Dujardin JP, Kaba D, Henry AB: The exchangeability of shape. BMC Res
Notes 2010, 3:266 doi:10.1186/1756-0500-3-266.
44. Rohlf FJ: Rotational fit (Procrustes) methods. In Proceedings of the,
Michigan Morphometrics Workshop. Special Publiation Number 2. The University of Michigan Museum of Zoology. Ann Arbor, MI, pp380. Edited by
Rohlf F, Bookstein F. University of Michigan Museums, Ann Arbor; 1990:227–236.
45. Rohlf FJ: Morphometric spaces, shape components and the effects of
linear transformations. In Advances in Morphometrics. Proceedings of the 1993 NATO-ASI on Morphometrics. Edited by Marcus LF, Corti M, Loy A,
Naylor G, Slice D. New York: Plenum, Publ. NATO ASI, ser. A, Life Sciences; 1996:117–129.
46. Bookstein FL: Morphometric Tools For Landmark Data. Geometry and
Biology. NY: Cambridge University Press; 1991.
47. Caro-Ria ˜no H, Jaramillo N, Dujardin JP: Growth changes in Rhodnius
pallescens under simulated domestic and sylvatic conditions. Infection, Gen Evol 2009, 9(2):162–168.
48. Baylac M, Frieß M: Fourier descriptors, Procrustes superimposition,
and data dimensionality: An exemple of cranial shape analysis in modern human populations. Chicago: Kluwer; 2005:145–165. Chap. 6.
49. Mahalanobis PC: On the generalized distance in statistics. Proc Natl
Inst Sci India 1936, 2:49–55.
50. Good P: Permutation Tests: A Practical Guide to Resampling Methods For
Testing Hypotheses. New York: Springer; 2000.
51. Felsenstein J: PHYLIP (Phylogeny Inference Package). http://evolution. genetics.washington.edu/phylip.html 1993.
52. Perri`ere G, Gouy M: WWW-Query: An on-line retrieval system for
biological sequence banks. Biochimie 1996, 78:364–369.
53. Belkhir K, Borsa P, Chikhi L, Raufaste N, Bonhomme F: GENETIX 4.05,
logiciel sous Windows TM pour la g ´en ´etique des populations.
Montpellier (France): Laboratoire G´enome, Populations, Interactions, CNRS UMR 5171, Universit´e de Montpellier II 2004.
54. Goudet J: FSTAT (Version 1.2): A computer program to calculate
F-statistics. J Hered 1995, 86:485–486.
55. Goudet J, Raymond M, De Mee ˆus T, Rousset F: Testing differentiation in
diploid populations. Genetics 1996, 144:1933–1940.
doi:10.1186/1756-3305-5-153
Cite this article as: Kaba et al.: Phenetic and genetic structure of tsetse fly
populations (Glossina palpalis palpalis) in southern Ivory Coast. Parasites &
Vectors 2012 5:153.
Submit your next manuscript to BioMed Central and take full advantage of:
• Convenient online submission
• Thorough peer review
• No space constraints or color figure charges
• Immediate publication on acceptance
• Inclusion in PubMed, CAS, Scopus and Google Scholar
• Research which is freely available for redistribution
Submit your manuscript at www.biomedcentral.com/submit