HAL Id: hal-02394028
https://hal.umontpellier.fr/hal-02394028
Submitted on 4 Dec 2019
HAL is a multi-disciplinary open access
archive for the deposit and dissemination of
sci-entific research documents, whether they are
pub-lished or not. The documents may come from
teaching and research institutions in France or
abroad, or from public or private research centers.
L’archive ouverte pluridisciplinaire HAL, est
destinée au dépôt et à la diffusion de documents
scientifiques de niveau recherche, publiés ou non,
émanant des établissements d’enseignement et de
recherche français ou étrangers, des laboratoires
publics ou privés.
Distributed under a Creative Commons Attribution| 4.0 International License
H. Williams, E. Shepard, Olivier Duriez, S. Lambertucci
To cite this version:
H. Williams, E. Shepard, Olivier Duriez, S. Lambertucci. Can accelerometry be used to
distin-guish between flight types in soaring birds?. Animal Biotelemetry, BioMed Central, 2015, 3, pp.45.
�10.1186/s40317-015-0077-0�. �hal-02394028�
RESEARCH
Can accelerometry be used
to distinguish between flight types in soaring
birds?
H. J. Williams
1*, E. L. C. Shepard
1, O. Duriez
2and S. A. Lambertucci
3Abstract
Background: Accelerometry has been used to identify behaviours through the quantification of body posture and
motion for a range of species moving in different media. This technique has not been applied to flight behaviours to the same degree, having only been used to distinguish flapping from soaring flight, even though identifying the type of soaring flight could provide important insights into the factors underlying movement paths in soaring birds. This may be due to the complexities of interpreting acceleration data, as movement in the aerial environment may be influenced by phenomena such as centripetal acceleration (pulling-g). This study used high-resolution movement data on the flight of free-living Andean condors (Vultur gryphus) and a captive Eurasian griffon vulture (Gyps fulvus) to examine the influence of gravitational, dynamic and centripetal acceleration in different flight types. Flight behaviour was categorised as thermal soaring, slope soaring, gliding and flapping, using changes in altitude and heading from magnetometry data. We examined the ability of the k-nearest neighbour (KNN) algorithm to distinguish between these behaviours using acceleration data alone.
Results: Values of the vectorial static body acceleration (VeSBA) suggest that these birds experience relatively little
centripetal acceleration in flight, though this varies between flight types. Centripetal acceleration appears to be of most influence during thermal soaring; consequently, it is not possible to derive bank angle from smoothed values of lateral acceleration. In contrast, the smoothed acceleration values in the dorso-ventral axis provide insight into body pitch, which varied linearly with airspeed. Classification of passive flight types via KNN was limited, with low accuracy and precision for soaring and gliding.
Conclusion: The importance of soaring was evident in the high proportion of time each bird spent in this flight
mode (52.17–84.00 %). Accelerometry alone was limited in its ability to distinguish between passive flight types, though smoothed values in the dorso-ventral axis did vary with airspeed. Other sensors, in particular the magnetom-eter, provided powerful methods of identifying flight behaviour and these data may be better suited for automated behavioural identification. This should provide further insight into the type and strength of updraughts available to soaring birds.
Keywords: Soaring flight, Acceleration, Magnetometry, Pulling-g, Centripetal acceleration, Daily Diary, KNN
© 2015 Williams et al. This article is distributed under the terms of the Creative Commons Attribution 4.0 International License (http://creativecommons.org/licenses/by/4.0/), which permits unrestricted use, distribution, and reproduction in any medium, provided you give appropriate credit to the original author(s) and the source, provide a link to the Creative Commons license, and indicate if changes were made. The Creative Commons Public Domain Dedication waiver (http://creativecommons.org/ publicdomain/zero/1.0/) applies to the data made available in this article, unless otherwise stated.
Background
Accelerometers have been proven to be a powerful tool
in the study of animal movement and behaviour [1], and
their use has proliferated in both terrestrial and aquatic
environments (e.g. [2–6]). Researchers have used accel-erometers to identify behaviour (e.g. [3, 7, 8]) and esti-mate activity levels (and their associated energetic costs)
[9–11] by quantifying patterns of body posture and
motion. This has provided insight into a range of eco-logical issues, from foraging success in Antarctic fur seals (Arctocephalus gazella) [12] to levels of infection in diseased cockroaches (Blaberus craniifer) [13]. In the
Open Access
*Correspondence: [email protected]
1 Department of Bioscience, College of Science, Swansea University,
Swansea SA2 8PP, UK
aerial environment, however, investigation of behaviour in flight has been mostly limited to the identification of a single behaviour; flapping flight. Flapping flight is readily classifiable as each upstroke and downstroke are associ-ated with peaks in dynamic acceleration [14, 15], and the absence of these peaks has been used to identify passive flight [16].
Nonetheless, passive flight is the dominant flight type for many soaring birds, which rely on updraughts to maintain or gain height to move [14, 17]. The updraughts exploited by soaring birds can broadly be categorised as thermal updraughts and slope soaring using orographic lift (see below), with the former being driven by uneven heating of the substrate, and the latter by wind being deflected upwards by sloping terrain [18, 19]. The dis-tribution and strength of these updraughts vary in space
and time [20], which is likely to have profound
conse-quences for the flight paths selected by these animals as well as their time and energy budgets [21]. Therefore, the ability to further classify soaring flight types according to the source of lift, as well as periods of gliding between them, would contribute greatly to our understanding of the factors driving space use for these birds [22].
GPS data have been used to identify the type of updraughts used by soaring birds along their flight path
(e.g. [18]), namely through the calculation of ground
speed, and/or the identification of circling behaviour indicative of thermal soaring or by sequential locations lying along a windward slope [22] (indicative of the use of orographic lift). However, high frequency data can be difficult to acquire for many species due to the power requirements of GPS sensors and associated battery weights. GPS locations are more commonly recorded at a frequency of several fixes per hour. At this frequency, insight into the updraughts exploited by soaring birds can only be gained where locations are combined with high-resolution meteorological data, including the local wind field for the estimation of slope lift (e.g. [19, 21, 23], cf. [21]), and acceleration data [24] (which enable research-ers to distinguish between powered climbs and use of updraughts). Given the number of workers currently using accelerometers, their reduced cost and extended recording duration for a given sampling frequency (e.g. [25] albatross, bi-axial accelerometer, 16–32 Hz, 23–68 h, [14] raptors, tri-axial accelerometer, 100 Hz, 3–19 min per run), it would be valuable if the resulting data could be used to investigate the type of updraught that birds exploit when soaring.
There are several reasons why soaring and gliding flight types may be distinguishable using acceleration data. We predict that the dynamic motion measured by an animal-attached accelerometer may increase with
turbulence experienced by the bird [26] according to
the characteristics of the air mass the animal is moving through [27], cf. [28] as well as the bird’s airspeed. Birds modulate their airspeed in relation to the availability of rising air, reducing their airspeed in updraughts and increasing their airspeed as they glide between them [29]. This may also be associated with postural changes if, in an analogous manner to gliders, airspeed is affected by changes in the forward pitch as well as modulating wing area by altering the shape of the wings [30, 31].
Changes in forward pitch angle as well as body roll can be calculated from the gravitational (the smoothed) com-ponent of acceleration for animals that are largely station-ary or undertaking linear locomotion [9, 27]. However, this relatively simplistic interpretation of acceleration data may not be appropriate for flying animals. Pilots, for instance, use a combination of sensors, including magnetometers and gyroscopes to quantify their orienta-tion during flight rather than relying on accelerometers alone (e.g. [32]). This is because the gravitational compo-nent of acceleration, as estimated by smoothing the raw data, may be affected by directional changes in velocity. Birds typically experience high centripetal accelerations when pulling out of stoops (also called pulling-g), with the highest value ever recorded being nine times greater than gravitational acceleration, as measured in the stoop-ing aerial displays of Anna’s hummstoop-ingbirds, Calypte anna [33]. Birds and pilots can also enter free-fall, where each axis, and therefore the sum, of acceleration axes would equal 0 g, irrespective of the orientation of the bird or accelerometer during this phase.
The aim of this study was to characterise how accelera-tion data vary between active (flapping) and passive flight types (thermal soaring, slope soaring, and gliding). First, we define flight types by patterns in acceleration, mag-netometry and altitude change and second, assess the power of an automated classification method (k-nearest neighbour algorithm) to identify these behaviours using acceleration data alone. Finally, we assess the patterns in dynamic, gravitational and centripetal acceleration that contribute to the recorded signal for the different flight types. We also report on preliminary results from a dif-ferential pressure sensor system to quantify variation in airspeed with body posture according to flight type.
We attached Daily Diary (DD) devices to two species of soaring bird, the Andean condor (Vultur gryphus) and the Eurasian griffon vulture (Gyps fulvus). These devices incorporate tri-axial accelerometers and magnetometers,
and a barometric pressure sensors [27], which together
provide high-resolution data on animal movement and behaviour. Both species are obligate soaring birds although they differ in body mass, with the Andean con-dor being the heaviest terrestrial soaring bird (ranging from some 9–16 kg; wingspan ca. 3 m [34, 35]) and the
Eurasian griffon being substantially smaller (6.2–11.3 kg; wingspan ca. 2.5 m for captive birds [36]).
Methods
Data collection
DD units [27] incorporate a number of sensors including a tri-axial accelerometer, tri-axial magnetometer and bar-ometric pressure sensor. Acceleration (1 g = 9.81 m s2)
values were recorded in three axes, corresponding to the anterior–posterior (surge), dorso-ventral (heave) and lat-eral (sway) axes (Fig. 1). Dynamic and postural data could be derived from acceleration values in the three axes [8], and heading from the geomagnetic field strength (meas-ured in gauss). Data from the barometric pressure sensor (Pa, 0.01 hPa resolution) reflected changes in altitude on the ground and in flight; where a decrease in pressure indicated a height gain.
Altitude was calculated from barometric pressure, smoothed over 10 s with adjacent averaging, using the following equation:
where P is the smoothed pressure and Po is a daily
constant pressure at sea level taken from the nearest weather station: at Bariloche airport (ca. 8 km from the release site) for the Andean condors, and Lunegarde weather station (20 km from Rocamadour) in the case of the griffon vulture. The altitude change was calculated as the difference between the current altitude and that a second later.
Five adult Andean condors were fitted with DD near Bariloche, Argentina, and each unit recorded at 40 (n = 3)
Altitude(m) = 44, 330 ×
1 − P
Po
5.2551
or 20 Hz (n = 2). DDs were attached to the lower back of the Andean condors by taping a bio-degradable base plate to the feathers with Tesa Tape. The unit housing the DD was then slotted onto the plate and held in place with fishing line. Stability of the devices was ensured by attach-ing the plate to numerous rows of back feathers to restrict movement of the plate relative to the animal’s own move-ment. Moreover, the 3D printing method of constructing the housing ensured that components slotted together with minimal space for free movement. DD Units were programmed to release from the plate and drop from the bird in the night (to ensure they dropped during roosting) after 7–9 days, after which time they were recovered from the roosting sites (see [17] for full details). Units weighed between 70 and 90 g, representing less than 1 % of mean adult body mass; therefore falling below the recom-mended 3 % body mass. Procedures for tagging free-living animals were approved by the Swansea University Ethics Committee.
A captive Eurasian griffon vulture was fitted with a DD unit during three flights at the raptor centre at Rocher des Aigles, Rocamadour, France. This site offers very good thermal soaring conditions for free-flying raptors, being located on top of a 120-m-deep canyon
(see [14] for details). In addition to the usual
param-eters, this Daily Diary also measured airspeed, using a differential pressure sensor to quantify the difference between the static and dynamic pressure, with the lat-ter being recorded through a forward-facing tube (Pitot tube, which was made of brass and had a bore diameter of 3 mm) (Fig. 1) [26]. The unit of airflow measured in volts (V) directly from the differential pressure sensor is given as relative airspeed. Prior to deployment on the vulture, this system was tested in a wind tunnel, which confirmed that the sensor output correlated well with airspeed (ES, unpublished data). To accurately measure airflow, the Pitot tube should be in line with the direc-tion of airflow over the back of the bird (Fig. 1). This is achieved in ballistic flight (soaring and gliding), but during steep descents prior to landing, the tube may not be in line with the airflow and hence these periods were removed for analysis regarding the vulture. The DD was set to record at 20 Hz. The device was fitted to the back of the bird with a leg loop harness of Teflon ribbon, and removed after a single day [14, 37 ]. Attach-ment of loggers to captive vultures was conducted under a formal aggreement between the animal rearing facility at Rocher des Aigles and the CNRS with the permit of O. Duriez for the attachment of logging devices (under a licence from the Research Centre for Bird Studies, Natural History Museum, Paris). Care was taken in har-ness design to minimise discomfort and loggers were removed promptly after flights.
Fig. 1 Photograph of tag set up on Eurasian griffon vulture. Daily
Diary (DD) with on-board Pitot tube differential pressure sensor attached with leg loop harness. Direction of airflow relative to the Pitot tube and the three axes of the accelerometer are illustrated
Identification of flight types
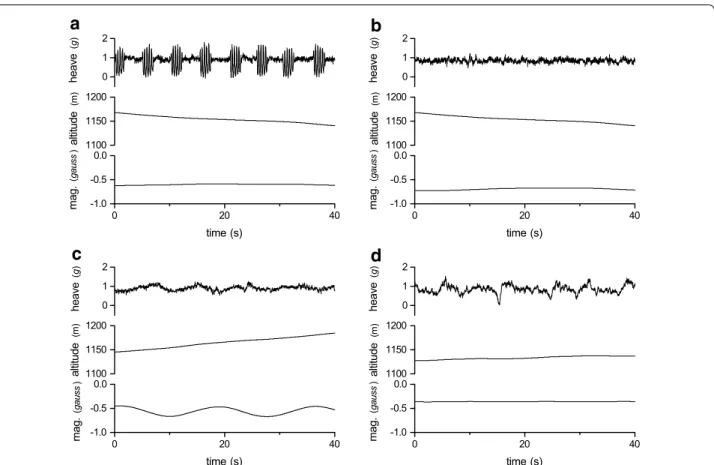
Four distinct flight types were identified from the raw acceleration, magnetometry and barometric pres-sure data: flapping, thermal soaring, slope soaring and gliding flight (Fig. 2; Table 1). Flapping flight was defined by regular peaks in the heave and surge axes, where each peak represents a wing beat in a pattern of repeated flapping behaviour [15] (Fig. 2a). The absence of wing beats has previously been used to define pas-sive flight, however, additional information provided by the magnetometer and pressure sensors allowed further classification of distinct flight types. Gliding
was characterized by an increase in pressure, i.e. a decrease in altitude, and soaring as periods where
ani-mals maintained or increased their altitude (Fig. 2b).
The magnetometry data enabled the source of lift to
be identified as a thermal updraughts (Fig. 2c) or
oro-graphic lift (Fig. 2d), where circling in the
magnetom-etry data defined thermal soaring. It was assumed that soaring without circling behaviour represented slope soaring (though see [38]).
Following these definitions, the data were classified by visual inspection of time series plots in the custom made software DDMT. Data were only labelled as one of the
0 1 2 1100 1150 1200 0 4 0 2 0 -1.0 -0.5 0.0 0 1 2 1100 1150 1200 0 4 0 2 0 -1.0 -0.5 0.0 0 1 2 1100 1150 1200 0 4 0 2 0 -1.0 -0.5 0.0 0 1 2 1100 1150 1200 0 4 0 2 0 -1.0 -0.5 0.0 heav e (g ) altitude (m ) mag. (gau ss ) time (s) heav e (g )
c
d
altitude (m ) m ag. (gaus s ) time (s) heav e (g ) altitude (m ) mag. (g aus s ) time (s) heav e (g ) altitude (m )a
b
mag. (g aus s ) time (s)Fig. 2 Flight type defined by patterns in raw heave (g), altitude (m) derived from barometric pressure, and a single magnetometry channel (gauss)
associated with a flapping flight, b gliding flight, c thermal soaring and d slope soaring
Table 1 Definitions of flight types identified visually from time series plots
Flight type Definition
Flapping flight A series of flapping bouts (>3) in constant flapping flight seen mainly in the heave channel Thermal soaring Increasing altitude; no flapping; circling behaviour seen in x–y magnetometry channels
Slope soaring Increasing or maintaining altitude; no flapping; no clear circling pattern in x–y magnetometry channels; rather irregular changes in direction
Gliding Decreasing altitude; no flapping; often associated with relatively little change in direction in mag-netometry channels
four flight types where the behaviour was observed for at least 30 s, or in the case of flapping flight, by at least three bouts of flapping (e.g. Fig. 2a includes eight flapping bouts). The raw data were cut by flight type and merged into single data files per flight type for each of the five Andean condors and the griffon vulture.
Patterns in dynamic and smoothed acceleration by flight type were examined using the data of the free-rang-ing Andean condors, as well as the use of the k-nearest neighbour classification method. The flight of the griffon vulture was short in duration, and although its airspace was not restricted, its flight was localised around the rap-tor centre. We therefore did not consider the data of the griffon vulture alongside that of the Andean condors, but instead used the griffon vulture data to quantify the rela-tionship between body pitch and airspeed.
Classification by acceleration
Machine-learning algorithms [16, 39, 40], clustering tech-niques [41] and normalised correlation [42] have been used to identify behaviour from acceleration data in a range of species. Here, we used the k-nearest neighbour (KNN) cluster analysis to investigate the ability of such automated classification methods to distinguish between the four flight types with raw acceleration data alone. This classifica-tion method was chosen due to the previous success of the k-means clustering method distinguishing between flap-ping and non-flapflap-ping flight [16], which has been found to be of equal success to other more complex methods in the study of soaring birds [40]. The KNN algorithm classifies raw acceleration data according to the identity of its k-near-est neighbours in three-dimensional space, where the nearest neighbours are from a separate training data set of known classification (cf. [41]). Having identified four flight types using data from all sensors we were in the position to train the clustering algorithm of the KNN rather than use a k-means cluster analysis method that blindly searches for a predetermined number of clusters (cf. [43, 44]).
KNN was applied to each of the five Andean condors separately, where training sets consisted of 12,000 data points (5 min for datasets of 40 Hz and 10 min for 20 Hz). Test sets of the same length were taken from the flight type specific data files for each individual (from the cen-tre data point of the file). The analysis was performed as described in Bidder et al. [41], using a value of 21 for k (the number of the nearest neighbours in the algorithm) and their reported mean minimum majority thresh-olds (proportion of k-nearest points of the same classi-fication to be deemed a positive classiclassi-fication) of 0.7 for accuracy, 0.9 for precision and 0.5 for recall. Classifica-tions that surpassed the given thresholds were defined as positives, where if correct according to the test set as true positives (TP) or where incorrect as false positives (FP).
Classifications that fell below the threshold were negative and again either true negatives (TN) or false negatives (FN) according to whether they were classified incorrectly or correctly, respectively. Classification was evaluated by calculating the performance metrics of (1) Accuracy, the proportion of data points correctly assigned [Accu-racy = (TN + TP)/(TN + TP + FN + FP)], (2) Precision, the proportion of positive results that were correctly assigned [Precision = TP/(TP + FN)] and (3) Recall, the proportion of data assigned to behaviours that were clas-sified as positive correctly [Recall = TP/(TP + FN)].
Patterns in body posture and motion
To investigate patterns of body posture, raw accelera-tion values were smoothed with adjacent averaging over 3 s to estimate the gravitational acceleration in the three axes [27, 45, 46]. To control for individual differences in device alignment, smoothed acceleration data in each of the three axes were centred on the individual’s in-flight mean. Smoothed acceleration values therefore ranged from −1 to 1, where negative values indicate increas-ingly upward pointing pitch from the individual mean and positive values an increasingly downward point-ing pitch from the individual mean. Patterns of body motion were examined by calculating the dynamic acceleration component, defined as the acceleration due to changes in speed. This was calculated by subtracting the smoothed signal from the raw acceleration values in each axis.
From the dynamic and smoothed acceleration we cal-culated the vectorial dynamic body acceleration (VeDBA) (Eq. 1) and the vectorial static body acceleration (VeSBA) (Eq. 2) using the given equations:
where DBA and SBA are the dynamic and smoothed body acceleration, respectively, from the three accelera-tion axes (x, y and z). VeDBA is a vectorial measure of the total dynamic movement of the animal and has been
used as a proxy for energy expenditure [47]. Any
move-ment due to changes in speed by the animal or as a result of turbulence that the animal experiences from the envi-ronment will manifest itself in the VeDBA. We predict, therefore, that VeDBA values will be greater during glid-ing flight compared to soarglid-ing, in relation to airspeed.
VeSBA, as the sum of the gravitational acceleration, should equal 1 g for any animal that is a stationary state or constant state of motion, i.e. linear. The deviation of VeSBA from 1 g (VeSBA—1) is therefore a measure of the
(1)
VeDBA =
((DBAx)2+ DBAy 2+(DBAz)2)
(2)
VeSBA =
(SBAx)2+ SBAy 2+(SBAz)2
centripetal acceleration (and an indication that the ani-mal is pulling-g) [48].
Statistical analyses
We examined the frequency distributions of VeDBA and VeSBA for the Andean condor by flight type and describe the VeSBA deviance of the different flight types from 1 g. The distribution of smoothed sway (centred on individ-ual means, described above) was also assessed with fre-quency distributions by flight type.
We performed a linear mixed model (LMM) to quan-tify the predictive effects of smoothed surge (g) in inter-action with flight type (as defined by the visual inspection of the combined sensors) on altitude change (m/s). Indi-vidual was included as a random factor. A random 0.01 % sample of the Andean condor data (n = 785) was taken to remove autocorrelation. Considering the enormity of data collected at 40 Hz, the resultant relationship between smoothed surge and altitude change was plotted with a kernel density frequency distribution with prob-ability density function at levels 0.9 and 0.5.
The relationship between the rate of altitude change and smoothed surge in the griffon vulture was quanti-fied with a Pearson’s correlation test, again with a ran-domly subsampled data set to remove autocorrelation (0.2 %, n = 111). The data set of the griffon vulture was restricted to ballistic flight (gliding, slope soar-ing and thermal soarsoar-ing); hence, landsoar-ing and flappsoar-ing flight were removed. Using the same subsample of data, we performed a linear model with the response variable of relative airspeed (V) to quantify the effect of smoothed surge and flight type as explanatory variables in interaction.
The significance of terms in the two linear models was calculated with an ANOVA, and the term specific statistic and its associated p value are given. Model fit was assessed with an adjusted R2, or in the case of the
LMM the marginal (variance explained by the fixed
effects alone) and the conditional R2 values (the variance
explained by the fixed and random effects together) [49]. Statistical treatments were performed in R3.1.1 and fig-ures produced in Origin 9.1 (OriginLab).
Results
Individuals and their flights
Condor devices recorded continuously for 176–203 h. The total flying time ranged from 15.15 to 41.52 h and the percentage of flight time classified per bird from 35.50 to 88.61 %. The proportion of time devoted to the four flight types varied between individuals
(Table 2): gliding and soaring were equally common
(mean = 44.80 % ± 3.42 SD and 45.60 % ± 4.04, respec-tively), where thermal soaring contributed to a greater proportion of soaring flight (68.02 % ± 13.23). The total flight duration of the griffon vulture was 51.55 min (Table 2).
Flight type classification by KNN
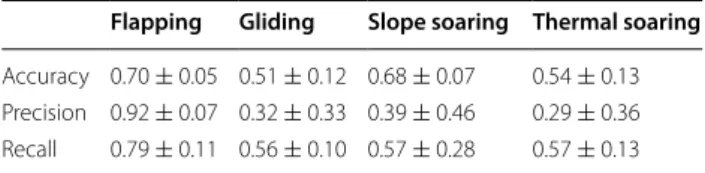
Flapping flight was classified with the greatest accu-racy (mean = 0.70 ± 0.05 SD), precision (0.92 ± 0.07) and recall (0.79 ± 0.11), compared to the passive flight types of gliding, slope soaring and thermal soaring (Table 3). For the latter categories, KNN performed less well, with precision ranging from a mean of 0.29 (±0.36) to 0.39 (±0.46) and accuracy from 0.51 (±0.12) to 0.68 (±0.07), indicating a low number of true and true posi-tive classifications.
Dynamic, centripetal and gravitational acceleration
Flapping flight was associated with a greater level of dynamic movement, indicated by its distribution of higher VeDBA values. The frequency distribution of VeDBA values was positively skewed for all flight types
(Fig. 3a). This skew was less pronounced for flapping
flight (median = 0.16, interquartile range (IQR) = 0.24), which had a greater frequency of high VeDBA values
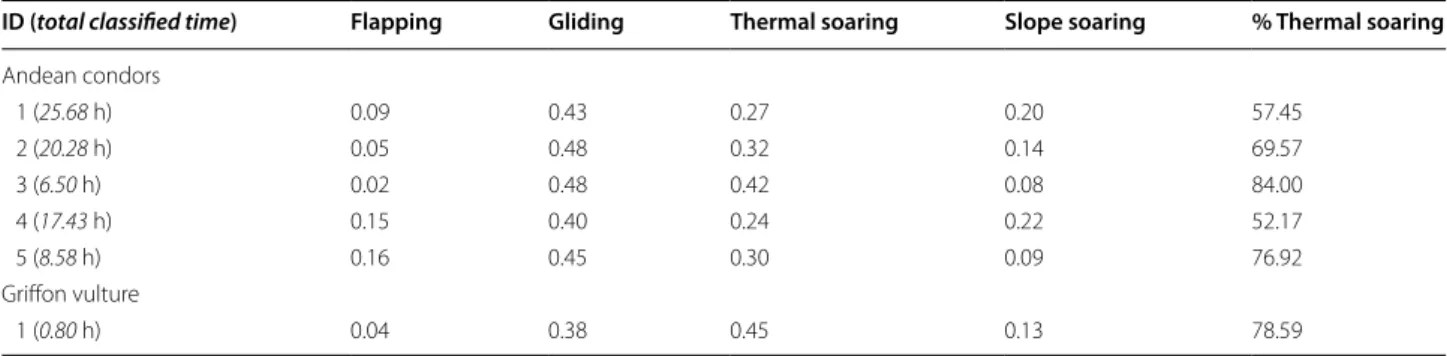
Table 2 Occurrence of the different flight types for the five tagged Andean condors (Vultur gryphus) and the Eurasian griffon vulture (Gyps fulvus) as a proportion of the total classified flight time, and the percentage of soaring whereby ther-mal updraughts are the source of lift rather than orographic slope updraughts
Total number of hours of flight classified by behaviour is given in italic
ID (total classified time) Flapping Gliding Thermal soaring Slope soaring % Thermal soaring
Andean condors 1 (25.68 h) 0.09 0.43 0.27 0.20 57.45 2 (20.28 h) 0.05 0.48 0.32 0.14 69.57 3 (6.50 h) 0.02 0.48 0.42 0.08 84.00 4 (17.43 h) 0.15 0.40 0.24 0.22 52.17 5 (8.58 h) 0.16 0.45 0.30 0.09 76.92 Griffon vulture 1 (0.80 h) 0.04 0.38 0.45 0.13 78.59
compared to other flight types (cf. Fig. 2a). VeDBA val-ues during thermal soaring flight exhibited the most pronounced skew (median = 0.10, IQR = 0.08), and therefore the lowest amount of dynamic movement.
VeSBA values tended to deviate little from 1 g dur-ing flight, though distributions differed between flight types (Fig. 3b). The distribution of VeSBA values in slope soaring peaked at a mean of 1.10 ± 0.11 g SD. Flap-ping and gliding averaged close to 1 g (1.03 ± 0.19 g and 1.03 ± 0.18 g, respectively), though there was slight bimo-dality in the distribution of both. The deviation from 1 g was greatest for thermal soaring with a mean VeSBA of 1.17 ± 0.12 g.
All flight types exhibited a normal distribution in smoothed sway values. The centred sway showed little deviation from 0 g for all but one individual (see Addi-tional file 1: Figure S1), and there was no evidence for bimodality that might have indicated banking in thermal soaring.
Smooth surge and Airspeed
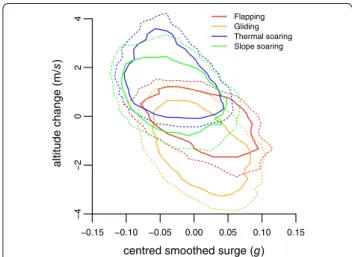
The rate of change in altitude was significantly pre-dicted by an interaction between smoothed surge val-ues and flight type (Fig. 4, χ2 = 13.27, df = 3, p < 0.001, n = 785) in a model with a conditional R2 of 0.45 (see
Additional file 1: Table S2). A significant negative corre-lation between smoothed surge and the rate of altitude change was also evident in the flights of the griffon vul-ture (r = −0.65, t = −8.92, df = 109, p < 0.001). In other words, the usual proxy for body posture varied with flight type and its characteristic pattern of altitude gain or loss.
In the griffon vulture, the interaction between smoothed surge and flight type had no significant effect and was dropped from the model. The model that best
explained the variance in airspeed had an adjusted R2
of 0.37 and included the significant effects of flight type (F = 8.33, df = 2, p < 0.001) and smoothed surge (F = 7.05, df = 1, p = 0.009) separately (see Addi-tional file 1: Table S2). Flight types differed in their relative airspeed where gliding was associated with a greater airspeed (mean = 2288.18 ± 659.21 V SD) than both thermal (1509.35 ± 359.90 V) and slope soaring (1656.35 ± 426.66 V). Smoothed surge predicted rela-tive airspeed (Fig. 5) (Est. = 2111.72) so that generally the smoothed surge associated with height gain and soar-ing flight had lower airspeed values compared to those of gliding flight (Figs. 5, 6).
Discussion
Flight types were clearly identifiable when acceleration, magnetometry and barometric pressure signals were con-sidered together. This combination of sensors allowed for the accurate classification of passive flight types, provid-ing insight into the type of updraught used by the birds (cf. [17]) and the movement strategies that they adopt. Previously, soaring flight type had only been alluded to
with the use of GPS-derived speed (e.g. [22]) and
high-precision GPS locations recording at high frequency (e.g. [14]), or by assessing meteorological data associated with GPS locations (e.g. [18, 21]). Though use of GPS allows for some behaviours to be identified, coupling the use of
Table 3 Average accuracy, precision and recall val-ues (mean ± SD) of KNN where k = 21 and n = 12,000 obtained for each of the five Andean condors (Vultur
gryphus)
Flapping Gliding Slope soaring Thermal soaring
Accuracy 0.70 ± 0.05 0.51 ± 0.12 0.68 ± 0.07 0.54 ± 0.13 Precision 0.92 ± 0.07 0.32 ± 0.33 0.39 ± 0.46 0.29 ± 0.36 Recall 0.79 ± 0.11 0.56 ± 0.10 0.57 ± 0.28 0.57 ± 0.13
Fig. 3 Relative frequency distributions of a the vectorial dynamic body acceleration (VeDBA) and b the vectorial static body acceleration (VeSBA)
accelerometers and magnetometers provides fine-res-olution movement data and for an extended recording duration. As apparent in previous studies on free-living raptors, flapping flight contributes to only a small frac-tion of the flight time budget [14, 16]. Here, we have shown that the majority of flight is passive, and that this is more-or-less equally split between soaring and gliding behaviour. The relative use of thermal and orographic updraughts varied between individual condors, although as only five birds were tagged and at different periods over the summer months, further analysis is required to
disentangle the relative influences of route selection and meteorological conditions. This type of approach is likely to provide insight into the role of thermal and orographic updraughts in the movement ecology of soaring species [22], particularly when information on flight type is com-bined with positional information at fine scales.
Smoothed acceleration in the sway axis did not vary between flight types, even though birds are predicted to adopt a bank angle of around 24 degrees during
ther-mal soaring [50]. Unlike calculation of body roll when
the animal stationary or moving in a linear fashion, the distribution of VeSBA in thermal soaring suggests that a centripetal force in turning may mask the effect of the bank angle on the smoothed sway values. To gain altitude within a thermal the bird must maintain a bal-anced turn about a centre point, slowing its speed to
maximise height gain [29]. This is maintained with the
constant change in the direction of the velocity, creat-ing a centripetal force when circlcreat-ing; the magnitude of
which increases with a decreasing turn radius [29]. As
a consequence, the smoothed acceleration values in the lateral axis cannot be used to derive the bank angle. The phenomenon of pulling-g due to centripetal acceleration is not confined to the aerial environment and has the potential to influence acceleration values recorded on any animal that experiences dramatic changes in veloc-ity. Other examples may include brachiating gibbons or cheetahs cornering as they chase their prey [48].
While birds may experience pulling-g in other axes of acceleration, when pulling out of stoops [33] for instance, or other manoeuvres that may occur during social inter-actions, these occur relatively infrequently, at least for soaring birds. Smoothed surge data should therefore be able to provide insight into body pitch for straight pas-sive flight. Indeed, our results demonstrated that gliding and flapping flight generally showed little deviation from 1 g. A bimodal distribution in flapping flight may suggest some deviation, though this could also reflect the difficul-ties of separating gravitational and dynamic components (cf. [46]) (a potential issue for all flight types).
Our results suggest that changes in speed during glid-ing, largely achieved by reducing the wing area, are accompanied by measurable changes in body pitch. This follows from the strong relationship between smoothed surge and altitude change, a parameter that also tends to differ between flight types. Considering parameters according to altitude change may actually offer a more suitable variable in the analysis of space use (cf. [17]) than the grouping of behaviour into discrete flight types. Fur-thermore, data collected from the individual griffon vul-ture showed that smoothed surge was related to airspeed. The changes in the relative airspeed were consistent with theoretical predictions of changes in flight speed; showing
centred smoothed surge (g)
altitude change (m/ s ) −0.15 −0.10 −0.05 0.00 0.05 0.10 0.15 −4 −2 02 4 Flapping Gliding Thermal soaring Slope soaring
Fig. 4 Kernel density frequency distribution (plotted with
prob-ability density function at levels 0.9 = bold, 0.5 = dashed) of the rate of change of altitude (m/s) by centred smoothed surge (g) matrix for Andean condors −0.2 −0.1 0.0 0.1 0.2 01 000 2000 3000 4000
centred smoothed surge (g)
relativ
e airspeed (V)
Fig. 5 Relationship between relative airspeed (V) and centred
smoothed surge (g) for passive flight types in the Eurasian griffon vulture, using a random 0.2 % sample of the classified flight data,
a reduction in airspeed as the bird moved into updraughts and an increase as birds glided between them [29]. To the best of our knowledge, this represents the first description of airspeed, as quantified using an on-board differential pressure sensor, in relation to the posture of the bird (in terms of smoothed surge) (but see [26]). Overall, the dif-ferential pressure system shows promise and could be fur-ther refined, e.g. by experimentation with the positioning of the device, the height of the tube in relation to the bird’s back and the diameter of the Pitot tube.
We predicted that VeDBA may differ between soaring and gliding, on the basis that these behaviours represent movement through different air masses and at different airspeeds. However, VeDBA values were in fact similar and the increased airspeed seen during gliding did not appear to manifest itself as an increase in experienced turbulence relative to other flight types (cf. [26]). The lack of variance in VeDBA may reflect the range in air masses experienced within one behavioural category and factors such as gustiness, which vary in both space, and time are difficult to quantify. It is unlikely to represent noise from our method of device attachment, as units were stable when they were on-board the birds.
The ability of the KNN algorithm to classify passive flight behaviour from acceleration was limited, though it was able to distinguish flapping from non-flapping flight
accurately. The increased dynamic movement and pos-ture adopted during flapping separates this flight type in tri-axial acceleration space [16]. While we did find evi-dence for variation in the smoothed surge signal between passive flight types, these differences were not sufficient to form discrete clusters for high accuracy classifica-tion. This is in contrast to other studies such as that by Shamoun-Baranes et al. [7], which distinguished between specific behaviours from smoothed tri-axial acceleration values using supervised classification trees. As KNN has been shown to perform similarly to a number of auto-mated classification algorithms, at least for the identifi-cation of active flapping and passive non-flapping flight [40] it would seem that, even at the high frequency of 40 and 20 Hz, passive flight types cannot be distinguished between from their acceleration values alone with such algorithms.
We suggest that the use of magnetometer data may be more powerful than accelerometer data to distinguish between different flight behaviours. Machine-learning approaches and other algorithms are currently being used to automate the identification of behaviour types from acceleration data [7, 16, 43, 44, 51], and the appli-cation of automated classifiappli-cation to magnetometry data is new (cf. [27]). Nonetheless, we believe this approach holds promise for the identification of many behavioural
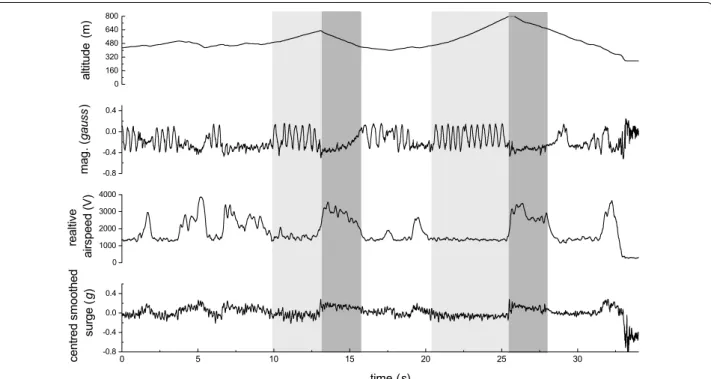
0 160 320 480 640 800 -0.8 -0.4 0.0 0.4 0 1000 2000 3000 4000 0 5 10 15 20 25 30 -0.8 -0.4 0.0 0.4 altitude (m ) ma g. (gaus s) realti ve airs peed (V ) ce ntre ds moothed su rg e( g) time (s)
Fig. 6 Time series plot of altitude (m), a single magnetometry channel (gauss), relative airspeed (V) and centred smoothed surge (g). Airspeed is
relatively low with little variation when circling and gaining height in a thermal updraught (light grey) compared to straight gliding flight (dark grey). Airspeed is greatest upon leaving the thermal and decreases through the inter-thermal glide (dark grey)
patterns. The independence of the magnetometer signal from dynamic movement may be a particular asset when it comes to the investigation of flight behaviour.
Conclusions
For soaring birds, the classification of their dominant flight types relies on the consideration of multiple sen-sors. The combination of magnetometry, barometric pressure, airspeed and accelerometry, provided a detailed insight into animal movement for the accurate iden-tification and quaniden-tification of behaviour, from which the space use of soaring birds and their reliance on updraughts can be investigated. We highlight some of the circumstances under which it is not possible to use the smoothed acceleration signal to derive precise esti-mates of body orientation (here during thermal soaring) though we do find evidence that the smoothed surge values should vary with body pitch affecting airspeed in flight. The effects of centripetal acceleration should be considered in the interpretation of the dynamic and grav-itational acceleration, especially concerning animals that experience changes in velocity during certain behaviours.
Abbreviations
ACC: acceleration; DD: Daily Diary; FN: false negative; FP: false positive; GPS: global positioning system; KNN: k-nearest neighbour; Mag.: a single mag-netometry channel (in the case of figures this refers to the lateral x-axis); TN: true negative; TP: true positive; VeDBA: vectorial dynamic body acceleration; VeSBA: vectorial static body acceleration.
Authors’ contributions
This study was conceived by HJW and ELCS. HJW carried out data analyses and wrote the manuscript with input from ELCS. OD and ELCS tagged the Eurasian griffon vultures. SAL and ELCS collected the Andean condor data. All authors commented on final manuscript. All authors read and approved the final manuscript.
Author details
1 Department of Bioscience, College of Science, Swansea University,
Swan-sea SA2 8PP, UK. 2 CEFE UMR 5175, CNRS, Université de Montpellier, Université
Paul-Valéry Montpellier, EPHE, 1919 route de Mende, 34293 Montpellier Cedex 5, France. 3 Laboratorio Ecotono, INIBIOMA (CONICET-Universidad Nacional del
Comahue), Quintral 1250, 8400 Bariloche, Argentina.
Acknowledgements
We thank the field team in Bariloche, Argentina for their assistance with the condor capture, tag attachment and recovery and at Rocher des Aigles, Rocamadour, France, for tag deployment during their daily flight of the griffon vulture. Andean condor data collection was funded by the National Geographic (grant GEFNE89-13 awarded to ELCS), CONICET-PIP-0095, ANPCyT-PICT-0725 (2014), and FBBVA (project BIOCON-08-126). Permissions to tag condors were given by Fauna de Río Negro, the Argentine National Park Administration and the owners and managers of local farms. The authors would also like to thank Mark Holton and Phil Hopkins for DD tag and housing design, and Rory Wilson, Ed Grundy and James Walker for assistance with DD analysis. HJW is funded by a Swansea University PhD studentship, and we
Additional file
Additional file 1. Smoothed sway individual frequency distributions and the model outputs predicting altitude change and relative airspeed.
would like to acknowledge ELCS, Andrew King and Adrian Luckman for their supervision.
Compliance with ethical guidelines Competing interests
The authors declare that they have no competing interests. Received: 28 January 2015 Accepted: 28 January 2015
References
1. Ropert-Coudert Y, Wilson RP. Trends and perspectives in animal-attached remote sensing. Front Ecol Environ. 2005;3(8):437–44.
2. McClune DW, Marks NJ, Wilson RP, Houghton JDR, Montgomery IW, McGowan NE, et al. Tri-axial accelerometers quantify behaviour in the Eurasian badger (Meles meles): towards an automated interpretation of field data. Anim Biotelemetry. 2014;2(5):1–6.
3. Laich AG, Wilson RP, Quintana F, Shepard ELC. Identification of impe-rial cormorant Phalacrocorax atriceps behaviour using accelerometers. Endanger Species Res. 2009;10:29–37. doi:10.3354/esr00091.
4. Watanabe S, Izawa M, Kato A, Ropert-Coudert Y, Naito Y. A new technique for monitoring the detailed behaviour of terrestrial animals: a case study with the domestic cat. Appl Anim Behav Sci. 2005;94(1–2):117–31. doi:10.1016/j.applanim.2005.01.010.
5. Yoda K, Naito Y, Sato K, Takahashi A, Nishikawa J, Ropert-Coudert Y, et al. A new technique for monitoring the behaviour of free-ranging adélie penguins. J Exp Biol. 2001;204:685–90.
6. Yoda K, Sato K, Niizuma Y, Kurita M, Bost C-A, Maho YL, et al. Precise moni-toring of porpoising behaviour of Adélie penguins determined using acceleration data loggers. J Exp Biol. 1999;202:3121–6.
7. Shamoun-Baranes J, Bom R, van Loon EE, Ens BJ, Oosterbeek K, Bouten W. From sensor data to animal behaviour: an oystercatcher example. PLoS One. 2012;7(5):e37997. doi:10.1371/journal.pone.0037997.
8. Shepard ELC, Wilson RP, Quintana F, Gómez Laich A, Liebsch N, Albareda DA, et al. Identification of animal movement patterns using tri-axial accel-erometry. Endanger Species Res. 2008;10:47–60. doi:10.3354/esr00084. 9. Halsey LG, Shepard EL, Wilson RP. Assessing the development and
appli-cation of the accelerometry technique for estimating energy expendi-ture. Comp Biochem Physiol A Mol Integr Physiol. 2011;158(3):305–14. doi:10.1016/j.cbpa.2010.09.002.
10. Clark TD, Sandblom E, Hinch SG, Patterson DA, Frappell PB, Farrell AP. Simultaneous biologging of heart rate and acceleration, and their relationships with energy expenditure in free-swimming sockeye salmon (Oncorhynchus nerka). J Comp Physiol [B]. 2010;180(5):673–84. doi:10.1007/s00360-009-0442-5.
11. Wilson RP, White CR, Quintana F, Halsey LG, Liebsch N, Martin GR, et al. Moving towards acceleration for estimates of activity-specific meta-bolic rate in free-living animals: the case of the cormorant. J Anim Ecol. 2006;75(5):1081–90. doi:10.1111/j.1365-2656.2006.01127.x.
12. Iwata T, Sakamoto KQ, Takahashi A, Edwards EWJ, Staniland IJ, Trathan PN, et al. Using a mandible accelerometer to study fine-scale foraging behav-ior of free-ranging Antarctic fur seals. Mar Mamm Sci. 2012;28(2):345–57. doi:10.1111/j.1748-7692.2011.00482.x.
13. Wilson RP, Grundy E, Massy R, Soltis J, Tysse B, Holton M, et al. Wild state secrets: ultra-sensitive measurement of micro-movement can reveal internal processes in animals. Front Ecol Environ. 2014;12(10):582–7. doi:10.1890/140068.
14. Duriez O, Kato A, Tromp C, Dell’Omo G, Vyssotski AL, Sarrazin F, et al. How cheap is soaring flight in raptors? A preliminary investigation in freely-flying vultures. PLoS One. 2014;9(1):e84887. doi:10.1371/journal. pone.0084887.
15. Halsey LG, Portugal SJ, Smith JA, Murn CP, Wilson RP. Recording raptor behavior on the wing via accelerometry. J Field Ornithol. 2009;80(2):171– 7. doi:10.1111/j.1557-9263.2009.00219.x.
16. Nathan R, Spiegel O, Fortmann-Roe S, Harel R, Wikelski M, Getz WM. Using tri-axial acceleration data to identify behavioral modes of free-ranging
animals: general concepts and tools illustrated for griffon vultures. J Exp Biol. 2012;215(Pt 6):986–96. doi:10.1242/jeb.058602.
17. Shepard EL, Lambertucci SA, Vallmitjana D, Wilson RP. Energy beyond food: foraging theory informs time spent in thermals by a large soaring bird. PLoS One. 2011;6(11):e27375. doi:10.1371/journal.pone.0027375. 18. Bohrer G, Brandes D, Mandel JT, Bildstein KL, Miller TA, Lanzone M, et al.
Estimating updraft velocity components over large spatial scales: con-trasting migration strategies of golden eagles and turkey vultures. Ecol Lett. 2012;15(2):96–103. doi:10.1111/j.1461-0248.2011.01713.x. 19. Pennycuick CJ. Bird flight performance: a practical calculation manual.
New York: Oxford University Press; 1989.
20. Shamoun-Baranes J, Bouten W, van Loon EE. Integrating meteorol-ogy into research on migration. Integr Comp Biol. 2010;50(3):280–92. doi:10.1093/icb/icq011.
21. Mandel JT, Bildstein KL, Bohrer G, Winkler DW. Movement ecology of migration in turkey vultures. PNAS. 2008;105(49):19102–7. doi:10.1073/ pnas.0801789105.
22. Lanzone MJ, Miller TA, Turk P, Brandes D, Halverson C, Maisonneuve C, et al. Flight responses by a migratory soaring raptor to changing meteor-ological conditions. Biol Lett. 2012;8(5):710–3. doi:10.1098/rsbl.2012.0359. 23. Shamoun-Baranes J, Liechti O, Yom-Tov Y, Leshem Y. Using a convection
model to predict altitudes of white stork migration over central Israel. Bound-Layer Meteorol. 2003;107:673–81.
24. Bouten W, Baaij EW, Shamoun-Baranes J, Camphuysen KCJ. A flexible GPS tracking system for studying bird behaviour at multiple scales. J Ornithol. 2012;154(2):571–80. doi:10.1007/s10336-012-0908-1.
25. Sakamoto KQ, Takahashi A, Iwata T, Yamamoto T, Yamamoto M, Trathan PN. Heart rate and estimated energy expenditure of flapping and glid-ing in black-browed albatrosses. J Exp Biol. 2013;216(Pt 16):3175–82. doi:10.1242/jeb.079905.
26. Reynolds KV, Thomas AL, Taylor GK. Wing tucks are a response to atmospheric turbulence in the soaring flight of the steppe eagle Aquila
nipalensis. J R Soc Interface R Soc. 2014;11(101):20140645. doi:10.1098/ rsif.2014.0645.
27. Wilson RP, Shepard ELC, Liebsch N. Prying into the intimate details of animal lives: use of a daily diary on animals. Endanger Species Res. 2008;4:123–37. doi:10.3354/esr00064.
28. Shamoun-Baranes J, Bouten W, Camphuysen CJ, Baaij EW. Riding the tide: intriguing observations of gulls resting at sea during breeding. Ibis. 2011;153:411–5.
29. Pennycuick CJ. Gliding flight of the white-backed vulture Gyps africanus. J Exp Biol. 1971;55:13–38.
30. Lentink D, Muller UK, Stamhuis EJ, de Kat R, van Gestel W, Veldhuis LL, et al. How swifts control their glide performance with morphing wings. Nature. 2007;446(7139):1082–5. doi:10.1038/nature05733.
31. Tucker VA. Gliding flight: speed and acceleration of ideal falcons during diving and pull out. J Exp Biol. 1998;201:403–14.
32. Boslough MBE. Autonomous dynamic soaring platform for distributed mobile sensor arrays. Washington: Sandia National Laboratories: Albu-querque; 2002.
33. Clark CJ. Courtship dives of Anna’s hummingbird offer insights into flight performance limits. Proc Biol Sci R Soc. 2009;276(1670):3047–52. doi:10.1098/rspb.2009.0508.
34. Lambertucci SA, Alarcón PAE, Hiraldo F, Sanchez-Zapata JA, Blanco G, Donázar JA. Apex scavenger movements call for transboundary conservation policies. Biol Conserv. 2014;170:145–50. doi:10.1016/j. biocon.2013.12.041.
35. Shepard EL, Lambertucci SA. From daily movements to population distri-butions: weather affects competitive ability in a guild of soaring birds. J R Soc Interface R Soc. 2013;10(88):20130612. doi:10.1098/rsif.2013.0612.
36. Ferguson-Lees J, Christie DA. Raptors of the world. London: Helm Identifi-cation Guides; 2001.
37. Rappole JH, Tipton AR. New harness design for attachment of radio transmitters to small passerines (Nuevo Diseño de Arnés para Atar Trans-misores a Passeriformes Pequeños). J Field Ornithol. 1991;62(3):335–7 38. Pennycuick CJ. Soaring behaivour and performance of some east african
birds, observed from a motor-glider. Ibis. 1971;114:178–218. 39. Soltis J, Wilson RP, Douglas-Hamilton I, Vollrath F, King LE, Savage A.
Accelerometers in collars identify behavioral states in captive African elephants Loxodonta africana. Endanger Species Res. 2012;18(3):255–63. doi:10.3354/esr00452.
40. Resheff YS, Rotics S, Harel R, Spiegel O, Nathan R. AcceleRater: a web application for supervised learning of behaviour modes from accelera-tion measurements. Mov Ecol. 2014;2:27. doi:10.1186/s40462-014-0027-0. 41. Bidder OR, Campbell HA, Gomez-Laich A, Urge P, Walker J, Cai Y, et al.
Love thy neighbour: automatic animal behavioural classification of acceleration data using the K-nearest neighbour algorithm. PLoS One. 2014;9(2):e88609. doi:10.1371/journal.pone.0088609.
42. Walker JS, Jones MW, Laramee RS, Holton MD, Shepard EL, Williams HJ et al. Prying into the intimate secrets of animal lives; software beyond hardware for comprehensive annotation in ‘Daily Diary’ tags. Mov Ecol. 2015. (In Press).
43. Sakamoto KQ, Sato K, Ishizuka M, Watanuki Y, Takahashi A, Daunt F, et al. Can ethograms be automatically generated using body acceleration data from free-ranging birds? PLoS One. 2009;4(4):e5379. doi:10.1371/journal. pone.0005379.
44. Sato K, Sakamoto KQ, Watanuki Y, Takahashi A, Katsumata N, Bost C-A, Weimerskirch H. Scaling of soaring seabirds and implications for flight abilities of giant pterosaurs. PLoS One. 2009;4(4):e5400. doi: 10.1371/jour-nal.pone.0005400.
45. Shepard ELC, Wilson RP, Laich AG, Quintana F. Buoyed up and slowed down: speed limits for diving birds in shallow water. Aquat Biol. 2010;8:259–67. doi:10.3354/ab00232.
46. Shepard ELC, Wilson RP, Halsey LG, Quintana F, Gómez Laich A, Gleiss AC, et al. Derivation of body motion via appropriate smoothing of accelera-tion data. Aquat Biol. 2008;4:235–41. doi:10.3354/ab00104.
47. Qasem L, Cardew A, Wilson A, Griffiths I, Halsey LG, Shepard EL, et al. Tri-axial dynamic acceleration as a proxy for animal energy expenditure; should we be summing values or calculating the vector? PLoS One. 2012;7(2):e31187. doi:10.1371/journal.pone.0031187.
48. Wilson JW, Mills MG, Wilson RP, Peters G, Mills ME, Speakman JR, et al. Cheetahs, Acinonyx jubatus, balance turn capacity with pace when chas-ing prey. Biol Lett. 2013;9(5):20130620. doi:10.1098/rsbl.2013.0620. 49. Nakagawa S, Schielzeth H. A general and simple method for obtaining
R2 from generalized linear mixed-effects models. Methods Ecol Evol.
2013;4:133–42. doi:10.1111/j.2041-210x.2012.00261.x.
50. Pennycuick CJ. Modelling the flying bird, vol. 5. Boston: Elsevier; 2008. 51. Martiskainen P, Järvinen M, Skön J-P, Tiirikainen J, Kolehmainen M,
Mon-onen J. Cow behaviour pattern recognition using a three-dimensional accelerometer and support vector machines. Appl Anim Behav Sci. 2009;119(1–2):32–8. doi:10.1016/j.applanim.2009.03.005.
Submit your next manuscript to BioMed Central and take full advantage of:
• Convenient online submission
• Thorough peer review
• No space constraints or color figure charges
• Immediate publication on acceptance
• Inclusion in PubMed, CAS, Scopus and Google Scholar
• Research which is freely available for redistribution Submit your manuscript at